Dr. Spencer also finds an independent method of determining Earth's radiative fluxes [fig 6 below], since "radiative fluxes are so important (e.g. being the basis for global warming theory) that any independent means of estimating them are worth looking into." "Be careful in interpreting the estimated radiative fluxes in Fig. 6 because they could have an offset. Since the anomalies I compute (by definition) sum to zero over the entire time series, that means the total time-integrated radiative energy flux also sums to zero. So, while the graph in Fig. 6 suggests energy loss by the global oceans over the last 5 years, it could be the whole curve needs to be shifted upward. There is no way to know."
I have overlaid the CO2 forcing from increased CO2 levels since 1987 as the red line in Dr. Spencer's Fig. 6 below, based upon the IPCC/Myhre formula for CO2 forcing due to the change in CO2 levels of 349.16 ppm in 1987 to 400 ppm today,
5.35*ln(400/349.16)=0.73 W/m2

which clearly illustrates a disconnect between CO2 levels and net radiative flux, and demonstrates CO2 radiative forcing is not the so-called climate "control knob."
However, all IPCC models are based upon the IPCC/Myhre formula for CO2 radiative forcing, and despite the complexity of the models, the global warming predictions essentially follow this simple formula 1:1:
 |
| You don't even need a climate model to show what climate models predict - projections are based upon a single independent variable - CO2 |
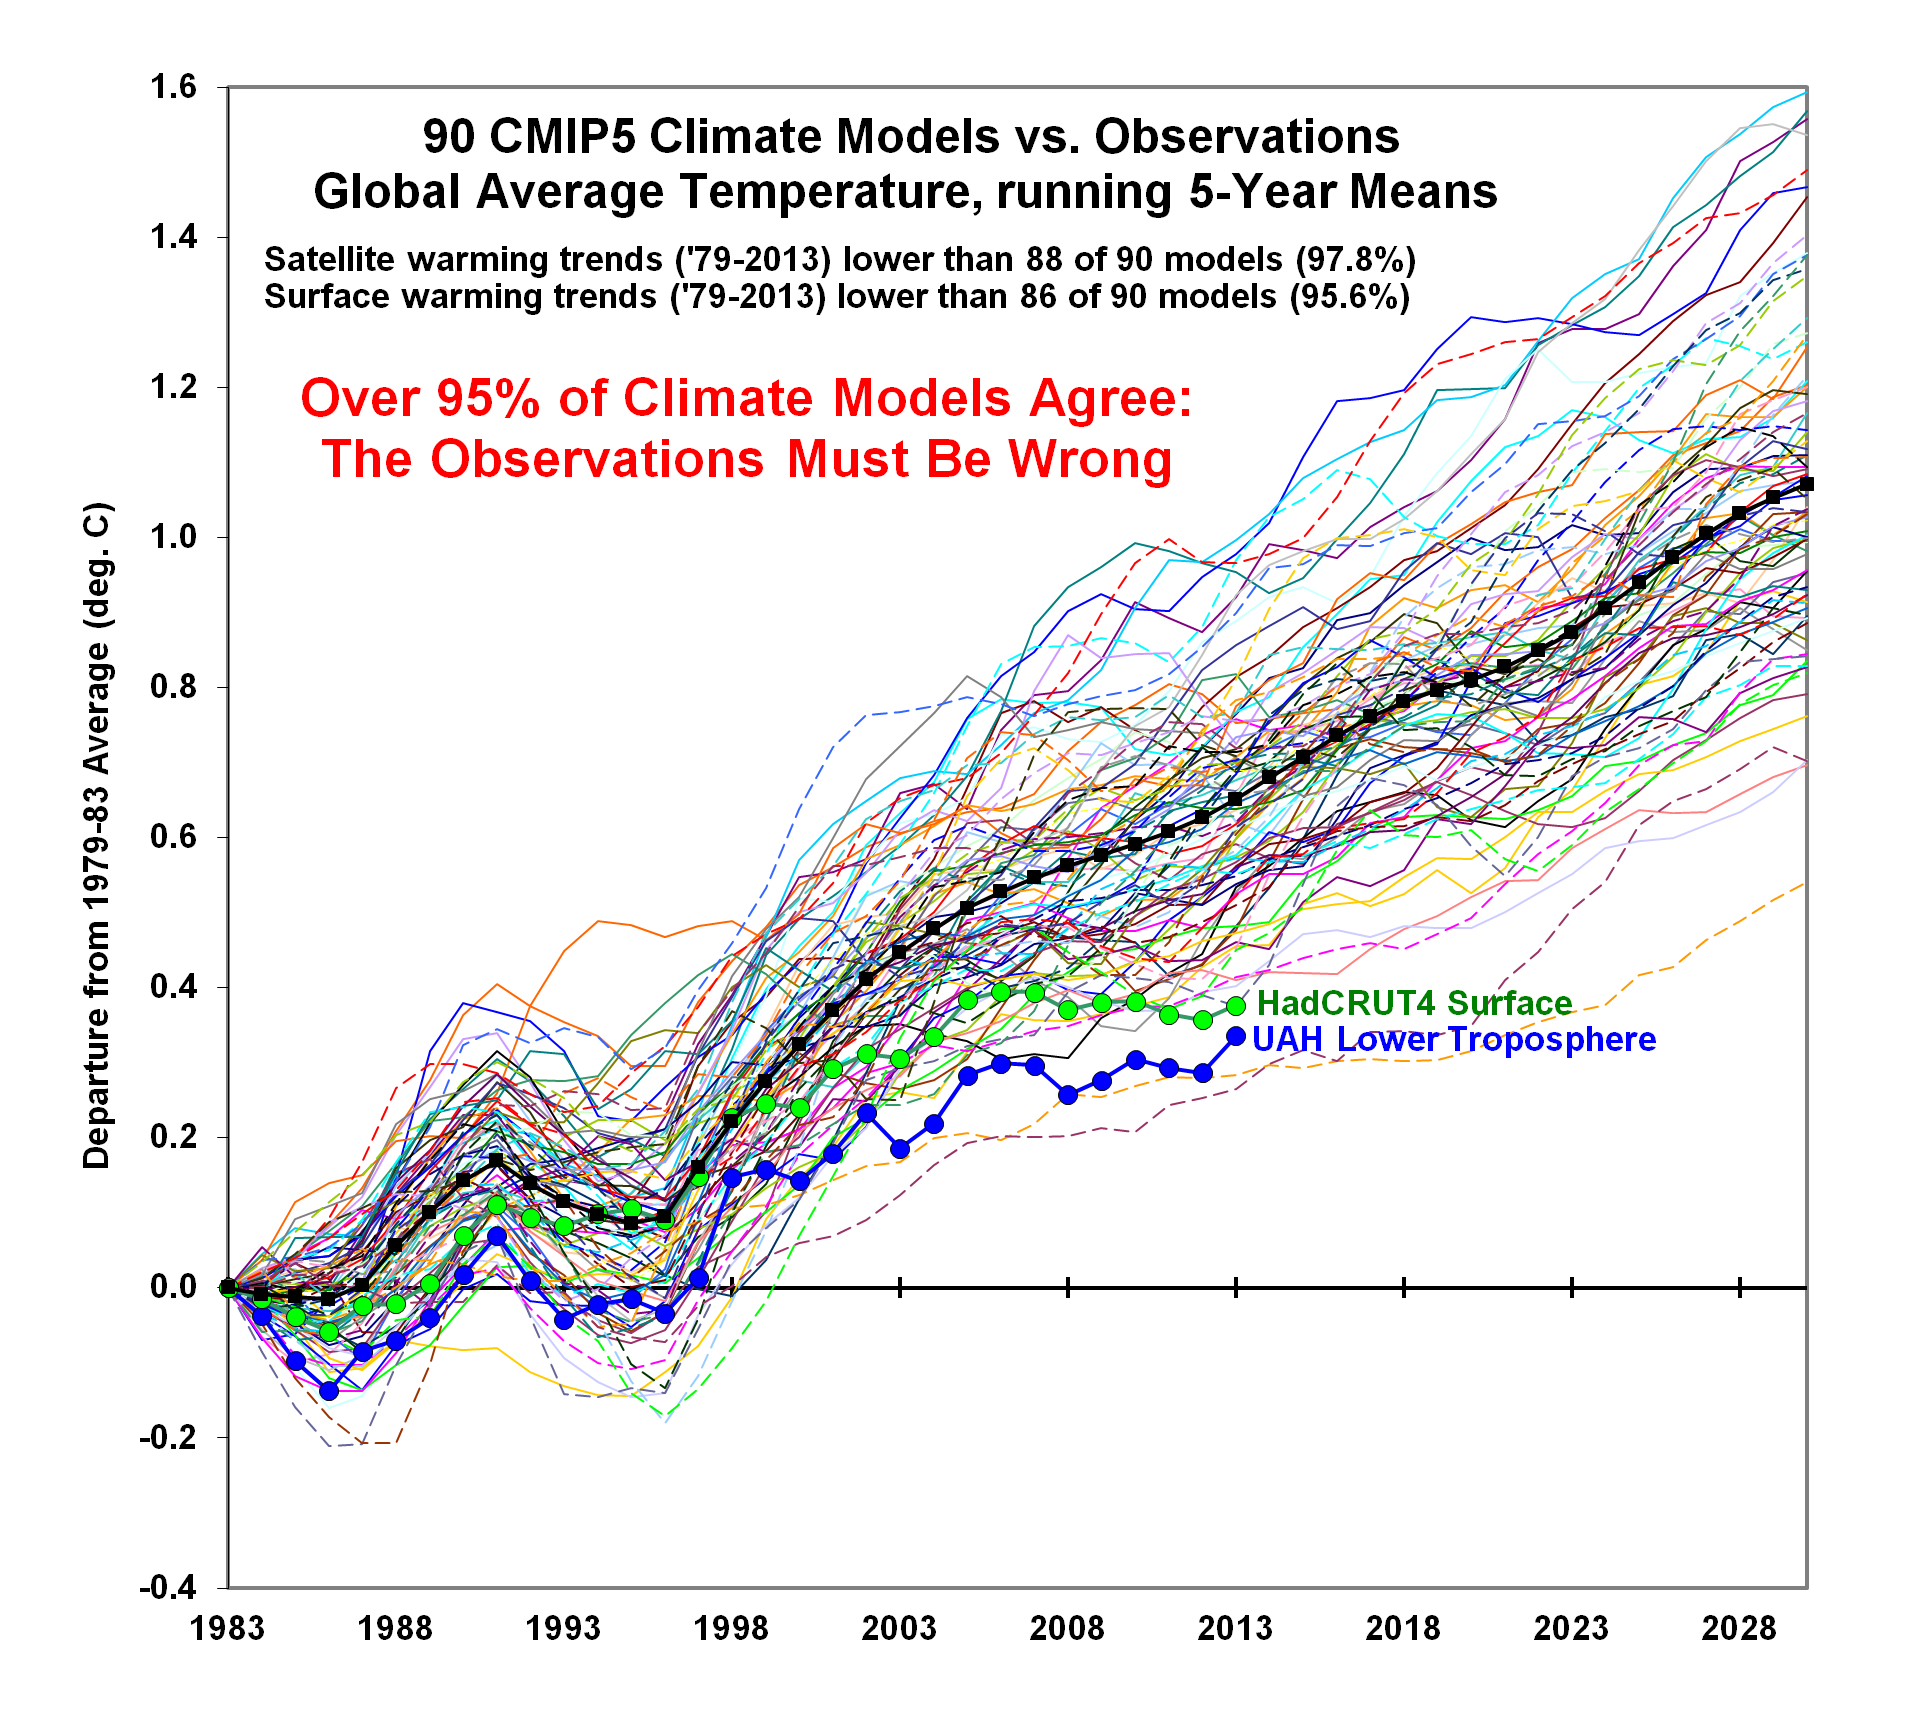
Thus explaining why the models have been falsified at confidence levels exceeding 98%.
SSM/I Global Ocean Product Update: Increasing clouds with a chance of cooling
by Roy W. Spencer, Ph. D.
My research field of satellite passive microwave remote sensing took off like a rocket (pun intended) when the first Special Sensor Microwave/Imager (SSM/I, built by Hughes Aircraft) was launched in mid-1987 on the DoD series of weather satellites (DMSP).
We SO anticipated that first instrument…good calibration, and high frequency channels to estimate precipitation over land. The previous NASA instruments (ESMR-5, -6, and SMMR) were a good start, but had limited channel selection and less than optimal calibration strategies.
The SSM/I instrument series was later redesigned to incorporate the temperature sounding channels (SSMIS, built by Aerojet). (By the way, we don’t use these in our UAH global temperature monitoring work, since we receive very little money to produce the UAH datasets and incorporating an entirely new series of instruments would be a major effort).
But the real benefit of the SSM/I series of satellite sensors was the production of the “ocean suite” of products: integrated water vapor, surface wind speed, integrated cloud water, and rain rate. These continue to be produced by several investigators, and I use those produced by Remote Sensing Systems (RSS).
To help interpret the SSM/I measurements, let’s start with the HadSST3 sea surface temperatures (SSTs) measured since July, 1987, which is when SSM/I data first became available. (All of the following time series are monthly global anomalies since July, 1987; some have trailing 6-month averages plotted as well). It shows the well-known warming up until the 1997/98 El Nino, then roughly level temperatures since then.
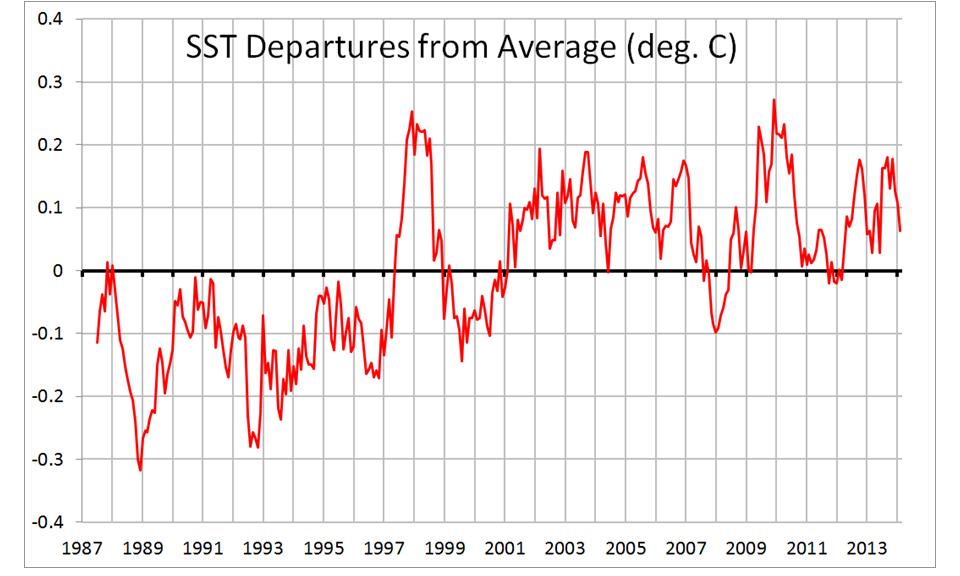 |
| Fig. 1. Monthly global oceanic HadSST3 anomalies from July 1987 thru Feb. 2014. |
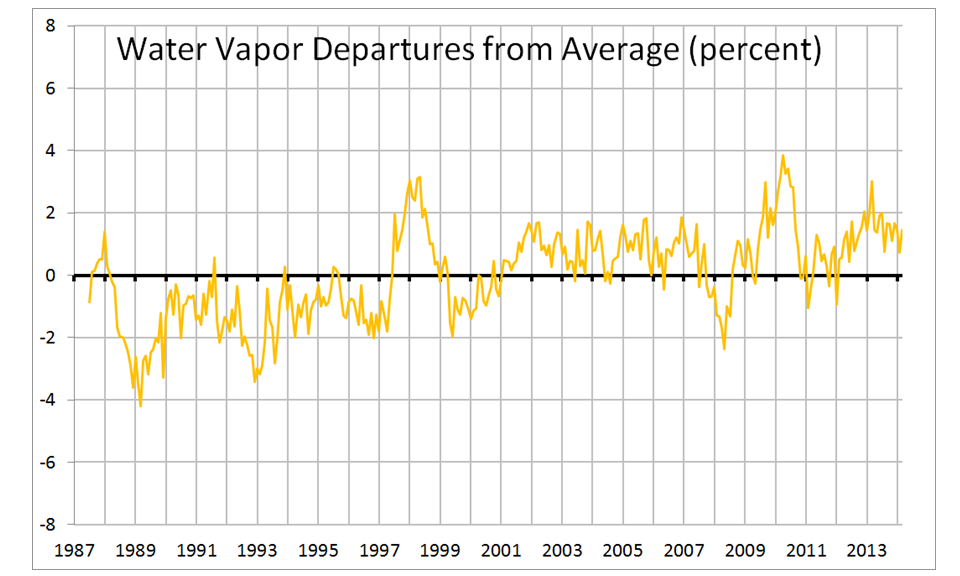 |
| Fig. 2. Monthly global oceanic anomalies in SSM/I total integrated water vapor. |
Next, let’s examine the surface wind speed variations from SSM/I. These have been compared to literally millions of buoy wind measurements, and are quite accurate. In fact, I would wager these are by far the best estimate of changes in global ocean wind speed we have:
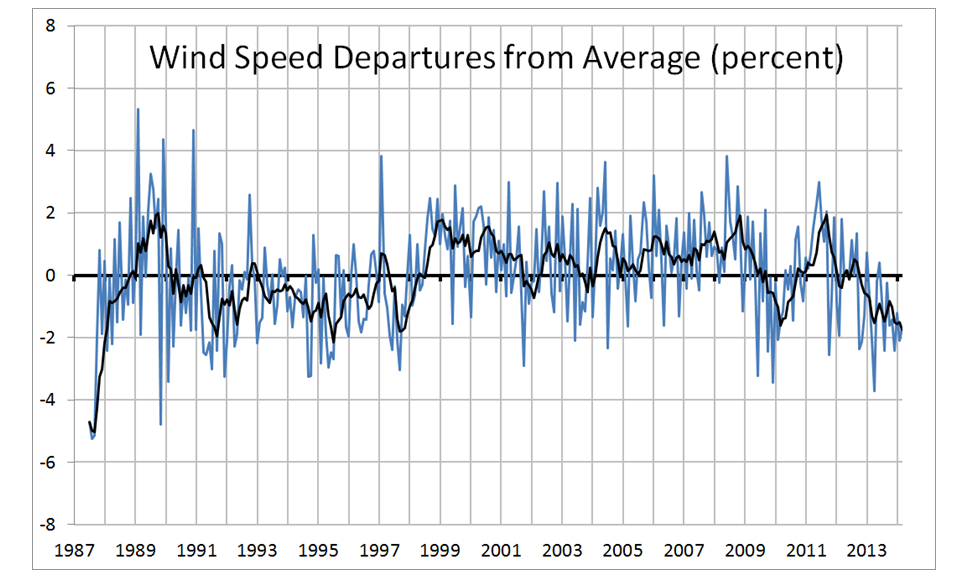 |
| Fig. 3. Monthly global oceanic anomalies in surface wind speed from SSM/I. |
The SSM/I rain rate variations are always quite noisy. Warm conditions tend to show more rainfall, but the strong 1997/98 El Nino curiously shows little effect, and there is a hint of increasing ocean rainfall in recent years:
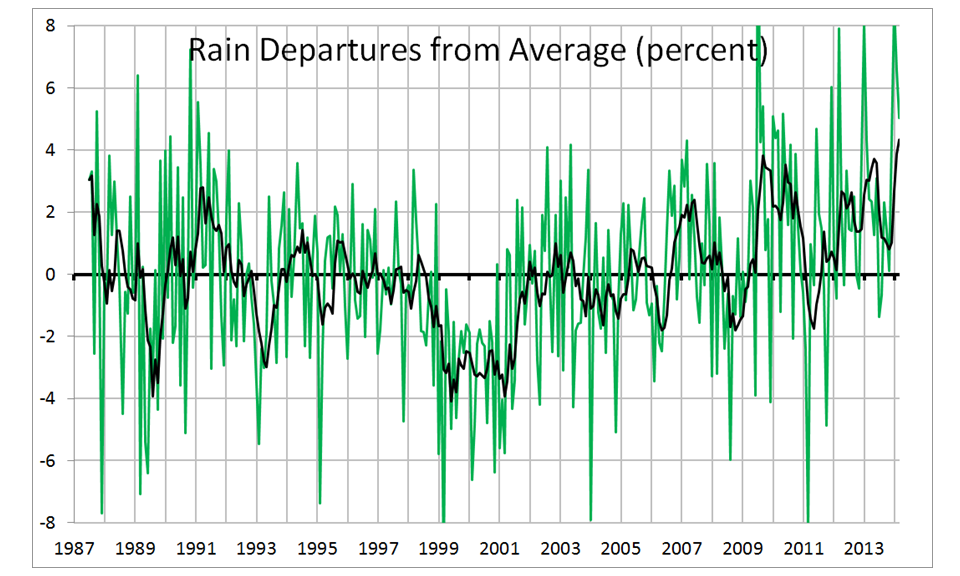 |
| Fig. 4. Monthly global oceanic anomalies in rainfall from SSM/I. |
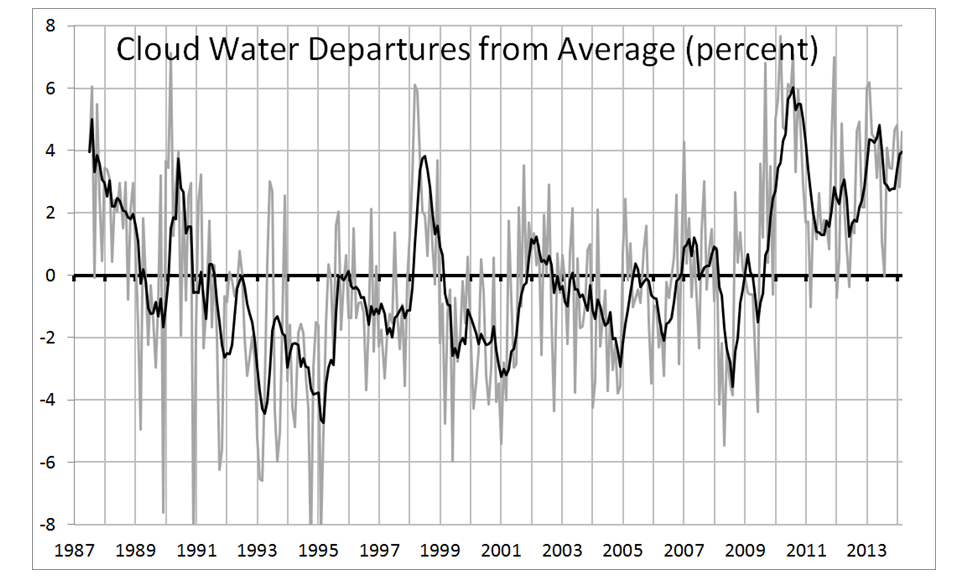 |
| Fig. 5. Monthly global oceanic anomalies in integrated cloud water from SSM/I. |
The updated regression relationship I get is 0.24 W/m2 loss in Net (solar plus IR) radiative energy for each percent increase in SSM/I cloud water, a scale factor we can then apply to the cloud water graph to get a Net radiative flux graph:
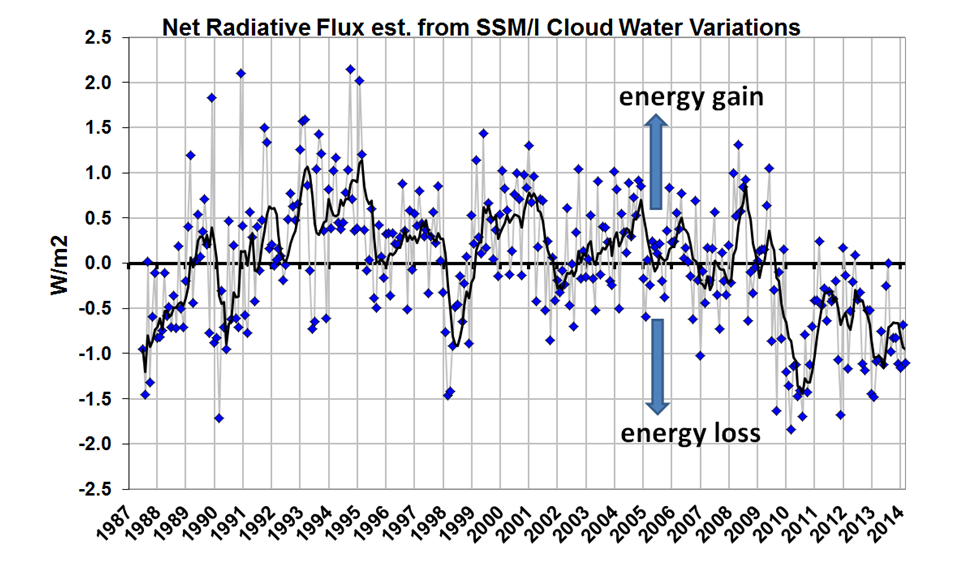 |
| Fig. 6. Monthly global oceanic anomalies in Net radiative flux estimated from SSM/I cloud water variations, using a CERES-based scale factor of 0.24 W/m2 per percent cloud water change. |
Why use an SSM/I estimate of CERES Net radiative flux, instead of CERES directly? Mostly because CERES is available only since 2000, whereas SSM/I is available since 1987. But also, the CERES measurements are very difficult, with the reflected solar flux (which dominates the CERES-SSM/I relationship) having a strong angular dependence. The SSM/I measurements are instead thermally-based (microwave emission) and have no such angular dependence. Finally, radiative fluxes are so important (e.g. being the basis for global warming theory) that any independent means of estimating them are worth looking into.
Be careful in interpreting the estimated radiative fluxes in Fig. 6 because they could have an offset. Since the anomalies I compute (by definition) sum to zero over the entire time series, that means the total time-integrated radiative energy flux also sums to zero. So, while the graph in Fig. 6 suggests energy loss by the global oceans over the last 5 years, it could be the whole curve needs to be shifted upward. There is no way to know. The CERES fluxes have already been adjusted to match the increase in oceanic heat content, which was a logical thing for the CERES Team to do since the absolute accuracy of CERES is ~10 W/m2, whereas the increase in ocean heat content in recent years (IF you believe the warming estimates) correspond to only a few tenths of a W/m2 imbalance. The main value in the graph is to identify possible changes over time.
Others might see some relationships in the above plots that I haven’t noticed; I’ve made the Excel spreadsheet available for those who want to play with the data.


