Richard Lindzen PhD, the Alfred P. Sloan Professor of Meteorology in the Department of Earth, Atmospheric, and Planetary Sciences at the Massachusetts Institute of Technology, was recently invited to give a talk entitled "The Peculiar Issue of Global Warming" at Fermilab 2/10/10 which you can watch in its entirety with slides here. Dr. Lindzen calmly eviscerates the theory of catastrophic anthropogenic global warming (CAGW) and the IPCC "consensus". Highly recommended. Some of the key slides from the presentation are archived at the link below. Below are 3 slides from the presentation, the first noting that the theory of intelligent design sounds rigorous by comparison to the theory of anthropogenic global warming, the second noting that 3 pro-CAGW publications have already acknowledged that temperature data has contradicted the man-made attribution assumption (primarily CO2), which is the inherent assumption of the IPCC models, and the third noting that the fundamental assumption of CAGW that there is positive feedback by water vapor due to CO2 is "likely wrong".
Saturday, February 27, 2010


Sea Levels: Large Variances between Tide Gauges and Satellite Altimetry
Determining changes in global sea levels is an enormously complicated undertaking, with measurement error, calibration error, seasonal adjustments, and regional differences as four of the most significant problems to overcome. Different types of measurement achieve different results. For instance, Sea Level Expert Dr. Nils-Axel Mörner (see post just prior to this also) finds that careful analysis of historical tide gauge records (correcting for subsiding, tectonic shifts, etc) shows no significant global sea level rise during most of the 20th century, and also finds corroboration of this from the geologic and coral reef records in the field (if the sea level doesn't rise reefs have to grow laterally rather than vertically, etc.).
- Large divergences between GPS-corrected tide gauges and satellite altimetry at the same location (see below)
- Use of two different satellites at different times, and two different altimeters "due to degradation in the original instrument" on TOPEX with different electronics and resultant measurement divergence
- And factors mentioned in Nerem et al:
"Satellite altimetry is somewhat unique in that many adjustments must be made to the raw range measurements to account for atmospheric delays (ionosphere, troposphere), ocean tides, variations in wave height (which can bias how the altimeter measures sea level), and a variety of other effects. In addition, the sea level measurements can be affected by the method used to process the altimeter waveforms, and by the techniques and data used to compute the orbit of the satellite. Early releases of the satellite Geophysical Data Records (GDRs) often contain errors in the raw measurements, the measurement corrections, and the orbit estimates." Nerem et al also mentions other major problems such as drift in the TOPEX microwave radiometer, a change from the original TOPEX altimeter to the back-up altimeter in 1999 "due to degradation in the original instrument" which had "different electronics" from the original resulting in divergent measurements which had to be "corrected'.
What about the first point, that there are large variances between GPS-corrected tide gauges and satellite altimetry at the same location? Here are 2 graphs from the University of Colorado at Boulder Sea Level Change site:
TOPEX calibration

Sea Level Expert: "80% of us disagree with the IPCC"
according to an interview recorded 5 days ago with Sea Level Expert Dr. Nils-Axel Mörner. Dr. Mörner is the recently-retired head of the Paleogeophysics and Geodynamics department at Stockholm University in Sweden. He is past president (1999-2003) of the INQUA Commission on Sea Level Changes and Coastal Evolution, leader of the Maldives Sea Level Project. Dr. Mörner been studying the sea level and its effects on coastal areas for some 38 years.
In the interview, Dr. Morner states that none of the 33 authors of the 2001 IPCC Chapter on sea levels was considered to be a sea level expert, that all 33 were from other disciplines and selected "due to loyalty" to the IPCC. Furthermore, Dr. Morner estimates that of the 300-400 individual scientists "in the sea-level [scientific] community", 80% of sea-level experts disagree with the IPCC conclusions regarding sea level rise.
I have emailed Dr. Morner for his reply to the critique by Nerem et al and any comments on the post here "Global Sea Level Decrease 2004-2010 Part 2" and will post his reply here.
Graphs from a Chapter written by Dr. Morner in the book Encyclopedia of Coastal Science by Maurice L. Schwartz, editor, showing TOPEX satellite altimetry data with no long term trend prior to the slew of adjustments broadly outlined by Nerem et al:

Graphs from a Chapter written by Dr. Morner in the book Encyclopedia of Coastal Science by Maurice L. Schwartz, editor, showing TOPEX satellite altimetry data with no long term trend prior to the slew of adjustments broadly outlined by Nerem et al:

Friday, February 26, 2010
Push to Oversimplify at Climate Panel
Article showing the IPCC paleoclimate reconstructions are oversimplified and overstated as also shown in prior hockey schtick posts here and here.
From the Front Page of THE WALL STREET JOURNAL today 02/26/2010
![[IPCC_SUB]](http://si.wsj.net/public/resources/images/P1-AT994_IPCC_S_F_20100225192743.jpg)
In the next few days, the world's leading authority on global warming plans to roll out a strategy to tackle a tough problem: restoring its own bruised reputation.
A months-long crisis at the Intergovernmental Panel on Climate Change has upended the world's perception of global warming, after hacked emails and other disclosures revealed deep divisions among scientists working with the United Nation-sponsored group. That has raised questions about the panel's objectivity in assessing one of today's most hotly debated scientific fields.
The problem stems from the IPCC's thorny mission: Take sophisticated and sometimes inconclusive science, and boil it down to usable advice for lawmakers. To meet that goal, scientists working with the IPCC say they sometimes faced institutional bias toward oversimplification, a Wall Street Journal examination shows. Read more at article link above.
Michael Mann is angry about this article
From the Front Page of THE WALL STREET JOURNAL today 02/26/2010
The group expressed 'regret' last month for an erroneous projection in its influential 2007 climate report that the Himalayan glaciers could melt by 2035.
A months-long crisis at the Intergovernmental Panel on Climate Change has upended the world's perception of global warming, after hacked emails and other disclosures revealed deep divisions among scientists working with the United Nation-sponsored group. That has raised questions about the panel's objectivity in assessing one of today's most hotly debated scientific fields.
The problem stems from the IPCC's thorny mission: Take sophisticated and sometimes inconclusive science, and boil it down to usable advice for lawmakers. To meet that goal, scientists working with the IPCC say they sometimes faced institutional bias toward oversimplification, a Wall Street Journal examination shows. Read more at article link above.
Michael Mann is angry about this article
Thursday, February 25, 2010
Baby steps to a Mea Culpa?
[Trenberth sort-of goes public with his climategate email in graph at the header]
Scientists examine causes for lull in warming
* Exact causes unknown for lack of warming from 1999-2008
* The underlying reason for cold winter not known
* Climate science in focus after email scandal, errors
By Gerard Wynn and Alister Doyle LONDON/OSLO, Feb 25 (Reuters) - Climate scientists must do more to work out how exceptionally cold winters or a dip in world temperatures fit their theories of global warming, if they are to persuade an increasingly sceptical public. At stake is public belief that greenhouse gas emissions are warming the planet, and political momentum to act as governments struggle to agree a climate treaty which could direct trillions of dollars into renewable energy, away from fossil fuels. Public conviction of global warming's risks may have been undermined by an error in a U.N. panel report exaggerating the pace of melt of Himalayan glaciers and by the disclosure of hacked emails revealing scientists sniping at sceptics, who leapt on these as evidence of data fixing. Scientists said they must explain better how a freezing winter this year in parts of the northern hemisphere and a break in a rising trend in global temperatures since 1998 can happen when heat-trapping gases are pouring into the atmosphere. "There is a lack of consensus," said Kevin Trenberth, head of the Climate Analysis Section at the U.S. National Center for Atmospheric Research, on why global temperatures have not matched a peak set in 1998, or in 2005 according to one U.S. analysis. Part of the explanation could be a failure to account for rapid warming in parts of the Arctic, where sea ice had melted, and where there were fewer monitoring stations, he said. "I think we need better analysis of what's going on on a routine basis so that everyone, politicians and the general public, are informed about our current understanding of what is happening, more statements in a much quicker fashion instead of waiting for another six years for the next IPCC report." The latest, fourth Intergovernmental Panel on Climate Change (IPCC) report was published in 2007 and the next is due in 2014. The proportion of British adults who had no doubt climate change was happening had dropped in January to 31 percent from 44 percent in January 2009, an Ipsos MORI poll showed this week.
The Reference Frame analysis of this news item
The Reference Frame analysis of this news item
Wednesday, February 24, 2010
Another Analysis Confirms Greenhouse Effect of CO2 already Saturated
Unpublished paper well worth a read available today at climaterealists.com by mechanical engineer and heat transfer expert Dan Pangburn
"is a comprehensive discussion of the science relating to the Global Warming issue and includes a fairly simple model (on page 15) that accurately predicts all average global temperatures since 1895 including the recent decline.
I observed the many conflicting assertions regarding the existence and cause of Global Warming, particularly as to whether it was significantly contributed to by human activity.
This led to substantial curiosity as to the truth. As a result I have conducted research on the issue for thousands of hours for over three years and have determined that the belief that human activity has had a significant influence on global climate is a mistake.
Greenhouse Analogy
This may be how the mistake began. Incorrect conclusions may have been drawn from various observations and discoveries. Some of the discoveries and developments are..."
One of the conclusions pertinent to recent discussions and posts here is the corroboration using different methods that:
"at the present CO2 level, atmospheric carbon dioxide increase has no significant influence on [average global temperatures]"
Tuesday, February 23, 2010
Your Own IPCC Climate Computer
Hey kids, now you too can do your own climate modeling using the IPCC's own complex & sophisticated climate computer (97% of it). Just enter the starting CO2 level in parts per million and the ending and it will calculate how much global warming will occur! Here
Warning: do not use without parental supervision. Climate computer uses only 97% of the IPCC model of total positive radiative forcing since only 97% of it comes from CO2: temperature anomaly=4.7*ln(ending CO2/starting CO2). Model only applies to the 20th and 21st centuries since temperature anomalies bear no relation to the Medieval Warming Period with much lower CO2 levels nor the geologic record with CO2 levels in the mid-1000s per million throughout ice ages.The "official" temperature anomaly calculated by this computer is not guaranteed to match 97% of the IPCC model nor reality.
Great Reply to a Fan of AGW
From The Viscount Monckton of Brenchley
- I try to answer as many enquiries as I can from people who want to discuss “global warming”. I wrote this letter in reply to a “global warming” fanatic who, it is not unfair to say, had never actually thought about the superstition to which he subscribes. Perhaps this letter will make him think a little more and believe a little less.
Dear Enquirer, – Thank you for taking the trouble to write to me. If I may, I shall highlight various passages from your letter in bold face, and then respond to them seriatim in Roman face.
“I am not a climate scientist, and so I can only go by the overwhelming consensus amongst scientists that man-made climate change is occurring and that it poses a grave threat to humanity.”
First, science is not – repeat not – done by consensus. Aristotle, in codifying the dozen worst fallacies to which mankind is prone, described this one as the “head-count fallacy”, or, as the mediaeval schoolmen called it, the argumentum ad populum. Merely because many people say they believe a thing to be true, they do not necessarily believe it to be true and, even if they do, it need not necessarily be true. Abu Ali Ibn al-Haytham, the astronomer, mathematician and philosopher of science in 11th-century Iraq who is credited as the father of the scientific method, said this –
“The seeker after truth does not put his faith in any mere consensus, however broad and however venerable. Instead, he subjects what he has learned from it to scrutiny using his hard-won scientific knowledge, and he verifies for himself whether it is true. The road to the truth is long and hard, but that is the road we must follow.”
Nature Rules Climate: 2009 Paper & 8 Other Reasons
It would be nice if the climatologists would talk to the geologists and geophysicists more often, although sadly the emails show little if any attempt to do so. They might learn a lot about the real physical evidence on what has been changing climate since the beginning of time, instead of just presuming that since CO2 has risen in the 20th century from 0.0300% to 0.0388% of the atmosphere [note man-made contributions are only 3-4% of that...so the man-made CO2 has risen in the 20th century from 0.0012% to 0.001552% of the atmosphere] that that must be the "missing link" needed in the models to explain climate change, and then arbitrarily assigning the CO2 "missing link" 97% of the total positive radiative forcing in the computer models. Never-mind that:

Full Press Release and Abstract to Study:
- the greenhouse theory of positive feedback of radiative forcing of water vapor due to CO2 violates the 2nd law of thermodynamics
- the predicted tropical tropospheric hot spot this theory predicted never developed
- the water vapor positive feedback of radiative forcing due to CO2 has been shown to be incorrect and actually negative based on the actual data
- the models are vastly off track with the satellite data which shows sensitivity to CO2 far less than predicted [Lindzen's new pre-publication paper shows sensitivity of 0.3-1.2 degrees C for a doubling of CO2 concentration (which will take 234 years at the current rate) -much less than was assumed & here]
- the actual increase in CO2 in the 20th century is highly in doubt and may be much less (and even if it is correct, the time to double CO2 concentrations at the current rate is 234 years).
- in 5 of the 6 major ice ages CO2 levels were higher than the present, up to 20+ times higher, yet did not warm the planet. Also note, CO2 LAGS temperature in ice core data by ~800 years. CO2 lags temperature changes primarily due to solubility in the oceans.
- probable explanation of #6 is that the greenhouse effect of CO2 is already effectively saturated at the present levels. (and here)
- according to more than 800 scientist's papers, the Medieval Warming Period globally was as hot or hotter than the present, entirely due to natural processes- i.e. why should we presume this time it's any different?
- their models of the earths energy balance don't take into account ocean oscillations and that the oceans hold 98% of the earth's heat (there's more heat in the top 2.5m of the ocean than the entire atmosphere and the oceans cover ~70% of the earth's surface).
Nature not man responsible for recent global warming
Three Australasian researchers have shown that natural forces are the dominant influence on climate, in a study just published in the highly-regarded Journal of Geophysical Research. According to this study little or none of the late 20th century global warming and cooling can be attributed to human activity.
Monday, February 22, 2010
"Cliff Notes" on the last 2 Million Years of Climate Change
TEMPERATURE VARIATION ANCIENT AND MODERN
2 million years ago: Cycles in Earth’s relation to the sun produce alternating Ice Ages (lasting 90,000 to 100,000 years) and “intergalacials” (lasting 10,000 to 20,000 years). The onset of the glacial period is often slow but ends abruptly at the transition to the warm period. The average global temperature changes 5-7 degrees C during this transition but may rise as much as 10-15 degrees C over a time span of less than 75 years at higher latitudes.
Let us take a look at the climate of the past:
- 130,000 to 110,000 years ago: Eemian intergalacial, warm.
- 110,000 years ago: Fairly sudden shift to glacial conditions, over perhaps 400 years or less. Northern forests retreat south, ice sheets begin to take over much of the Northern hemisphere. Trees give way to grass, and then to deserts, as more water is frozen in ice sheets instead of falling as rain on vegetation.
- 60,000 to 55,000 years ago: In-between phase, partial melting of glaciers.
- 21,000 to 17,000 years ago: Last Ice Age reaches its coldest point. Deserts and semi-deserts take over much of the global land area. Sea levels are 400′ lower than today.
- 14,000 years ago: sudden warming, raising Earth temperatures to roughly present levels. Forests began to spread and the ice sheets to retreat. Sea levels begin to rise.
- 12,500 years ago: The Younger Dryas. After only 1,500 years of recovery from the Ice Age, the Earth suddenly shifts back into a new, short-lived ice age. The dramatic cooling seems to have occurred within 100 years or less. Another 1,000 years or so of ice age follow before another sudden shift back to climate warming.
- 11,500 years ago: The present intergalacial period known as the Holocene. The planet warms from ice age to nearly present world temperatures in less than 100 years. Half of the warming may have occurred in 15 years. Ice sheets melt, sea levels rise again, and forests expand. Trees replace grasslands and grass replace deserts.
- 9,000 to 5,000 years ago: Climate Optimum, warmer and wetter than the Earth’s present climate. The Saharan and Arabian deserts become wetter, supporting hunting, herding, and agriculture. The climate may have been “punctuated” by a cold, dry phase 8,200 years ago, with Africa drier than before.
- 2,600 years ago: Cooling event with relatively wet conditions in many parts of the world.
- 600 to 200 BC: Unnamed cold period preceding the Roman Warming.
- 200 BC to 600 AD: Roman Warming. Grape growing advances northward in both Italy and Britain.
- 600 to 900 AD: “Dark Ages” cold period.
- 900 to 1300 AD: Medieval Warming or Little Climate Optimum, recorded by histories in both Europe and Asia.
- 1300 to 1850 AD: Little Ice Age.
- 1850 to 1940: Warming, especially between 1920 and 1940.
- 1940 to 1975: Cooling trend.
- 1976 to 1978: Sudden warming spurt.
- 1979 to present: A moderate warming trend, very slight according to satellites and weather balloons, somewhat stronger according to surface thermometers.
Note: the figures provided for the last 1,000 years are clearly confirmed by means of Tree Rings and Ice cores in addition to human records.
Please anyone, explain to me how we know the climate changes of the present have anything at all to do with man and how our ever changing climate is any different from the continual and much more radical changes that have been going on since the beginning of time. Also, please stop calling me a "denier" - I know the climate changes radically in both directions, always has, always will. The only proper debate is the cause.
Adapted from Physical Evidence of Earth's Unstoppable 1,500 Year Climate Cycle by S. Fred Singer & Dennis T. Avery. Note: "Cliff's Notes" is a registered trademark and has absolutely no connection to this "Cliff Note"
Sunday, February 21, 2010
The IPCC's "Unequivocal Evidence" & clever tricks
I've done my best to photoshop-out the IPCC's version of "Mike's Nature Trick" from the Northern Hemisphere IPCC AR4 Paleoclimate reconstruction to simulate how it should have appeared, i.e. without the big black thick hockey stick line stuck on showing the faulty thermometer record (the "real temps": I’ve just completed Mike’s Nature trick of adding in the real temps to each series for the last 20 years (ie from 1981 onwards) and from 1961 for Keith’s to hide the decline."- Phil Jones email discussing his paper in 1999).


It is scientifically-improper to graft a thermometer record to a paleoclimate (e.g. tree-rings) proxy for temperature because trees are not thermometers, they are not calibrated to thermometers, there are many more important variables than temperature that can affect tree rings such as precipitation, location, CO2 (plant food) levels, cloudiness, soil quality, solar activity, weather patterns, etc. for which there is no reliable means to sort out. Even if this was proper, how can you possibly decide where to put the thermometer record on the Y axis compared to tree rings? Could just as well put it starting at -1 degree anomaly - nobody knows. Paleoclimate proxies can only be used to compare relative temperatures. For instance, the Medieval Warming Period (MWP) compared to the 20th century, which by the IPCC's own reconstruction does not show a statistically significant difference between the MWP and the 1940s as shown in the photoshopped graph. The tree-ring proxies started to take a dive around 1960 from which they did not recover, so to deal with this so called "divergence problem" the tree-ring data was either truncated at 1960 in 3 of the proxies, or left in as shown in the graph as taking a dive after ~1950 from which they never recover. But they did their best to further hide the decline by putting the thick black Trick line over the decline and making it look like the proxies showed an upturn in the late 70's just like the faulty thermometer record:

So this is why Mike's Nature Trick was just a "clever way to solve a problem" to quote Michael Mann, explaining away this deception as typical 'scientist talk'. No mention that the problem to solve was that the paleoclimate data showed the opposite of what was needed for the "unequivocal evidence" of unprecedented and man-made global warming. If the trees weren't good thermometers after 1960, then why were they good thermometers at any other point in the reconstruction? The IPCC AR4 continues on in this fine tradition, not allowing anyone to look at their graphs without the trick applied.
Saturday, February 20, 2010
Global Sea Level Decrease 2004-2010 Part 2
UPDATED - Click Read More below


I have incorporated reader suggestions and citations in the literature from the prior post on the linear trend of 6 years of ARGO global dynamic height data 1/31/2004 - 1/31/2010 to produce the graph above:
1. I have used a more accurate program to digitize the graph output (below) by the Pacific Marine Atlas (which only provides graphs, not datapoints)
2. I have used dynamic height from 1750 dbar depth relative to the surface (0 dbar), as used in this paper which compares ARGO dynamic height to satellite altimetry sea surface height measurements. Note: ARGO dynamic height (DH) and Satellite Altimetric Sea Surface Height (SSH) are measurements related to "sea levels" but can have divergences.
3. The linear least squares regression equation is included and shows more of a downtrend in dynamic height (-.83mm/yr or -8.3cm/century) vs. the 0/100 dbar graph in the original post.
4. The R² of the linear regression is incorporated in the graph and is indeed low, as one would expect when trying to detect a tiny linear trend in data containing huge & chaotic seasonal and ocean oscillation components. I presume the confidence limits may be tightened by massaging out the semi-sinusoidal seasonal component by fitting a sinusoidal least-squares regression to the data, removing that component, and then doing a linear least squares fit. If anyone is so inclined to do this or would like to do your own statistical analysis, here is the spreadsheet of the digitized graph values.
Original graph output by the Pacific Marine Atlas:

Sea Level Expert: "Sea is not Rising"

Dr. Nils-Axel Mörner is the head of the Paleogeophysics and Geodynamics department at Stockholm University in Sweden. He is past president (1999-2003) of the INQUA Commission on Sea Level Changes and Coastal Evolution, leader of the Maldives Sea Level Project. Dr. Mörner been studying the sea level and its effects on coastal areas for some 35 years.
And a second interview with Dr. Mörner Claim that Sea Level is Rising is a Total Fraud
IPCC Ocean-gate anyone?
"Another way of looking at what is going on is the tide gauge. Tide gauging is very complicated, because it gives different answers for wherever you are in the world. We have to rely on geology when we interpret it. So, for example, ...the IPCC chooseHong Kong , which has six tide gauges, and choose the record of one, which gives a 2.3 mm per year of sea level. Every geologist knows that that is a subsiding area. It’s the compaction of sediment; it is the only record which should not [be used]. And if that [2.3 mm] figure is correct, thenwould not be subsiding, it would be uplifting. And that is just ridiculous. Not even ignorance could be responsible for a thing like that. So tide gauges, you have to treat very, very carefully." Holland
Now, back to satellite altimetry. From 1992 to 2002, [the graph of the sea level] was a straight line, variability along a straight line, but absolutely no trend whatsoever. We could see those spikes: a very rapid rise, but then in half a year, they fall back again. But absolutely no trend, and to have a sea-level rise, you need a trend.
Then, in 2003, the same data set, which in [the IPCC's] publications, in their website, was a straight line—suddenly it changed, and showed a very strong line of uplift, 2.3 mm per year, the same as from the tide gauge. And that didn't look so nice. It looked as though they had recorded something; but they hadn't recorded anything. It was the original one which they had suddenly twisted up, because they entered a "correction factor," which they took from the tide gauge. So it was not a measured thing, but a figure introduced from outside. I accused them of this at the Academy of Sciences in Moscow —I said you have introduced factors from outside; it's not a measurement. It looks like it is measured from the satellite, but you don't say what really happened. And they answered, that we had to do it, because otherwise we would not have gotten any trend!
IPCC Ocean-gate anyone?
Related news today: Climate scientists withdraw journal claims of rising sea levels
Friday, February 19, 2010
Satellite Altimetry: Rate of Sea Level Rise Slows to 1.5mm/yr (less than half of former)
Expanding on prior posts on sea levels, the rate of sea level rise as measured by satellite altimetry has fallen from 3.2mm/year over the entire satellite records (note 2 different satellites at different times) to a rate of 1.5mm/yr since 2005:


Polynomial fit to the entire satellite record shows slowing of the rate of sea level change, as might be expected from a slowing or reversal of global warming:

Cautionary Notes: "Sea Level" is not exactly the same as "Satellite Altimetry Level" or "Dynamic Height" and there can be divergences between them. The title of the second graph should read TOPEX & JASON since the first half of the record to 2002 was from TOPEX
Assuming the satellite altimetric sea height current rate of 1.5mm/yr, the change per century is 15cm/century. Compare to the constantly ratcheted-down upper estimates of the IPCC for sea level rise this century from 88cm/century down to currently (in AR4) 59cm/century (a 4-fold difference).
UPDATE: MUST READ - the interview with Dr. Nils-Axel Mörner on the post immediately above which explains that the satellite altimetry records have been adjusted upward to match the faulty tide gauge records - which are rife with errors not appropriately correcting for subsiding, tectonic shifts, etc. HERE WE GO AGAIN!
Thursday, February 18, 2010
The AGW Smoking Gun(s)
The only rebuttal given by AGW proponents is that the scandals of the IPCC don't negate the science (i.e., unscrupulous behavior by a few don't negate the rock-solid science), so it seems that the only way to disprove the AGW hypothesis is to address problems with the science. Climate science is very complex, and AGW proponents dismiss the scientific arguments unless the data are contained in journal papers that are "peer-reviewed." Read more
Another smoking gun: The Missing Hotspot
Also out today, an article on the solar/cosmic ray/cloud connection, subject of a recent hockey schtick post:
"We’ve known for a long time about a high correlation between sunspot activity and global temperature. However, a high correlation does not mean or prove cause and effect; a mechanism is required. Early IPCC reports correctly used lack of a mechanism as the reason for excluding the subject. There was no mechanism, at least with solid scientific support, for the first two IPCC Reports. A mechanism, now known as the Cosmic Theory, was well developed when the Third Assessment Report (TAR) in 2001 was released and better documented by the Fourth Assessment Report (FAR). Although discussed briefly in TAR it was essentially ignored in FAR.Sunspots and Cosmic Radiation
...reliable sunspot records only appear after Galileo used his telescope on the Sun in 1610.Considerable research on sunspots identified various cycles including the 11-year Schwabe cycle and the 22-year Hale cycle. The most notable event was the period from 1645 to 1710 named the Maunder Minimum by John Eddy after the solar scientist E. Walter Maunder. Eddy’s Scientific American article “The Case of the Missing Sunspots” brought the issue to the wider public in 1977. People like Hubert Lamb, founder of the Climatic Research Unit (CRU), associated this period of few sunspots with the cold period known as the Little Ice Age (LIA) centered at the end of the 17th century.
And a Newsweek Article: Iceberg Ahead: Climate scientists who play fast and loose with the facts are imperiling not just their profession but the planet.Christensen and Lassen, published a 1991 paper in Science titled, “Length of the Solar Cycle: An Indicator of Solar Activity Closely Associated with Climate.” Work progressed with the involvement of Henrik Svensmark, and a joint publication with Christensen in 1997 titled “Variation of Cosmic ray Flux and Global Cloud Coverage - a Missing Link in Solar-Climate Relationships.” Subsequent articles appeared in 1998, 2000 and 2003 long before the IPCC deadline for the 2007 Report. Svensmark and Calder detail the history of the idea in their book, “The Chilling Stars”. Read more
Also Recommended: The Heretics: McIntyre and McKitrick
ARGO Warm Water Volume 2004-2010
Chart created by the Pacific Marine Atlas program of ARGO "warm water volume":

Digitization of graph for trendline analysis shows slight uptrend 2004-2010 and coincides with El Nino events:

Wednesday, February 17, 2010
ARGO Global Ocean Salinity v. Time
See description of ARGO in the 2 prior posts. Using the Pacific Marine Atlas program to plot average salinity for the entire network from 0-1900m depth shows an increasing trend in salinity over the past 6 years. Note when sea ice & glaciers melt, salinity decreases. From the ARGO website:
Regionally, the ocean becomes fresher or saltier where the balance between evaporation minus rainfall tips in one direction or the other over time. As an integrating measurement made with high accuracy, freshwater content (salinity anomaly over a layer) is the most sensitive yardstick available for observing the global fingerprint of a changing hydrological cycle. A second application of salinity is to diagnose the global volume of ice. Melting of either floating ice or glaciers and ice sheets lowers ocean salinity.


ARGO Global Sea Temperatures 0-1900m
From the ARGO network (see last post) Pacific Marine Atlas program, a plot of global sea temperature 0 to 1900m depth for the past six years:

Digitization of this graph for trendline analysis shows a very slight increase in temperature of 0.03°C per decade:

Note Satellite Records of ocean temperature only measure at the sea surface whereas the ARGO measurements extend from the surface to 1900m depth.
Global Sea Level Decrease 2004-2010
The full 6 year dataset from January 31, 2004 to January 31, 2010 of the ARGO global network of 3198 free drifting ocean floats with GPS is now available (data first became available from this program in 2004-see float locations here and shown below). Using the Pacific Marine Atlas program to plot data from the entire network shows a slight downtrend in Sea Height over the past six years (January 31, 2004 - January 31, 2010) using data from the entire network:


The graph from the Pacific Marine Atlas was digitized using the VistaMetrix program to extract data for purposes of determining a linear trendline. The trendline shows the rate of global sea level decrease to be -.1mm/year or-10mm/century. The original graph from the Pacific Marine Atlas is shown below:

UPDATE:
1. Comments concerning the relationship between ARGO Dynamic Height (DH) and Satellite Altimetric Sea Surface Height (SSH) are addressed in this paper and here is a graph from the paper showing the close agreement between the two related measurements:

A trend found in ARGO DH data is likely to be reflected in sea levels. Also see the Rebert paper on the relationship of dynamic height and sea levels.
2. Comments regarding quality control of the data used in Pacific Marine Atlas program are addressed in this paper, which notes that the ARGO data undergoes extensive realtime and delayed quality checks prior to release for use in the Pacific Marine Atlas program.
UPDATE "Global Sea Level Decrease 2004-2010 Part 2"
UPDATE "Global Sea Level Decrease 2004-2010 Part 2"
Climate-Research Controversies Create Opening for Critics
From the Wall Street Journal (2/16/10):
"Among the most vocal of the cadre of scientists who have questioned some of the IPCC's recent work is John R. Christy, director of the Earth System Science Center at the University of Alabama-Huntsville and a former contributor to a big 2001 IPCC report. He, like several other of the critics, was repeatedly criticized in the hacked emails.
Dr. Christy spent years comparing temperature data from satellites with ground stations. He concluded that the reliance on a few well-known ground-based measuring stations may vastly overstate how much temperatures have risen. He suggests that surface temperatures are actually measuring an increase in human development—more and bigger cities, more asphalt, more air-conditioning—and not rising temperatures in the atmosphere. Most climate scientists, by contrast, ascribe rising temperatures largely to man's introduction of greenhouse gases into the atmosphere.
Some dissenters have focused on the complex effect of clouds. Richard Lindzen, a professor of meteorology at the Massachusetts Institute of Technology and a past contributor to an IPCC report, says that the role of clouds and water vapor—the main greenhouse agents in the atmosphere—is one of the least understood factors in climate science. It's a limitation that the IPCC acknowledges.
Prof. Lindzen says the key issue is "climate sensitivity"—how much will temperatures rise when carbon-dioxide levels double. He asserts that current climate models include a "positive feedback" effect whereby clouds and water vapor act to amplify CO2's greenhouse effect. In response to a doubling of carbon-dioxide levels, the IPCC has found climate sensitivity to be between 1.5 degrees and five degrees Fahrenheit. Prof. Lindzen says those figures, derived from models, overstate the case.
Prof. Lindzen recently published a study based on radiation measurements taken from satellites—not models—and concluded that climate sensitivity as a result of clouds and water vapor was more likely in the 0.3 degrees to 1.2 degrees range, much lower than the figure accepted by most climate researchers. "The observational analysis implies that the models are exaggerating climate sensitivity," he concludes in a second, yet-to-be published paper on the same subject.
Dr. Willie Soon, a professor at Harvard University, believes that changing levels of solar radiation, especially the amount that hits the Arctic, are driving huge, slow changes in the earth's climate—much as they did in past centuries. The theory rests on the fact that the sun emits different amounts of energy at different times."
Tuesday, February 16, 2010
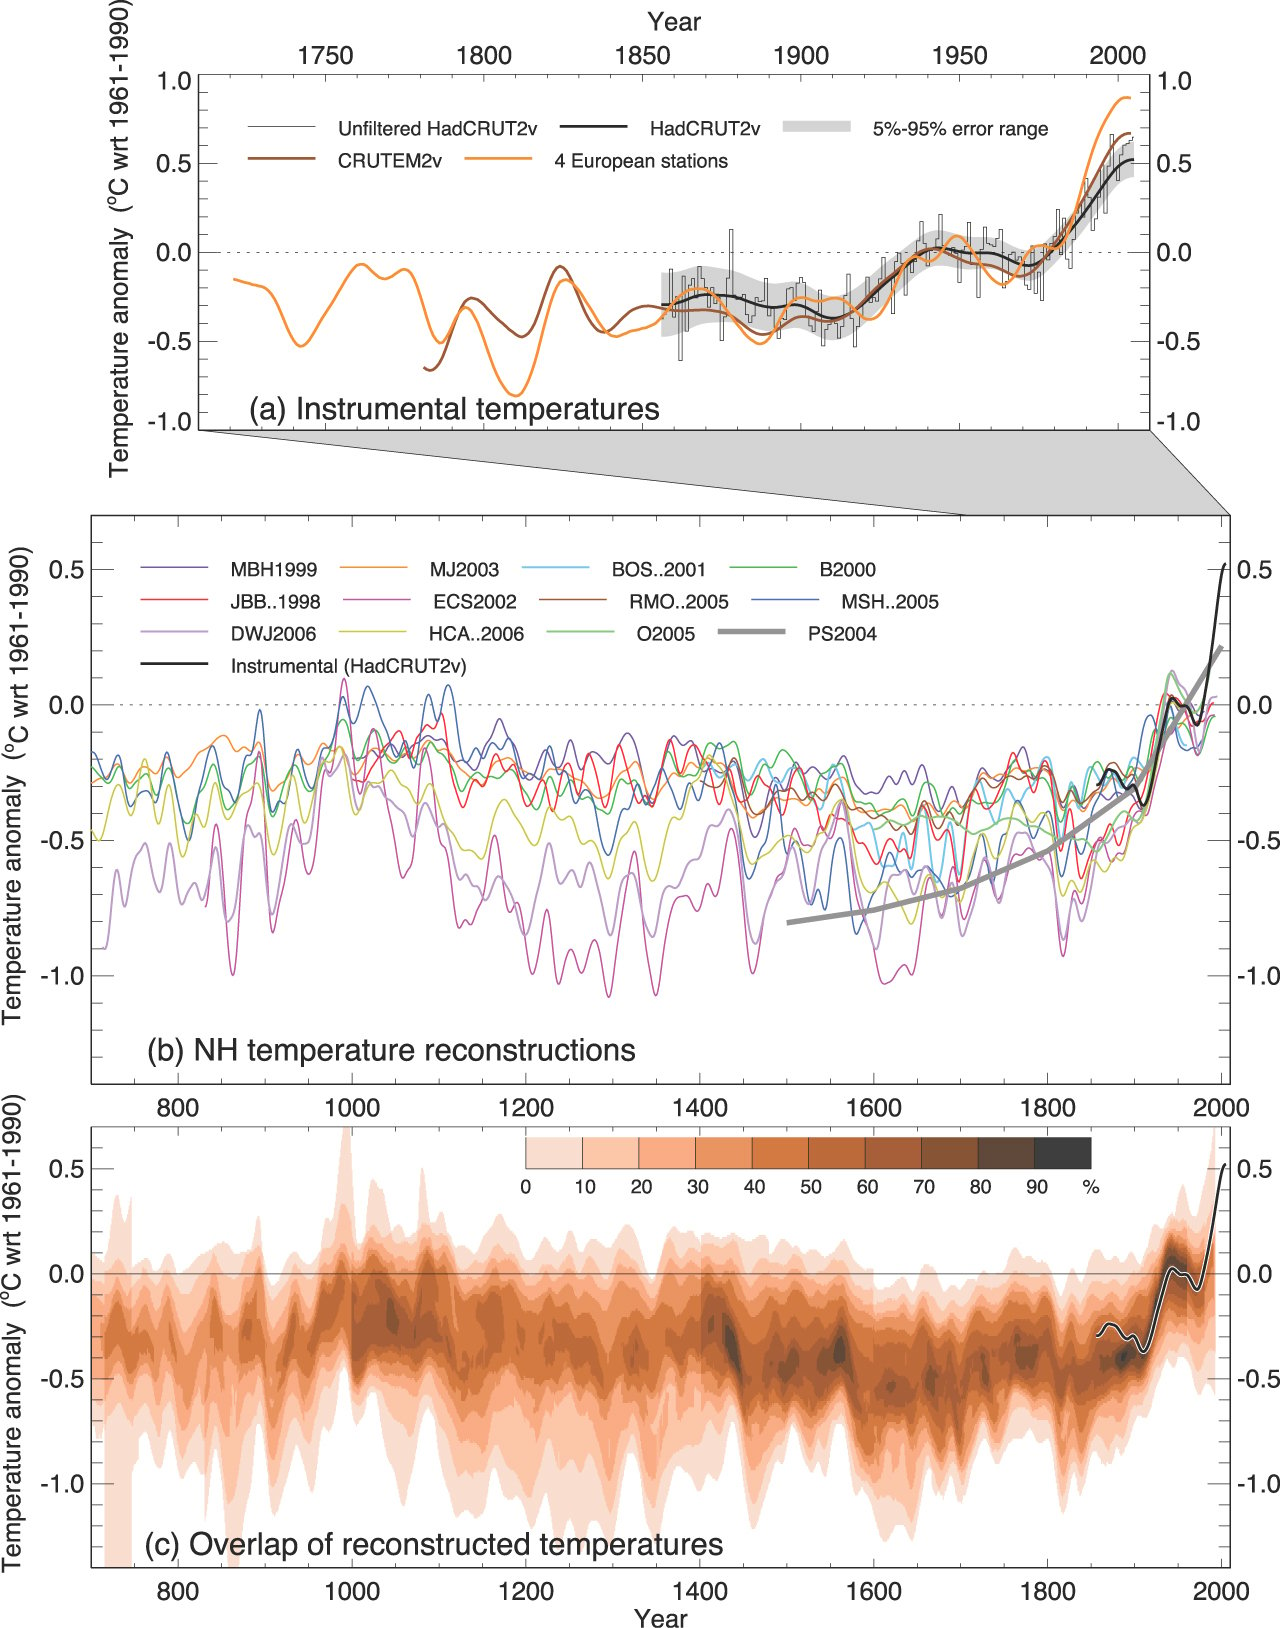
IPCC Paleoclimate Reconstructions show no significant warming
Graphs from IPCC AR4 showing "overwhelming evidence" of unprecedented & anthropogenic global warming:
1. Northern Hemisphere Paleoclimate Reconstructions:

1. Northern Hemisphere Paleoclimate Reconstructions:
Comments: Once again, "Mike's Nature Trick" is used to graft the faulty instrumental record onto the paleoclimate reconstructions for scientifically-improper dramatic effect. In addition, the orange line with the highest anomaly in the top (instrumental only) graph is from a Phil Jones paper on the instrumental record of 4 mostly urban European sites: Central England, De Bilt, Berlin and Uppsala without any mention in the AR4 text of possible urban heat effects. Now back to the paleoclimate reconstructions alone, it appears that:
- the error bars include the instrumental plus the paleoclimate data (should only be the latter)
- the paleoclimate data shows the Medieval Warming Period to have statistically insignificant temperature anomaly compared to the 20th century and indeed no statistically significant warming over essentially the entire reconstruction
- periods of warming at similar rates to the late 20th century instrumental record including the oft cited periods and a "new" one: years 900-1000
- the paleoclimate data peaks in 1950-1960 and then declines at just the time the anthropogenic signal due to man-made greenhouse gases should be exponentially increasing
- 3 of the tree-ring data series were truncated in 1960 to "hide the decline" despite availability of data beyond 1960
2. Southern Hemisphere Paleoclimate Reconstructions:
- "Mike's Nature trick" of improperly grafting the instrumental data from each region to the paleoclimate data is again employed
- Of the 4 tree ring reconstructions, only 1 suggests higher temperatures in the 20th century (S Patagonia) and that record also takes a downward dive after ~1960
- Three of the four tree-ring reconstructions show the same or significantly higher temperature anomalies before industrialization
Monday, February 15, 2010
Cosmic Rays v. Inverse Solar Magnetic Activity

Related to the prior post Cosmic Rays 'Off the Chart', plotting the monthly neutron cosmic ray counts from the Oulu Finland monitoring station v. the "inverse" solar magnetic activity (30-smoothed Ap Index) shows close linear agreement (R² =.99). Indeed, the current quiestest & longest solar minimum in modern history is accompanied by an increase in cosmic ray counts to the highest in recorded history. An increase in cosmic rays increases cloud nucleation and hence cooling due to reflection of the sun's rays (albedo)(Svensmark & others). Here is evidence that small changes in solar activity of only typically 0.1% TSI from peak to trough of solar cycles can be amplified by the effect of cosmic rays on secondary albedo. Cloud cover also appears to be linearly related to cosmic rays, and global cloud cover is in turn linearly inversely related to global temperature. Note that during the last solar minimum in 1998, cosmic ray counts hit a maximum of 6579, but during the current "record" solar minimum, cosmic ray counts hit a maximum of 6843 in December 2009 (4% higher). The TSI bottomed at 1365.4 between solar cycle 22 & 23 and at 1365.2 between 23 & 24, only a 0.01% decrease, yet an amplified 4% increase in cosmic ray flux resulted, potentially resulting in a ~4% decrease in temperature assuming the linear relationships noted above (interesting that there has been around a 3% global cooling since the peak of cycle 23).
The IPCC AR4 model of radiative forcing from solar irradiation does not take into account the "Svensmark factor", which theorizes that small changes in solar activity are amplified due to the secondary effects on cosmic rays & cloud cover. The IPCC model assigns what appears to many to be an absurdly low value (only 7% of the positive forcing "arbitrarily" assigned to CO2) to radiative forcing from solar irradiation without consideration of these potentially amplified secondary effects.
The IPCC AR4 model of radiative forcing from solar irradiation does not take into account the "Svensmark factor", which theorizes that small changes in solar activity are amplified due to the secondary effects on cosmic rays & cloud cover. The IPCC model assigns what appears to many to be an absurdly low value (only 7% of the positive forcing "arbitrarily" assigned to CO2) to radiative forcing from solar irradiation without consideration of these potentially amplified secondary effects.
Scandinavia-gate & Czech-gate
From Hide The Decline: More evidence that IPCC's claim of global warming in the Scandinavian region is yet another home-made "fact" courtesy of the IPCC.
 From Climategate.com & blogger 'Chiefio':

New Trend: Reports on the Benefits of Global Warming
Climate Change Will Lead to Fewer Traffic Accidents
ScienceDaily (Feb. 15, 2010) — Climate change will lead to fewer traffic accidents in West Midlands, UK. Research from the University of Gothenburg estimates climate change to decrease the number of days with temperatures below zero degrees in West Midlands. It will also reduce the number of traffic accidents -- and the need for winter road maintenance may decrease by almost 40 percent.
In other news:

ScienceDaily (Feb. 15, 2010) — Climate change will lead to fewer traffic accidents in West Midlands, UK. Research from the University of Gothenburg estimates climate change to decrease the number of days with temperatures below zero degrees in West Midlands. It will also reduce the number of traffic accidents -- and the need for winter road maintenance may decrease by almost 40 percent.
Diversity of Corals, Algae in Warm Indian Ocean Suggests Resilience to Future Global Warming
In other news:
- The Continuing Climate Meltdown (Wall Street Journal)
- Climategate 2.0 — The NASA Files: U.S. Climate Science as Corrupt as CRU
- Another IPCC Error: Antarctic Sea Ice Increase Underestimated by 50%
- 2009- Global Warming Causes Foggy Days in San Francisco… 2010- Global Warming Causes Fog-less Days in San Francisco
- Consensus or Con? The global warmists are the real deniers.
- Dear Al Gore: Please Send Us Some More of That “Global Warming”
- Climategate: A Defiance of Arrogant Political Power (Professor Ian Plimer)
- Science blogger finds errors in Met Office climate change records
- Why the EPA is Wrong about Recent Warming
- Now IPCC hurricane data is questioned
- The red-hot scam unravels (Washington Times)
- Al Gore's Blog: the climate crisis is worse than we thought
- Climate change causes an increase and a decrease in San Francisco fog
- Why Hasn't Earth Warmed as Much as Expected?
- 'Warming' meltdown - Climate 'consensus' cracks up
- Scientist at center of Climategate scandal acknowledges climate change science problems
- Corrections Page:

Sunday, February 14, 2010
The Longest & Quietest Solar Magnetic Minimum over the past 8 Solar Cycles

The Ap Index of Solar Geomagnetic Activity continues at historic lows in the low single digits, and can lag the month of solar cycle minimums by up to 1 year. Total Solar Irradiance (TSI) and sunspot activity appears to have bottomed in August 2009, but Ap Index bottoming could lag up to one year based on prior cycles.
Adapted from: Climate Warnings from the Sun
As of the end of January, the cumulative number of spotless days (days without sunspots) in the transition into solar cycle 24 now stands at 774. The number of spotless days is clamping down quickly. There were only 3 spotless days in January, 2010.Solar minimums end rather abruptly. It appears very likely that the final number for this solar minimum will come close to 800. The transitions into the recent Solar Cycles (SC16-23) covering the past 7 decades averaged 362 cumulative spotless days. Therefore it is becoming obvious that the sun has undergone a state change.
The Average Magnetic Planetary Index (Ap index) is a proxy measurement for the intensity of solar magnetic activity as it alters the geomagnetic field on Earth. It has been referred to as the common yardstick for solar magnetic activity. An Ap index of “4″ was the lowest recorded monthly value since measurements began in January 1932. In October and November 2009, this index record was broken with values of “3″. Then in December the index sunk even lower establishing a new record with a reading of “2”. Now in January of this year the Ap index is back up to “3”.
This solar minimum is rather unusual. If we define a period of quiet sun as those months that produced an Ap index of 6 or less and compare the total number of quiet months within each solar minimum, then the results would be:
Number of Months with Ap Index of <7 Preceding Solar Cycles:
SC17 11 months (cycle maximum in 1938)
SC18 2 months
SC19 2 months
SC20 5 months
SC21 0 months
SC22 0 months
SC23 3 months (occurring 1997-1998)
SC24 25 months and counting
Isn’t it interesting that the Northern Hemisphere is experiencing some of the coldest, snowiest weather in decades at the same time the sun’s magnetic field produced 25 quiet months? But history has shown that when the sun gets extremely quiet such as during the Maunder and Sporer Minimums, the world experiences great cold periods referred to as the Little Ice Ages. Global temperature changes typically lag reduced solar activity due to moderating effects of heat storage in the oceans.
Related: Sun is undergoing a state change
Presentation: Sun is driver of Global Warming. AGW evidence is "spurious"

This slide presentation of the paper posted below finds that the first and second order partial derivatives of temperature and CO2 only show correlation over short time periods, whereas temperature and solar irradiation first and second order partial derivatives are well correlated over long periods, concluding that the sun is the driver of global warming and evidence of anthropogenic global warming is "spurious."
Paper: "Sea level can rise as much as 2 meters over the course of a century" during last ice age
From Science News: Cave research finds new evidence of surprising rise 81,000 years ago [when CO2 was lower]
The mineral crusts on high-and-dry formations in coastal caves of Majorca indicate that during the latest ice age, sea level briefly and inexplicably rose more than one meter higher than today’s level. Cave formations along the coast of an island in the Mediterranean Sea hold evidence that sea level can rise and fall abruptly during an ice age, a finding that casts some doubt on current notions about how those lengthy cold spells develop and progress.
Paper: AGW Rejected. Solar Irradiance Changes responsible for 74% of Global Warming 1880-2000

From the [pre-publication] paper, solar irradiance contributed 0.40 (74%) of the 0.54°C warming from 1880-2000, and CO2 contributed .09°C (17%) (and note man-made CO2 emissions only constitute 3-4% of the atmospheric CO2- therefore the man-made CO2 contribution to temperature would be 0.0036°C):
Contributions to Global Warming in the 20th Century
1940-2000 1880-2000
Solar irradiance 0.17 0.40
rfCO2 0.20 0.09
rfCH4 0.11 0.03
rfN2O 0.002 0.03
Total 0.48 0.54
Change in temperature 0.43 0.54

Related: IPCC's Most Essential Model Errors
1940-2000 1880-2000
Solar irradiance 0.17 0.40
rfCO2 0.20 0.09
rfCH4 0.11 0.03
rfN2O 0.002 0.03
Total 0.48 0.54
Change in temperature 0.43 0.54
Contrast to the IPCC AR4 models which assume that CO2 accounts for 97% of positive forcing of climate change and that solar irradiance positive forcing is a mere 7% of that of CO2:

Subscribe to:
Posts (Atom)