From the Oulu, Finland Neutron Monitoring Station, cosmic ray counts are "off the chart" at the highest levels measured since the data was first recorded in 1964. Cosmic ray counts are inversely related to solar activity, as the solar wind and magnetic field deflect galactic cosmic rays. Cosmic rays have been related to cloud formation, which reflect rays from the sun and therefore lead to cooling of the earth. Note the high counts present during the 70's cooling period. Do the "record" recent high counts of cosmic rays presage global cooling?
Data thru 1/1/10
Chart from the landmark Svensmark paper inversely relating cosmic ray neutron counts to sunspots (which are in turn directly correlated to solar activity):
and see the most recent paper by Svensmark.
and a plot of cosmic rays vs. cloud cover:

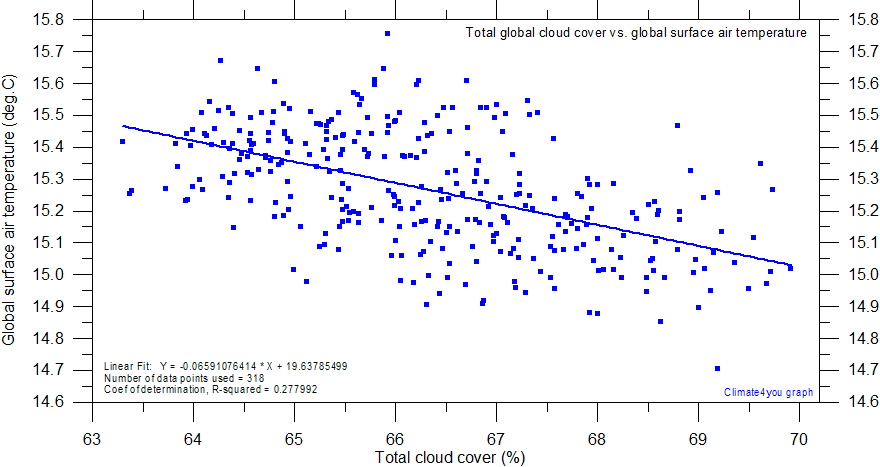
and this chart of global cloud cover v. temperature:
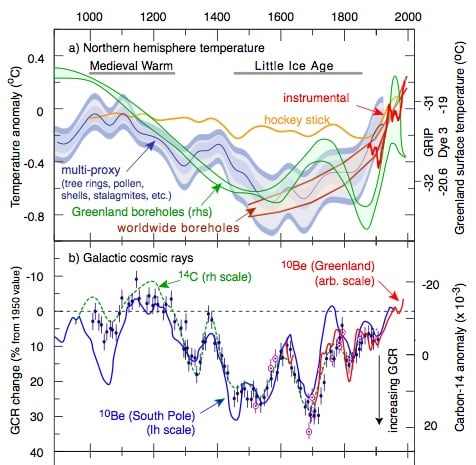
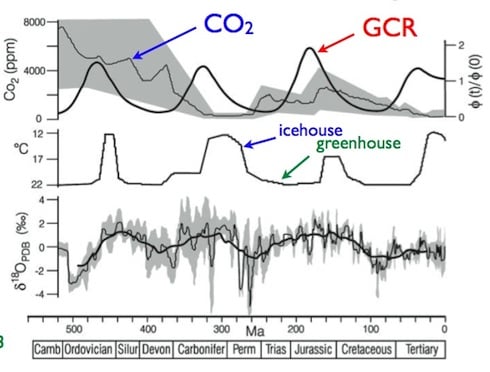
The cosmic ray effect - a factor of the background CBR [cosmic background radiation] bombardment itself, and the relative strength of the earth and the Sun's magnetic shields - shows a strong correlation between temperature [and] CBR and is extraordinary. Here's the relationship over the short term - around 2,000 years.


from here.
Note the correlation between cosmic rays and cloud cover:

Soon (2007) showed how the total solar irradiance correlated with arctic temperatures very well, far better than with carbon dioxide.

Sunspots during the active phase (left) are very different from the minimum (right) as shown by Penn and Livingston. Most of the spots in the last two years have been microdots like that on the right. The most recent sunspot group in mid to late October was more traditional.
Another index of solar activity, the PMOD Composite Total Solar Irradiance (TSI), also reflects "record" low solar activity at present (data available starting in 1979):
also see here for NASA data showing cosmic ray fluxes are at a "space age high."
Another graph of the relation between cosmic rays and low cloud cover:
and see http://landshape.org/enm/cosmic-ray-flux-and-the-ipcc/
Note the correlation between cosmic rays and cloud cover:
Scaffetta and West (2007) using Total Solar irradiance as a proxy for the total solar effect suggested the sun may account for 69% of the changes since 1900.

Soon (2007) showed how the total solar irradiance correlated with arctic temperatures very well, far better than with carbon dioxide.

Sunspots during the active phase (left) are very different from the minimum (right) as shown by Penn and Livingston. Most of the spots in the last two years have been microdots like that on the right. The most recent sunspot group in mid to late October was more traditional.
Another index of solar activity, the PMOD Composite Total Solar Irradiance (TSI), also reflects "record" low solar activity at present (data available starting in 1979):
also see here for NASA data showing cosmic ray fluxes are at a "space age high."
Another graph of the relation between cosmic rays and low cloud cover:
and see http://landshape.org/enm/cosmic-ray-flux-and-the-ipcc/


Earth a big cloud chamber, counting cosmic rays
ReplyDelete