Tuesday, May 15, 2012

New paper finds 'significant and robust' influence of solar activity on tropical climate

A paper published today in the Journal of Atmospheric and Solar-Terrestrial Physics finds that the Madden–Julian Oscillation (MJO),  the largest element of the intraseasonal (30–90 days) variability in the tropical atmosphere, has "a clear solar signature" that is "shown to be both statistically significant and robust."


The paper adds to hundreds of other peer-reviewed publications showing significant solar influences on climate, despite the intent of the IPCC to dismiss the importance of the Sun.


A correlation of mean period of MJO indices and 11-yr solar variation

  • Elena Blantera, b, Corresponding author contact information, E-mail the corresponding author, 
  • Jean-Louis Le Mouëla, 
  • Mikhail Shnirmana, b, 
  • Vincent Courtillota
  • a Geomagnetism and Paleomagnetism, Institut de Physique du Globe de Paris, 1 rue Jussieu, Paris, France
  • b Institution of Russian Academy of Sciences – Institute of Earthquake Prediction Theory and Mathematical Geophysics, Profsoyuznaya str. 84/32, Moscow 117997, Russia

Abstract

This paper focuses on the decadal to multi-decadal evolution of the spectral properties of the Madden–Julian Oscillation (MJO). Guided by former studies, we test whether the ∼11-yr (Schwabe) cycle of solar activity could be reflected in the spectral features of MJO indices: namely, we study the evolution of MJO mean period within different period ranges and compare these with the evolution of solar activity. We focus on solar proxies best linked to UV emission and cosmic rays: sunspot number WN, F10.7 flux, core-to-wing ratio MgII, and galactic cosmic rays (GCR). A clear solar signature in MJO spectral properties is indeed found and shown to be both statistically significant and robust. UV proxies are found to be better correlated with MJO mean period than GCR, thus supporting rather the ozone mechanism of solar impact on MJO. The overall correlation with solar activity is found to be stronger in the Indian Ocean. Long periods (e.g. 50–80 day) are better correlated with solar activity than shorter periods (e.g. 30–60 day). A marked change in the relationship between MJO mean period and solar activity takes place in the declining phase of solar cycle 23, adding to its unusual character
.

New paper finds solar activity and natural climate cycles explain rainfall variations over past 160 years

A paper published today in the Journal of Atmospheric and Solar-Terrestrial Physics finds that sunspot numbers and the assumption of natural climate cycles "accurately reproduces" the patterns of rainfall in Fortaleza, Brasil "over the  entire 160 years of observations."

Possible evidence of the resonant influence of solar forcing on the climate system

  • A.A. Guseva, Corresponding author contact information, E-mail the corresponding author, 
  • I.M. Martinb
  • a IKI RAS, 84/32 Profsoyuznaya Str, 117997 Moscow, Russia
  • b UNITAU, 432 rua 04 de Março, 12020-270 Taubate, SP, Brazil

Abstract

An assumption of the existence of natural climatic oscillations driven by solar activity enables an explanation of phase differences between variations in solar activity and rainfall level in Fortaleza, Brazil. Decadal and interdecadal variations in rainfall level can be reproduced using a forced oscillation equation with a driving force term that describes the variation in the sunspot number and with the assumption of the existence of 31.7-year interdecadal and 12.96-year decadal natural climatic oscillations. This equation satisfactorily reproduces the periodicity with a length of approximately 22 yr in the interdecadal rainfall variation before and up to the middle of the past century as well as the subsequent phase inversion, period and amplitude increase in the variation that followed the corresponding increases in the interdecadal sunspot number variation. The equation accurately reproduces the irregular phase shifts between decadal variations in rainfall level and in sunspot number over the entire 160 yr of recorded observations.

Highlights

► The long-term SSN [sunspot number] and rainfall variations were bound through a casual mathematical equation. ► Simultaneous presence of both external forcing and natural oscillations is a necessary condition. ► The yearly rainfall data for Fortaleza (Brazil) from 1849 up to 2010 were used for the analysis. ► Phase inversion in the interdecadal rainfall component is due to a period increase in SSN after 1950. ► Irregular phase shift in the decadal rainfall component is due to anharmonic character of SSN.

New paper finds climate computer models exaggerate global warming and don't reproduce Pacific Ocean oscillations

A paper published today in Geophysical Research Letters finds "Most [climate] models overestimate trends, whereby the models predict less warming or even cooling in the earlier decades compared to observations and too much warming in recent decades." Furthermore, the paper finds that the most influential ocean oscillation on the planet, the Pacific Decadal Oscillation (PDO), is poorly reproduced by climate models.

Note: A very simple climate model incorporating just the ocean oscillations PDO & AMO and the "sunspot integral" reproduces global temperatures with near perfect accuracy (R²=.96).

GEOPHYSICAL RESEARCH LETTERS, VOL. 39, L10701, 7 PP., 2012
doi:10.1029/2012GL051644
Key Points
  • CMIP5 models overestimate trend for global mean surface temperature
  • The multi-model ensemble mean has better-forecast quality than single-model
  • The Atlantic Multi-decadal Oscillation index is well predicted in all models
Hye-Mi Kim
School of Earth and Atmospheric Science, Georgia Institute of Technology, Atlanta, Georgia, USA
Peter J. Webster
School of Earth and Atmospheric Science, Georgia Institute of Technology, Atlanta, Georgia, USA
Judith A. Curry
School of Earth and Atmospheric Science, Georgia Institute of Technology, Atlanta, Georgia, USA
This study assesses the CMIP5 decadal hindcast/forecast simulations of seven state-of-the-art ocean-atmosphere coupled models. Each decadal prediction consists of simulations over a 10 year period each of which are initialized every five years from climate states of 1960/1961 to 2005/2006. Most of the models overestimate trends, whereby the models predict less warming or even cooling in the earlier decades compared to observations and too much warming in recent decades. All models show high prediction skill for surface temperature over the Indian, North Atlantic and western Pacific Oceans where the externally forced component and low-frequency climate variability is dominant. However, low prediction skill is found over the equatorial and North Pacific Ocean. The Atlantic Multidecadal Oscillation (AMO) index is predicted in most of the models with significant skill, while the Pacific Decadal Oscillation (PDO) index shows relatively low predictive skill. The multi-model ensemble has in general better-forecast quality than the single-model systems for global mean surface temperature, AMO and PDO.

Hansen gets slammed on his 'extreme weather' alarmism

More on Extreme Weather and the Greenhouse Effect   NYT.com

Martin P. Hoerling, a federal research meteorologist specializing in climate dynamics, has written the following expansion and defense of his criticism of some assertions made in an Op-Ed article on climate change by James E. Hansen of NASA. His initial criticism was posted on the Dot Earth blog.   

Several scientific conclusions and claims were expressed in the NYT Op-Ed piece by J. Hansenwith which I raised concerns and objections on a scientific basis.   While allowing for imprecision in how nuanced climate change science is sometimes communicated in such venues, there were nonetheless statements in the Hansen NYT piece that drew my attention because they stood contrary to peer-reviewed literature.  Some of these claims could also be tested and/or falsified by simple tests using data available in the public domain, with examples given below.

The Hansen NYT piece asserts:  

"Over the next several decades, the Western United States and the semi-arid region from North Dakota to Texas will develop semi-permanent drought, with rain, when it does come, occurring in extreme events with heavy flooding. Economic losses would be incalculable. More and more of the Midwest would be a dust bowl. California’s Central Valley could no longer be irrigated. Food prices would rise to unprecedented levels."

To which I replied:  

“I am unaware of any projection for "semi-permanent" drought in this time frame over the expansive region of the Central Great Plains.  He implies the drought is to be a phenomena due to lack of rain (except for the brief, and ineffective downpours).  I am unaware of indications, from model projections, for a material decline in mean rainfall. “

Supporting Material for My Statement  

The peer-reviewed study by Milly et al. titled “Global Pattern of Trends in Streamflow and Water Availability in a Changing Climate”(Nature, 2005) used the IPCC CMIP3simulations to diagnose the relative change in surface runoff for the period 2040-2060 compared to 1900-1970.  A version of their published Fig. 4 is shown below.  Runoff is a holistic indicator of surface water balance that integrates the effects of changes in mean precipitation and its characteristics, and also changes in temperature via evapotranspiration.  These published results indicate no appreciable change in surface water availability over the semi-arid region from North Dakota to Texas, or for the Midwest as a whole, within this ensemble of  CMIP3 simulations.    The authors point out the various uncertainties in such regional scale projections, not the least of which one must also include the uncertainty in the consequences of changes in land cover and land use.

The recently published report by the U.S. Global Change Research Program titled “Global Climate Change Impacts in the United States”provided a synthesis of the current understanding of probable regional climate change impacts. This synthesis document states, in the section on Water Resources on pg. 45, “Precipitation and runoff are likely to increase in the Northeast and Midwest in winter and spring.” Drawn from such works as the Milly et al. study, this synthesis is clearly quite contrary to the assertion made in the Hansen NYT piece.Regarding flooding that is mentioned in the Hansen piece, it is important not to confuse heavy downpours with hydrologic flooding on a river basin scale, for instance.  The IPCC Special Report on Managing the Risks of Extreme Events and Disasters to Advance Climate Change Adaptation (SREX, 2012http://www.ipcc-wg2.gov/SREX/) states a low confidence for both observed and projected changes in the magnitude and frequency of floods.

Summary  

The claim in the Hansen NYT piece that the Midwest would be a dustbowl in coming decades thus runs contrary to peer reviewed literature and recent assessments by the U.S. Global Research Program that emerged from the synthesis of current understanding by an expert team of scientists.

Regarding observed changes in climate of the Great Plains, I stated: 

“Indeed, that region (Great Plains) has seen a general increase in rainfall over the long term, during most seasons (certainly no material decline).  Also, for the warm season when evaporative loss is especially effective, the climate of the central Great Plains has not become materially warmer (perhaps even cooled) since 1900.  In other words, climate conditions in the growing season of the Central Great Plains are today not materially different from those existing 100 years ago.  This observational fact belies the expectations, from climate simulations, and in truth, our science lacks a good explanation for this discrepancy. “

Supporting Material for My Statement

The lack of a warming trend over the central United States during the past century, sometimes called the U.S. “warming hole”, has been especially noted in the peer-reviewed literature (e.g., Kunkel et al. Journal of Climate, 2006, Knutson et al. Journal of Climate2006).  Particularly striking has been a cooling trend in summertime temperatures at many meteorological observing stations located between the Rocky and Appalachian Mountains over the period 1901-2010 (Fig. 2, top).   This region of summertime cooling has generally coincided with a region of summertime mean precipitation increase (Fig. 2, bottom).  The data is the monthly Global Historical Climate Network data available at http://www.ncdc.noaa.gov/ghcnm/v3.php

To date, these regional patterns are not well understood on physical grounds. This, and other regional examples of climate trends, illustrate the need for a more comprehensive assessment on the causes of regional and seasonal differences in climate trends that considers multiple possible contributing factors, including atmospheric dynamics and coupled ocean-atmosphere processes, land surface and biological processes, atmospheric chemistry and aerosol and human-induced climate change.

Summary  

The certainty language expressed in the Hansen NYT piece about the coming dustbowl fate for the Great Plains region and Midwest is contrary to the low confidence of regional climate change projections for coming decades as documented in USGCRP and IPCC reports.  Not only are various regional patterns of trends that have been observed over the last century poorly understood, but the projections of regional changes in coming decades are highly uncertain.

The Hansen NYT piece asserts:

"The global warming signal is now louder than the noise of random weather..."  

To which I replied:  

“This is patently false.  Take temperature over the U.S. as an example. The variability of daily temperature over the U.S. is much larger than the anthropogenic warming signal at the local, weather time scales. Depending on season and location, the disparity is at least a factor of 5 to 10. I think that a more scientifically justifiable statement, at least for the U.S. and extratropical land areas is that --- Daily weather noise continues to drum out the siren call of climate change on local, weather scales.”

Supporting Material for My Statement  

Weather---as experienced on a daily basis and at any particular location--- is highly variable, but the challenge offered in the Hansen NYT piece is that the noise of such variations are now being drowned out by the global warming signal.   Debating this latter point should not, of course, be confused with opening a debate about the rise in global mean temperatures.  The IPCC (2007) has stated that warming of the climate system is unequivocal.  The unequivocal rise in global average temperature and the attribution that most of this rise is due to the rise in anthropogenic greenhouse gas concentrations, owes to the small natural variability of global mean temperatures compared to the large magnitude of the human-induced warming signal in global averaged temperatures.    In other words, for global mean conditions, the signal is much louder than natural variability of globally averaged temperatures.   The science is clear, we know that the planet has warming over the past century, and we are very confident as to why such warming has (and continues) to occur.

But that appears not to be the point of the NYT piece, as impliedby the subsequent context of Hansen’s statement regarding extreme local weather events. The “random weather” called out in the NYT piece is unlikely meant to refer to the variability in global mean temperature, but rather to the local conditions we regularly encounter in our own backyards and that swing back and forth across a range of conditions.  Thisrange (the random noise, as per Hansen) is in fact not smaller than the global warming signal, as shown from several lines of evidence below.

The recent published peer-reviewed study by Hawkins and Sutton (2012, Geophysical Research Letters) diagnoses the so-called “time of emergence” of climate signals from the noise of random variability at a local level.   Their analysis compares an estimate of a human-induced change in surface air temperature against an estimate of its natural variability for seasonally averaged data.   For a signal-to-noise ratio of two (signal being double the magnitude of the noise), they find that the time of emergence is after 2050 for most mid-latitude regions during cold and warm seasons.  The tropics, where noise of temperature variability is less than in mid-latitudes, the time of emergence is appreciably earlier.

But even that analysis is not quite germane to the Hansen assertion regarding the noise of random weather.   Figure 3 presents an analysis of the intensity of the variability of daily averaged surface temperature across the United States.

The data is daily temperature at Cooperative observing stations, which is available at http://www.ncdc.noaa.gov/oa/climate/research/gdcn/gdcn.html.  The top panel is the intensity of daily temperature variability during 1901-2010, averaged across the 12 calendar months January-December.   On average, daily temperature variability is about 5°C over North Dakota, to as small as 2°C over Florida.  The recent update, by NCDC, of the annual mean global mean warming signal is +0.51°C (for 2011 relative to a 20th Century reference).  It is thus evident that daily surface temperature variability is on order 5 to 10 times greater than the global warming signal (see Fig. 3, bottom).   Consistent with the published work of Hawkins and Sutton, it is obvious that the time of emergence of the global warming signal from this weather noise is far in the future under the assumption of continuing global warming.

Summary

The global warming signal is much smaller than the typical daily variability of surface air temperature over the United States.  Most of the magnitude of daily weather extremes owes its causes to natural internal fluctuations and not to global warming.  A possible exception could be imagined if global warming were also to increase the variability of daily temperatures (and not just increase the mean temperatures), but no compelling evidence to such effects has been shown.   While globally averaged temperatures have risen during the past century, the cause for which is very likely human-induce climate change, the signal of this change is still barely audible among the loud noise of daily, backyard weather fluctuations.

Weather, of course, is more than temperature variability.  While this discussion has involved temperature, weather involves rain, storms, winds, severe convection, clouds among others.   In this regard, it is important to reiterate the statement in IPCC SREX (2012) in their Executive Summary which states that “many weather and climate extremes are the result of natural climate variability”, and that “even if there were no anthropogenic changes in climate, a wide variety of natural and weather extremes would still occur”.

The Hansen NYT piece asserts:

" We can say with high confidence that the recent heat waves in Texas and Russia, and the one in Europe in 2003, which killed tens of thousands, were not natural events — they were caused by human-induced climate change."

To which I replied:

“Published scientific studies on the Russian heat wave indicate this claim to be false.  Our own study on the Texas heat wave and drought, submitted today to Journal of Climate, likewise shows that that event was not caused by human-induced climate change. These are not de novo events, but upon scientific scrutiny,one finds both the Russian and Texas extreme events to be part of the physics of what has driven variability in those regions over the past century.  Not to say that climate change didn’t contribute to the those cases, but their intensity owes to natural, not human, causes.”

Supporting Material for My Statement

The principal conclusion by Dole et al. (2011, Geophysical Research Letters) is that the extreme magnitude of the 2010 Russian heat wave was mainly due to internal dynamical processes (associated with atmospheric blocking), and that it was very unlikely that warming attributable to GHG forcing contributed substantially to the heat wave's magnitude. Rahmstorf and Coumou (2011, PNAS) concluded that a strong warming over western Russia (which they attribute primarily to GHG forcing) multiplied the likelihood of a record heat wave. They estimated an 80% probability that the 2010 July heat records in Moscow would not have occurred without climate warming. Barriopedro et al. (2011, Science), on the other hand, conclude that the magnitude of the 2010 event was so extreme that despite GHG warming, the likelihood of an analog over the same region remains fairly low at this time. This is consistent with estimates in Dole et al., which showed a very low probability of an event of this magnitude in 2010, but a rapidly increasing likelihood of crossing given thresholds in future climate, based on results from CMIP3 model runs.

Toward attempting to reconcile these conclusions, Otto et al (2012, Geophysical Research Letters) conclude that there is no substantial contradiction between studies by Dole et al. and Rahmstorf and Coumou, in that the heat wave “can be both mostly internally generated due to magnitude, and mostly externally-driven in terms of occurrence-probability”. Further discussion on this matter including an extensive list of recent published work on the Russian heat wave is available at http://www.esrl.noaa.gov/psd/csi/events/2010/russianheatwave/index.html

Summary

Analysis of various forced model simulations indicates that human influences did not contribute substantially to the magnitude of the Russian heat wave. Even accounting for a possible stronger warming signal, as suggested by Rahmsdorf and Coumou, these were still appreciably smaller than the peak magnitude of the event (which reached 10°C over Moscow during July).   Barriapedro et al. (2011) conclude that the magnitude of the 2010 event was so extreme that despite an increase in temperatures due to human climate change, the likelihood of an analog over the same region remains fairly low until the second half of the 21st century.   These results are thus consistent also with the Hawkins and Sutton (2012) results regarding the time of emergence of a climate change signal at local scales.

go to Revkins blog for graphics in above piece

New paper finds large increase in sunshine since the 1980's; dwarfs alleged effect of CO2

A paper recently published in the journal Weather finds that global summer average sunshine [solar short-wave radiation that reaches Earth's surface] dimmed during the period 1958-1983 [prompting an ice age scare], but markedly increased from 1985-2010. The increase in summer average sunshine between those two periods is 6 Watts per square meter, which dwarfs the alleged effects of CO2 by more than 5 times. [Alleged CO2 effect from 1958-2010 was calculated using the IPCC formula 5.35*ln(389.78/315) = 1.14 Watts per square meter]. At one measurement site [De Bilt], summer sunshine increased from 1985-2010 by 15 Watts per square meter, more than 23 times the IPCC alleged forcing from CO2 during the same timeframe [5.35*ln(389.78/346.04) = 0.64 Watts per square meter].

The paper states the increase in sunshine reaching the Earth's surface is due to a decrease in aerosols including clouds, which are influenced by both anthropogenic and natural factors, and possibly changes in solar activity.
 
Full paper here

Monday, May 14, 2012

Why the theory of man-made global warming is incorrect


Next week I plan on making a big push to get this information out to many, many people.  This is one of the key topics that is covered in my book.  It is not the only critical topic, but this one by itself is enough to demonstrate in a scientific way that warming as described by The Theory of Global Warming is impossible.  My goal is to present this and related information to a wide audience next week.  Wish me luck.
The Theory of Global Warming can be stated in the simplest form as:
An increase in the Earth’s temperature which is caused by an increase in the atmospheric concentration of CO2.
The science behind the theory is that CO2 molecules in the atmosphere absorb and transmit IR (infra-red) energy in all directions.  Specifically they prevent IR energy in the 14-16 micon wavelength (which widens as the concentration increases) from leaving the Earth and then those same molecules then transmit that energy in all directions, most importantly downward where that energy acts like a heating lamp which will cause the oceans and the land to warm up.
There is even a formula by which they show how much power is in the CO2 warming lamp.
The Inconvenient Skeptic
CO2 Forcing Equation
Where C0 is usually taken to be 300 ppm of CO2 in the atmosphere.  If I used this equation to determine the power of the heat lamp that is taking place today, I get 1.4 W/m2 of IR energy that is being transmitted by the “extra” CO2 in the atmosphere today.  That 1.4 W/m2 is important to keep that number in mind.  If I then translate that forcing into warming (see here for that topic), I find that The Theory of Global Warming predicts a 1.1 °C increase in temperature for a CO2 level of 390 ppm.
Now to show that such warming is absolutely impossible by using proven science.
As any object warms up, it transmits more energy which is described by the Stefan-Boltmann Law which is described as:
The Inconvenient Skeptic
Amount of energy radiated by an object.
One important note here is that the energy radiated increases to the 4th power and it is absolute temperature that matters here and not relative temperature change or anomaly.  The average temperature of the Earth is ~14 °C which is an absolute temperature of 287.15K.  The energy transmission of a blackbody at 287.15 K is 385.5 W/m2.  Clearly the Earth does not lose energy at that rate since it receives less than that and this is where the greenhouse effect comes into play.  The end of it all is that the Earth’s atmosphere radiates energy to space at a rate of ~198 W/m2 and also some additional energy from the surface.  I spend a lot more time on the details of this summary in the book, but in effect the Earth loses most of it’s energy to space from an altitude of ~9.5 km which has a temperature of 243K (or -30 °C).
So according to the science, a warmer Earth (and it’s atmosphere) should lose energy to space at a greater rate when the Earth warms up.  This would be a problem to prove if the Earth was at a constant temperature.  Fortunately the Earth’s temperature varies a great deal over the course of a year so it is easy to show that the Earth does in fact lose more energy when it warms up.  This can be shown by comparing the OLR (outgoing longwave radiation) to the actual global temperature.
The Inconvenient Skeptic
(Blue) Global Temperature in °C, (Red) Measured outgoing long-wave radiation. Infra-red energy.
This shows there is an immediate and direct dependence on the amount of energy the Earth is losing to space and the absolute temperature of the Earth itself.  It is also worth pointing out that while the last decade has in fact been warmer, it has also lost more energy than it did before by a large margin.
If I plot the OLR as a function of temperature, the dependence of OLR becomes clear.  In addition I have added the theoretical increase in energy transmission as a function of the absolute temperature.
The Inconvenient Skeptic
(Dots) Measured OLR Data, (Blue Line) Linear regression of the Measured OLR, (Pink) Theoretical change in OLR using the Stefan-Boltmann Law
This shows the direct dependence between OLR and temperature on a monthly basis that has a reasonably good R2 value of 0.81.  Considering the amount of local variation that exists over the entire Earth, this is a very good result.
It can also be used to compare entire years against each other.  I will pick 1984 and 2009 to show that the same result applies over the course of a year.  1984 is a good year for that since it had a temperature anomaly very close to 0.0 °C for most measurements.  As a result that would also be a year that should have an almost zero anomaly for the amount of energy that the Earth lost to space.
The Inconvenient Skeptic
OLR and Global Temperature for 1984 and 2009.
A 0.5 °C temperature difference between these two years resulted in an additional 2.5 W/m2 increase in the measured amount of energy lost to space.  That increase in energy loss is not theoretical, it is a measured difference.  It is also what is predicted by the Stefan-Boltmann Law.
If the Earth were to warm by 1.1 °C, the amount of energy lost would be almost 4 W/m2 greater than what it lost in 1984.  If the Earth were to warm by 3.0 °C which is what is predicted by a doubling of CO2, then the amount of energy lost would be > 10 W/m2 the energy loss that existed in 1984.
The science of this is very clear.  The rate at which the Earth loses energy will increase at more than twice the rate that the theoretical CO2 forcing is capable of causing warming to take place.  The amount of CO2 in the atmosphere cannot stop the Earth from losing more energy if it warms up.  The reasons behind this are the wavelengths of energy that are transmitted by the Earth, but it can simply be shown by looking at the energy loss increase that has taken place over the past 25 years.
Time to put 2.5 W/m2 into perspective.  That is comparable to the energy flux of the Gulf Stream.  That is ~500 times more than the total energy consumption of the United States in a year.  That is 80 times more energy than the entire human race uses in a year.  It is also 30 times more energy than what the Earth’s interior brings to the surface each year.  That is a huge amount of energy.  An Earth that was 3.0 °C warmer would lose more than 4x more energy than that.
There is far more information on this topic in my book and  this is only one of the major flaws in the Theory of Global Warming, but it is a big one.  It is the science that has caused me to be a global warming skeptic.  It is foolish to believe that a radiative forcing can cause warming when the rate of heat loss will increase at such a rate.  The consequences of this science is profound and will alter our understanding of the Earth’s climate.

Friday, May 11, 2012

ABC News: US has oil reserves greater than the entire Middle East

According to a segment aired by ABC World News Tonight, new oil drilling technology could allow access to 2 trillion barrels of oil within the continental US alone, which is greater than the oil reserves of the entire Middle East and North Africa combined.
 
Video of the segment including map above starts at 10:50 mark here

Thursday, May 10, 2012

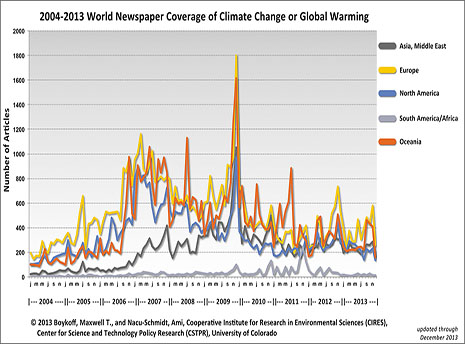
World newspaper coverage of climate change or global warming on decline

According to a study from the Center for Science & Technology Policy Research, world newspaper coverage of 'climate change' or 'global warming' has been on a declining trend since 2007 to some of the lowest levels since the study began in 2004. Coverage spiked shortly after the premier of Gore's science fiction movie An Inconvenient Truth and following Climategate I, but the biggest threat to mankind appears to no longer be as newsworthy.
This figure tracks newspaper coverage of climate change or global warming in 50 newspapers across 20 countries and 6 continents
A victim of the cry wolf syndrome perhaps?

Wednesday, May 9, 2012

Why belief in CAGW (Catastrophic Anthropogenic Global Warming) is not currently justified by the standards of the scientific method

A post today at the Paths to Knowledge blog notes that belief in CAGW is not justified under the scientific method because no peer-reviewed study as ever falsified the null hypothesis that global warming is substantially natural. But, the reverse is not true. A recent peer-reviewed study has shown that the null hypothesis [warming is substantially natural] has a statistically significant higher probability of being true than the CAGW hypothesis. Therefore, belief in CAGW is not currently justified by the standards of the scientific method. The IPCC attempts and fails to falsify the null hypothesis using circular reasoning, as noted by Dr. Tim Ball:
Computer models are key to the IPCC circular argument. They’re programmed to the assumptions of the [CAGW] hypothesis, and therefore produce results that confirm the hypothesis. The problem is, nature hasn’t cooperated.
reblogged from Paths to Knowledge:


Posted by strategesis on May 9, 2012
Science does not deal in absolute proofs. The scientific method depends upon falsification of alternative hypotheses until only one remains.
But “falsification” in science is not absolute. Instead, it is a matter of relative probabilities. Such “proof” by falsification of all alternatives is never final: All scientific laws, theories and hypotheses forever remain subject to falsification at any time–at least in principle, even if the odds of that ever happening are infinitesimally small.
All that is required to falsify an hypothesis, or to falsify the currently-accepted theory, is for an alternative hypothesis to be shown–by empirical evidence and quantitative analysis of the relative probabilities–to have a statistically-significant higher probability of being correct.
The CAGW hypothesis is that a) The Earth’s climate is warming, b) The warming is substantially a result of human emissions of CO2 and, c) The magnitude of the warming will be enough to have significant effects, and d) The net effects of the warming will be harmful, and e) The harm caused by the warming will be great enough to be worth the net costs of politically-coerced mitigation.
The alternative hypothesis–which is also the null hypothesis (<= click the link for more info)–is that a) The warming is substantially due to natural causes for which humans are not substantially responsible, and/or b) The magnitude of any human-caused warming will not be not be great enough to have significant effects by itself (regardless of the effects of any warming not caused by man,) and/or c) The net effects of warming will not be harmfull–or if they are, then not by enough to be worth the cost of politically-coerced mitigation.
The null hypothesis has never been falsified. There have been no peer-reviewed studies published that quantitatively analyze both p(CAGW | Historical-Temperature-Data) [the probability that CAGW hypothesis is true, given the historical temperature data] and p(NullHypothesis | Historical-Temperature-Data) [the probability that the Null Hypothesis is true, given the historical temperature data], showing that the former (CAGW) has a statistically significant higher probability of being true than the latter (the null hypothesis–that warming is substantially natural.)Not one.
But the reverse is not true:
Abstract:
We evaluate to what extent the temperature rise in the past 100 years was a trend or a natural fluctuation and analyze 2249 worldwide monthly temperature records from GISS (NASA) with the 100-year period covering 1906–2005 and the two 50-year periods from 1906 to 1955 and 1956 to 2005. No global records are applied. The data document a strong urban heat island effect (UHI) and a warming with increasing station elevation. For the period 1906–2005, we evaluate a global warming of 0.58°C as the mean for all records. This decreases to 0.41°C if restricted to stations with a population of less than 1000 and below 800 meter above sea level. About a quarter of all the records for the 100-year period show a fall in temperatures. Our hypothesis for the analysis is, as generally in the papers concerned with long-term persistence of temperature records, that the observed temperature records are a combination of long-term correlated records with an additional trend, which is caused for instance by anthropogenic CO2, the UHI or other forcings. We apply the detrended fluctuation analysis (DFA) and evaluate Hurst exponents between 0.6 and 0.65 for the majority of stations, which is in excellent agreement with the literature and use a method only recently published, which is based on DFA, synthetic records and Monte Carlo simulation. As a result, the probabilities that the observed temperature series are natural have values roughly between 40% and 90%, depending on the stations characteristics and the periods considered. “Natural” means that we do not have within a defined confidence interval a definitely positive anthropogenic contribution and, therefore, only a marginal anthropogenic contribution cannot be excluded.


In other words, this study finds that the probability that the observed climate change is some combination of natural variability and urban heat island effect to be as high as 90%. That’s a very strong case in favor of the null hypothesis, and makes it extremely unlikely that there could be a 3-sigma difference in favor of the AGW hypothesis.

Tuesday, May 8, 2012

New paper confirms Little Ice Age was a global phenomenon, related to solar activity

A paper published today in Geophysical Research Letters confirms that "the Little Ice Age was a global event, probably caused by a change in solar [activity] and volcanic forcing [activity]." The paper finds that Greenland and Antarctica cooled synchronously, although to different magnitudes, suggesting to the authors that climate feedbacks operate differently in the Northern and Southern Hemispheres. The Little Ice Age was associated with the Maunder Minimum, a lull in solar activity that may be similar to the present. This paper corroborates other recent research showing that the Little Ice Age was a global, not local, phenomenon. According to the paper, the temperature from 1400-1800 AD in Antarctica was on average ~ 0.52C colder and Greenland ~ 1C colder than than the last 100 year average. This would imply that the 0.7C global warming since 1850 simply represents a recovery from the Little Ice Age.


GEOPHYSICAL RESEARCH LETTERS, VOL. 39, L09710, 7 PP., 2012
doi:10.1029/2012GL051260
Key Points
  • Cold interval from 1300 to 1800 C.E. at WAIS Divide
  • The 1400-1800 C.E. was 0.52+/-0.28 deg C colder than the last 100 years
  • Cooling broadly synchronous to Greenland cooling, with lesser amplitude
Anais J. Orsi
Scripps Institution of Oceanography, University of California, San Diego, La Jolla, California, USA
Bruce D. Cornuelle
Scripps Institution of Oceanography, University of California, San Diego, La Jolla, California, USA
Jeffrey P. Severinghaus
Scripps Institution of Oceanography, University of California, San Diego, La Jolla, California, USA
The largest climate anomaly of the last 1000 years in the Northern Hemisphere was the Little Ice Age (LIA) from 1400–1850 C.E., but little is known about the signature of this event in the Southern Hemisphere, especially in Antarctica. We present temperature data from a 300 m borehole at the West Antarctic Ice Sheet (WAIS) Divide. Results show that WAIS Divide was colder than the last 1000-year average from 1300 to 1800 C.E. The temperature in the time period 1400–1800 C.E. was on average 0.52 ± 0.28°C colder than the last 100-year average. This amplitude is about half of that seen at Greenland Summit (GRIP). This result is consistent with the idea that the LIA was a global event, probably caused by a change in solar and volcanic forcing, and was not simply a seesaw-type redistribution of heat between the hemispheres as would be predicted by some ocean-circulation hypotheses. The difference in the magnitude of the LIA between Greenland and West Antarctica suggests that the feedbacks amplifying the radiative forcing may not operate in the same way in both regions.

Hit them with the Hockey Schtick

In an interview entitled "Hit Them with the Hockey Stick," Michael Mann falsely claims that the National Academy of Sciences "confirmed" Mann's hockey stick, that temperature changes "have occurred either at the upper end of projections or even above the range of predictions," and that "hide the decline" refers to "bad tree ring data." The delusional Mann states, "I think [Climategate] was a crime against humanity. It's a crime against the planet." Mann's interview regurgitates much of the nauseating diatribe from his work of fiction, The Hockey Stick and the Climate Wars.