Wednesday, April 25, 2012

New paper contradicts a tenet of global warming theory

A paper published today in Atmospheric Chemistry and Physics finds that clouds located in the stratosphere over the poles act to cool the stratosphere by adiabatic cooling, which is the cooling of air parcels as they rise and expand, rather than by 'trapping heat' below the clouds resulting in 'radiative cooling' of the stratosphere above. This finding contradicts a tenet of AGW theory, which predicts that infrared radiation from greenhouse gases will 'trap heat' to create a 'hot spot' in the troposphere and cooling of the stratosphere. This study finds that cooling of the stratosphere is instead due to rising air parcels rather than a decrease in radiation due to heat 'trapped by greenhouse gases'.

The findings of this study corroborate the climate theories of Chilingar, Jelbring, van Andel, and several others.

Atmos. Chem. Phys., 12, 3791-3798, 2012
www.atmos-chem-phys.net/12/3791/2012/
doi:10.5194/acp-12-3791-2012

On the linkage between tropospheric and Polar Stratospheric clouds in the Arctic as observed by space–borne lidar

P. Achtert, M. Karlsson Andersson, F. Khosrawi, and J. Gumbel
Department of Meteorology, Stockholm University, Stockholm, Sweden
Abstract. The type of Polar stratospheric clouds (PSCs) as well as their temporal and spatial extent are important for the occurrence of heterogeneous reactions in the polar stratosphere. The formation of PSCs depends strongly on temperature. However, the mechanisms of the formation of solid PSCs are still poorly understood. Recent satellite studies of Antarctic PSCs have shown that their formation can be associated with deep-tropospheric clouds which have the ability to cool the lower stratosphere radiatively and/or adiabatically. In the present study, lidar measurements aboard the Cloud-Aerosol Lidar and Infrared Pathfinder Satellite Observation (CALIPSO) satellite were used to investigate whether the formation of Arctic PSCs can be associated with deep-tropospheric clouds as well. Deep-tropospheric cloud systems have a vertical extent of more than 6.5 km with a cloud top height above 7 km altitude. PSCs observed by CALIPSO during the Arctic winter 2007/2008 were classified according to their type (STS, NAT, or ice) and to the kind of underlying tropospheric clouds. Our analysis reveals that 172 out of 211 observed PSCs occurred in connection with tropospheric clouds. 72% of these 172 observed PSCs occurred above deep-tropospheric clouds. We also find that the type of PSC seems to be connected to the characteristics of the underlying tropospheric cloud system. During the Arctic winter 2007/2008 PSCs consisting of ice were mainly observed in connection with deep-tropospheric cloud systems while no ice PSC was detected above cirrus. Furthermore, we find no correlation between the occurrence of PSCs and the top temperature of tropospheric clouds. Thus, our findings suggest that Arctic PSC formation is connected to adiabatic cooling, i.e. dynamic effects rather than radiative cooling.

Final Revised Paper (PDF, 809 KB)   Discussion Paper (ACPD)   Special Issue

Tuesday, April 24, 2012

New paper says ocean warming since 1984 is due to natural variability, not climate change

A paper published today in the Journal of Climate concludes "that natural variability, rather than long term climate change, dominates the sea surface temperature...changes over the 23 year period" from 1984 to 2006. The authors find that observed warming of the ocean surface would have required a 6.1 W/m2 increase in heat flux from the Sun and 'greenhouse gases' to the oceans, but that paradoxically the heat flux from those sources instead decreased -3 W/m2. The authors therefore conclude ocean surface warming has been the result of natural variability from ocean oscillations rather than 'climate change' from man-made 'greenhouse' gases.


On the Observed Trends and Changes in Global Sea Surface Temperature and Air-Sea Heat Fluxes (1984-2006)

W. G. Large* and S. G. Yeager
National Center for Atmospheric Research, Boulder, Colorado

Abstract
Global satellite observations show the sea surface temperature (SST) increasing since the 1970s in all ocean basins, while the net air-sea heat flux, Q, decreases. Over the period 1984-2006 the global changes are 0.28°C in SST and -9.1 W/m2 in Q, giving an effective air-sea coupling coefficient of -32 W/m2/°C. The global response in Q expected from SST alone is determined to be -12.9 W/m2, and the global distribution of the associated coupling coefficient is shown. Typically, about one-half (6.8 W/m2) of this SST effect on heat flux is compensated by changes in the overlying near surface atmosphere. Slab Ocean Models (SOMs) assume that ocean heating processes do not change from year to year, so that a constant annual heat flux would maintain a linear trend in annual SST. However, the necessary 6.1 W/m2 increase is not found in the downwelling longwave and shortwave fluxes, which combined show a -3 W/m2 decrease. The SOM assumptions are revisited to determine the most likely source of the inconsistency with observations. The indirect inference is that diminished ocean cooling due to vertical ocean processes [ocean oscillations] played an important role in sustaining the observed positive trend in global SST from 1984 through 2006, despite the decrease in global surface heat flux. A similar situation is found in the individual basins, though magnitudes differ. A conclusion is that natural variability, rather than long term climate change, dominates the SST and heat flux changes over this 23 year period. On shorter time scales the relationship between SST and heat flux exhibits a variety of behaviors.

Monday, April 23, 2012

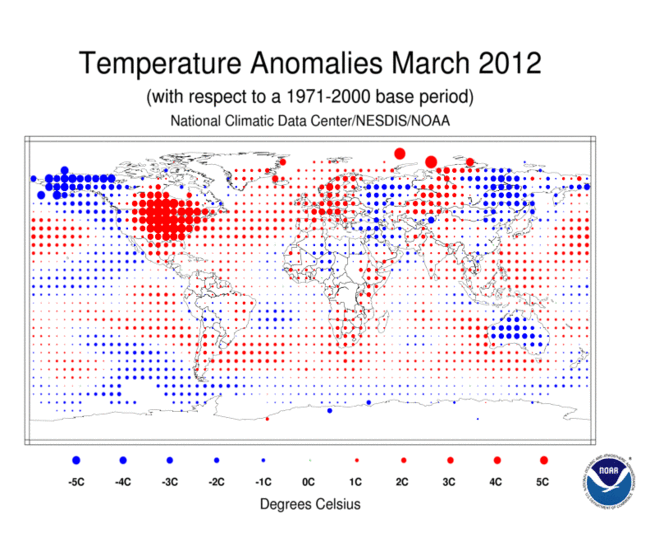
NOAA: Global temperatures for March 2012 were 'the coolest since 1999'

And January - March 2012 was 'the coolest since 1996.'
Globally, March 2012 was the coolest since 1999


Record U.S. warmth in March was not shared everywhere globally.
Web edition : Monday, April 16th, 2012
  Text Size

Even as global temperatures have been climbing throughout much of the past century, atypical warm and cool spells have seesawed regionally around the planet. March 2012 exemplified such exaggerated trends. Although the month set some 15,000 daily warming records in the United States, globally this past March was the coolest since 1999. The National Climatic Data Center reported these trend data April 16.

March’s planetary average of 13.2° Celsius still points to a steadily climbing planetary fever. That value was roughly 0.5 °C higher than the 20th century March average. And seven of the eight warmest years on record have occurred since 2001, the National Oceanic and Atmospheric Administration notes. The top 10: all since 1995.

The combined land-and-sea-surface average temperature for January through March 2012 was 0.39 °C above the 20th century average. That matched 1991 as the 21st warmest such quarter on record — and the coolest since 1996.

Polar ice rallied somewhat this year. March’s Arctic sea ice cover was the largest for this month since 2008 (and only the ninth lowest since satellite records began in 1979). In Antarctica, sea ice during March was 16 percent higher than the average and fourth largest for the month since 1979.

All of that is small comfort for me today. Normally, this time of year the temperature peaks in Washington, D.C., at a balmy 19.4 °C (67 °F). But today’s forecast calls for a blistering 30° (or 86 °F) outdoors. Even with shades drawn, the morning temperature in my sun-facing fourth floor office was distinctly uncomfortable. And without supplemental cooling (my A/C is out of service), the temp at my desk can be expected to exceed the outdoor heat by some 3° to 5°.

Saturday, April 21, 2012

Svensmark: Evidence continues to build that the Sun drives climate, not CO2

In his lecture at the recent EIKE Climate and Energy Conference, Professor Henrik Svensmark explains how the evidence continues to accumulate that solar activity is the primary driver of climate, on timescales ranging from hours to millions of years.

Prof. Dr. Henrik Svensmark
Centre for Sun-Climate Research des Danish National Space Centre 

Geologist explains how the Sun and water vapor control climate, not CO2

The IPCC claims that man-made CO2 [less than 5% of CO2 emissions; 95% are natural] drives the water cycle to cause enhanced warming of the Earth. In the video lecture below, Emeritus Professor of Geology Dr. Jan Veizer shows using data from arid and wet regions of the globe that the CO2 carbon cycle instead piggybacks on the water cycle, and that the water cycle is in turn modulated by solar activity. Professor Veizer demonstrates minimums in solar activity are followed by decreased precipitation, and that proxy data shows climate follows changes in solar activity, not CO2 levels.

Prof. Dr. Jan Veizer
Department of Earth Sciences, University of Ottawa 
Slides from the lecture:
Precipitation & climate are controlled by limits of solar radiation and available water, not CO2
  
Strong correlation between solar activity and precipitation
 
Solar activity drives climate, not CO2

Thursday, April 19, 2012

A Vivid Illustration of How the Global Warming Debate is Broken - Forbes

A Vivid Illustration of How the Global Warming Debate is Broken - Forbes:

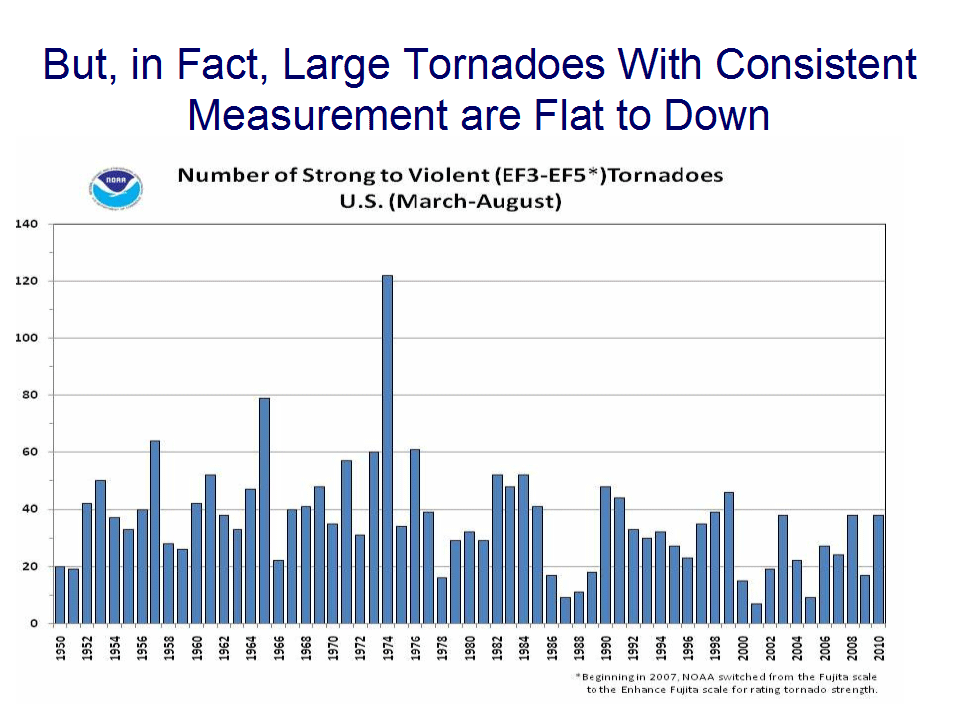
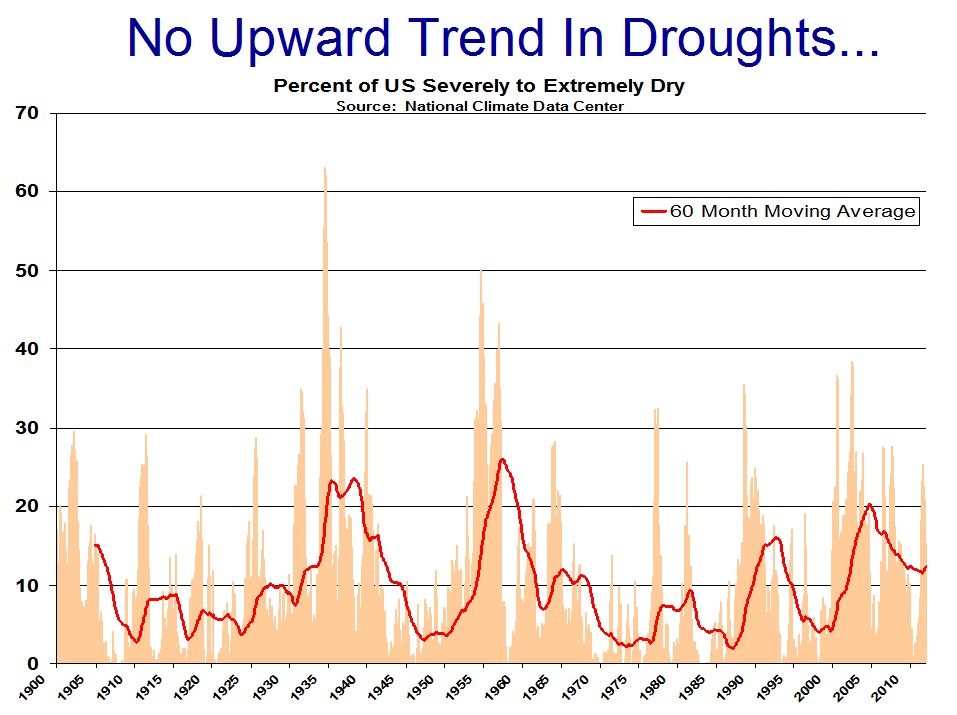
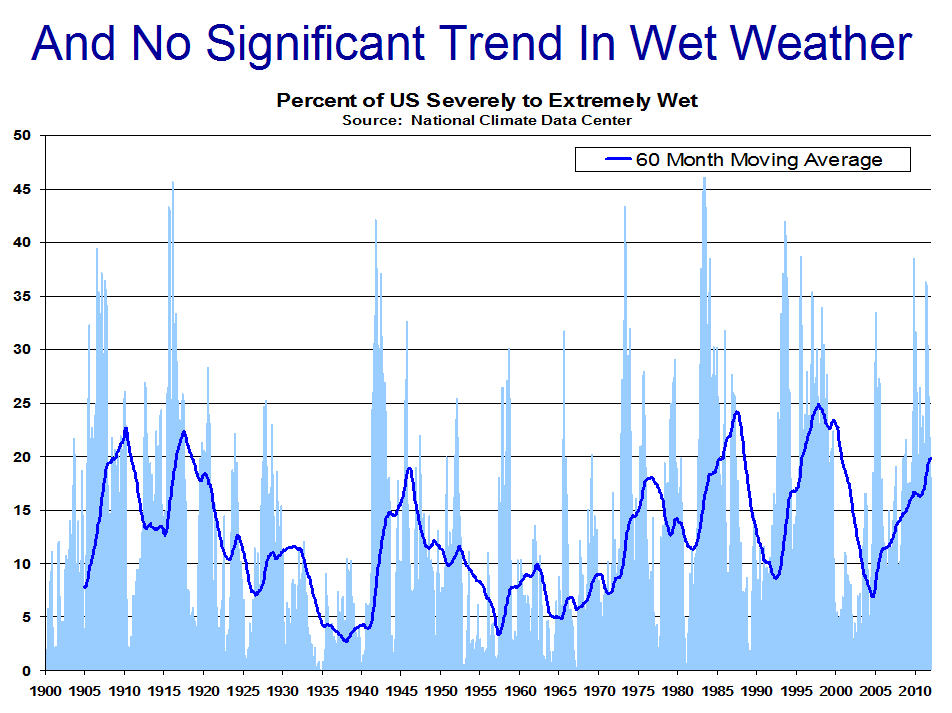
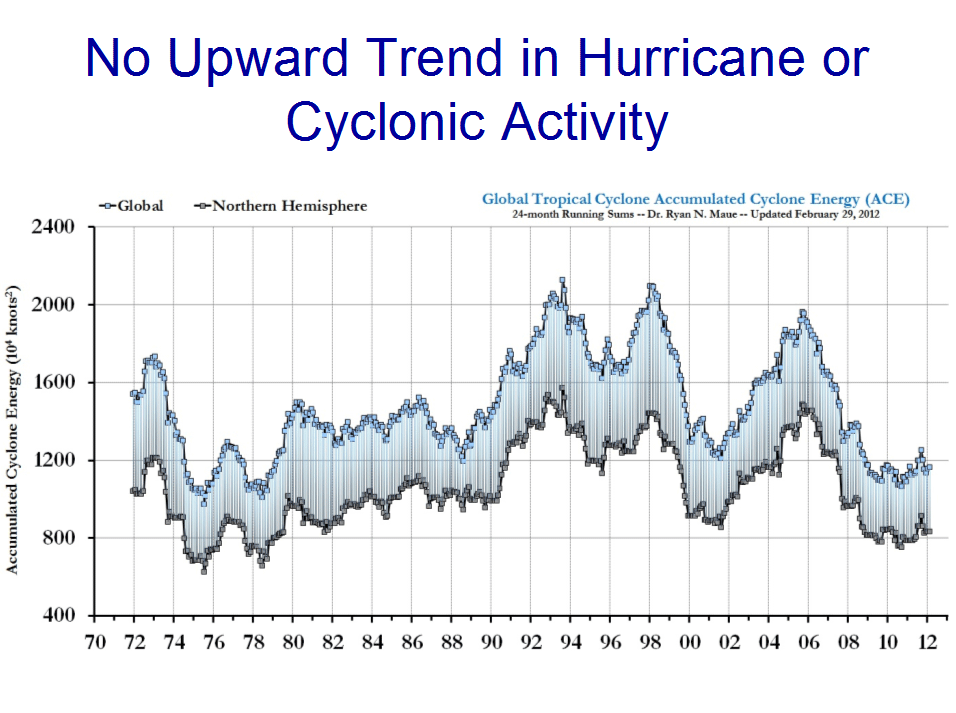
Graphics to accompany article:


New paper finds Urban Heat Island effect should not be 'considered exclusively a nighttime phenomenon anymore'

A paper published today in the Journal of Climate uses a new method comparing satellite and surface temperature observations to assess the Urban Heat Island [UHI] effect. The paper finds "UHI is stronger during the day and summer than during nighttime and winter," which is the opposite of the predictions of computer models and assumption of most climate scientists heretofore that UHI is a "nocturnal phenomenon."

From the discussion:


The UHI is evident from the radiative surface skin temperature field. There is  clear diurnal variation in UHIskin, with larger UHI intensity during daytime than during nighttime. There is also a seasonal variation in UHIskin, with a larger signal in summer than in winter. This seasonal variation corresponds to the seasonality of solar radiation, the vegetation growing cycle, and rainfall or soil moisture content.

UHIskin maximizes during the daytime. Therefore, we should not consider UHI exclusively a “nighttime phenomenon” anymore. Jin et al. (2005) suggested the possible physical mechanisms responsible for a stronger daytime UHI. The albedo is reduced in urban regions, partly due to urban canopy effect and partly due to new materials used in urban roads and buildings; consequently, more solar radiation is absorbed at the surface to warm it. In addition, surface emissivity is reduced because of the new materials used in the urban surface, leading to less longwave radiation leaving the surface. As a result, daytime UHI is stronger than that nighttime. Furthermore, urban regions reduce soil moisture and vegetation coverage, which further change the solar radiation redistribution      in terms of latent and sensible heat fluxes (e.g, Bowen ratio), and thus increases surface temperature. MODIS provides albedo data (Shaff et al. 2003), emissivity data (Jin and  Liang 2006), and vegetation data (Myneni et al. 1995), which can be further used to address these mechanisms.

Full paper here

Developing an Index to Measure Urban Heat Island Effect Using Satellite Land Skin Temperature and Land Cover Observations

Menglin S. Jin*
Department of Meteorology and Climate Science, San José State University

Abstract
A new index of calculating the intensity of urban heat island effects (UHI) for a city using satellite skin temperature and land cover observations is recommended. UHI, the temperature difference between urban and rural regions, is traditionally identified from the 2-m surface air temperatures (i.e., the screen-level temperature, T2m) measured at a pair of weather stations sited in urban and rural locations, respectively. However, such screen-level UHI is affected by location, distance, and geographic conditions of the pair of weather stations. For example, choosing a different pair of rural and city sites leads to a different UHI intensity for the same city, due to the high heterogeneity of the urban surface temperature. To avoid such uncertainty, satellite-observed surface skin temperature measurements (i.e., skin level, Tskin) is recommended to record UHI, known as skin-level UHI or UHIskin. This new index has advantages of high spatial resolution and aerial coverage to better record UHI intensity than T2m. An assessment of skin-level UHI from 10-years of the National Aeronautics and Space Administration (NASA) Moderate Resolution Imaging Spectroradiometer (MODIS) observations reveals that skin-level UHI has a strong UHI signal during day and night. In addition, there are significant diurnal and seasonal variations in skin-level UHI. Furthermore, the skin-level UHI is stronger during the day and summer than during nighttime and winter, respectively. This new index is important for more uniformly assessing UHIs over cities around the globe. Nevertheless, whether the seasonality and diurnal variations revealed in this work using skin-level UHI index is valid over desert cities, such as Phoenix, needs to be examined.

Wednesday, April 18, 2012

Ford CEO: Electric car battery costs $12,000 - $15,000 'for a type of car that normally sells for $22,000'

and the $15,000 battery [or $31,731 for the Nissan Leaf] has to be replaced every 6-8 years. 


One of the auto industry's most closely guarded secrets—the enormous cost of batteries for electric cars—has spilled out.
Speaking at a forum on green technology on Monday, Ford Motor Co. Chief Executive Alan Mulally indicated battery packs for the company's Focus electric car costs between $12,000 and $15,000 apiece.
0417focus
Associated Press
The 2012 Ford Focus Electric.
"When you move into an all-electric vehicle, the battery size moves up to around 23 kilowatt hours, [and] it weighs around 600 to 700 pounds," Mr. Mulally said at Fortune magazine's Brainstorm Green conference in California.
"They're around $12,000 to $15,000 [a battery]" for a type of car that normally sells for about $22,000, he continued, referring to the price of a gasoline-powered Focus. "So, you can see why the economics are what they are."
Ford is currently promoting its $39,200 Focus EV at events around the country. It has a 23 kilowatt-hour battery pack. A Ford spokeswoman said Mr. Mulally's comments were designed to provide a indication of the car's battery costs.
Based on the price range that Mr. Mulally indicated, Dearborn, Mich.-based Ford appears to pay between $522 and $650 a kilowatt-hour for its electric-vehicle batteries. In the past, auto makers and battery makers have been reluctant to disclose the cost per kilowatt hour. Analysts have made projections that battery costs are between $500 and $1,000 per kilowatt-hour.
The U.S. Department of Energy, as part of its efforts to help promote plug-in hybrid- and fully-electric vehicles, has set a goal of lowering the cost of batteries to $300 a kilowatt-hour by next year. The DOE has helped to fund battery plants in the U.S. to install the capacity, and ideally lower the cost of batteries.
Ford hasn't provided projections for anticipated sales of its EV, but has made the point that it doesn't need to achieve high volumes because it is building the Focus EV on the same line as the gasoline-powered version. It sold just 10 to fleet customers late last year and now is building more of the vehicles at its plant in Wayne, Mich.
The Focus EV is a direct competitor to Nissan Motor Co.'s Leaf, which sold about 9,700 in 2011 in the U.S. The Leaf starts at $35,200 and has a stated range of 73 miles on a full charge. Ford says its Focus can go up to 76 miles on a full charge and can be recharged in 3 ½ hours using a 240-volt wall charger, or about twice as fast as the Leaf.
Other auto makers including General Motors Co. and Fisker Automotive Inc. have struggled with high prices and slow initial sales of their battery-powered vehicles, but have committed to building new models.
GM is planning to introduce its all-electric Spark subcompact later this year. Its about $40,000 Volt car has a small gasoline engine that kicks in when the battery runs low.

New paper finds sea level changes since 1950 have been due to natural variability

A paper published today in Climate of the Past finds that sea level changes in the tropical Pacific during the period 1950-2009 are explained due to natural changes in the cycle of El Ninos and La Ninas [called "internal variability"]. The authors state, "While our analysis cannot rule out any influence of anthropogenic forcing [man-made 'greenhouse' gases], it concludes that the latter effect in that particular region is still hardly detectable." The paper finds no evidence of accelerating sea level rise and instead shows the running 17 year average rise has decelerated over the past ~59 years.
Middle graph shows rate of sea level change [running 17 year average] has declined over the past 59 years and is highly correlated to the natural variability of El Nino and La Nina cycles.

Clim. Past, 8, 787-802, 2012
www.clim-past.net/8/787/2012/
doi:10.5194/cp-8-787-2012

Tropical Pacific spatial trend patterns in observed sea level: internal variability and/or anthropogenic signature?

B. Meyssignac1,2, D. Salas y Melia4, M. Becker1,3,*, W. Llovel5, and A. Cazenave1,2
1Université de Toulouse, UPS (OMP-PCA), LEGOS, UMR5566, 14 Av Edouard Belin, 31400 Toulouse, France
2CNES, LEGOS, UMR5566, 18 avenue Edouard Belin 31 401 Toulouse, France
3CNRS, LEGOS, UMR5566, 14 av Edouard Belin, 31400 Toulouse, France
4Météo-France CNRM/GMGEC CNRS/GAME, 31000 Toulouse, France
5JPL, California Institute of Technology, Pasadena, California, USA
*now at: ESPACE-DEV/UAG, UMR228, Cayenne, French Guiana, France


Abstract. In this study we focus on the sea level trend pattern observed by satellite altimetry in the tropical Pacific over the 1993–2009 time span (i.e. 17 yr). Our objective is to investigate whether this 17-yr-long trend pattern was different before the altimetry era, what was its spatio-temporal variability and what have been its main drivers. We try to discriminate the respective roles of the internal variability of the climate system and of external forcing factors, in particular anthropogenic emissions (greenhouse gases and aerosols). On the basis of a 2-D past sea level reconstruction over 1950–2009 (based on a combination of observations and ocean modelling) and multi-century control runs (i.e. with constant, preindustrial external forcing) from eight coupled climate models, we have investigated how the observed 17-yr sea level trend pattern evolved during the last decades and centuries, and try to estimate the characteristic time scales of its variability. For that purpose, we have computed sea level trend patterns over successive 17-yr windows (i.e. the length of the altimetry record), both for the 60-yr long reconstructed sea level and the model runs. We find that the 2-D sea level reconstruction shows spatial trend patterns similar to the one observed during the altimetry era. The pattern appears to have fluctuated with time with a characteristic time scale of the order of 25–30 yr. The same behaviour is found in multi-centennial control runs of the coupled climate models. A similar analysis is performed with 20th century coupled climate model runs with complete external forcing (i.e. solar plus volcanic variability and changes in anthropogenic forcing). Results suggest that in the tropical Pacific, sea level trend fluctuations are dominated by the internal variability of the ocean–atmosphere coupled system. While our analysis cannot rule out any influence of anthropogenic forcing, it concludes that the latter effect in that particular region is still hardly detectable.

Final Revised Paper (PDF, 17519 KB)   Discussion Paper (CPD)   

Tuesday, April 17, 2012

Analysis finds satellite data has been continuously 'adjusted' to exaggerate sea level rise

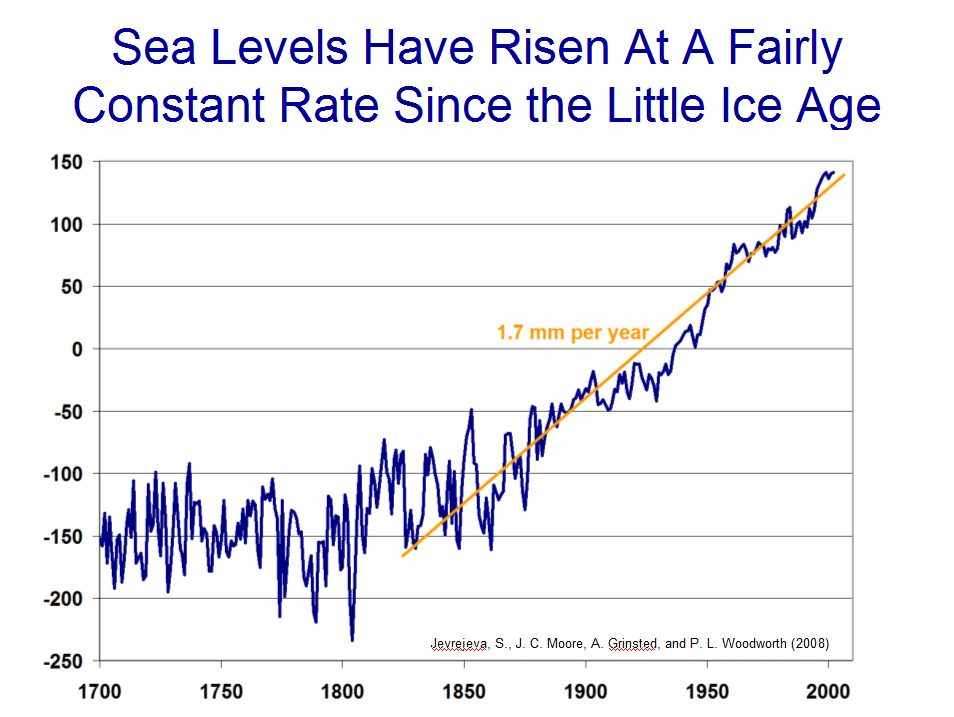
The German Skeptical Science site has analyzed satellite sea level altimetry data using the WayBackMachine archive and finds that "adjustments" have been made continuously over the past 8 years "all in one direction, namely towards an increasing sea level rise. It almost seems that in recent years the data has been "adjusted" to continue to keep the overall increase over the magical minimum of 3 millimeters per year." The analysis notes 7 other publications have found global sea level rise from tide gauges to be significantly less, from 1.2 to 1.9 mm/yr, and mentions the Holgate 2007 paper which found sea level rise decelerated over the 20th century. 
Google translation + editing, excerpt:
"because the Internet never forgets, useful sites such as the WayBackMachine [provide the history of data adjustments back to 2004]. The data for the years 2004 to 2012 are shown for comparison in the following graphic.
It can be seen at first glance that  adjustments to the data were made continuously. The interesting thing is that these adjustments have all been in one direction, namely towards an increasing sea level rise. It almost seems that in recent years the data has been "adjusted" to continue to keep the overall increase over the magical minimum of three millimeters per year. The whole thing becomes even clearer if the resultant slope for the different data versions is presented graphically.
Over the years can thus establish a "gradual" process of ever-new adjustments and corrections. We can therefore state that the raw data of sea level measurements show a rather flat course with an increase in the range of 0.5 to 1 millimeter per year. Only through a number of corrections that are based on assumptions which do not continue to increase does the "official" value become 3.1 mm per year.
Accelerated sea level rise?
Although this figure may well make one wonder. If you look at the available level data looks from around the world (Permanent Service for Mean Sea Level PSMSL , here is a list of NOAA, with stops longer measurement history and the related trends ), you have difficulty to find at all stations where a similarly high value is found for sea level rise. Now, however, should the value measured by the satellite when it is it useful to represent a first approximation, the average of the global monitoring stations.
The attempt to establish such an average has been so far by different authors using different methodologies undertaken.The values ​​found are all moving in the range of 1-2 mm per year rise (10-20 cm in 100 years). None of the authors looked even close to values ​​that the 3.1 mm / year of the satellite data. The following table provides an overview of various papers.
Author (s)YearOf estimated global sea level rise [mm / year]Number of stationsLink to Work
BC Douglas19971.8 ± 0.124http://www.springerlink.com/content/p364381652174757/
DA Burton20011.84 to 1.91http://www.sciencedirect.com/science/article/pii/S0074614201800073
Church et al.20061.7 ± 0.315
IPCC20071.8 ± 0.5http://www.ipcc.ch/publications_and_data/ar4/wg1/en/ch5s5-5-2.html
Holgate, SJ20071.75 ± 0.169http://www.joelschwartz.com/pdfs/Holgate.pdf
DA Burton2010<1.2159http://www.burtonsys.com/climate/global_msl_trend_analysis.html
Church et al.20111.7 ± 0.2290http://www.springerlink.com/content/h2575k28311g5146/fulltext.pdf
One might assume that the rise in sea level in the 20th Century has just accelerated (which was also suggested by IPCC-related authors ). An (albeit small) acceleration has been in the works of Church et al. (2006 and 2011 ).  However, the authors themselves, admit that other authors had previously not seen such an acceleration ("no 20th century acceleration has previously been detected"). It is interesting to mention that Holgate ( 2007) has found just the opposite, namely, that the increase in 1904-1953 of 2.03 mm per year was greater than in the period 1954-2003 of 1.45 mm per year.


Related: More ex-post adjustments to satellite sea level altimetry
Related: Sea level rise steadily subsiding

New analysis finds water vapor is a negative feedback

A prior post explains in simple terms why the runaway greenhouse theory is impossible due to the negative feedback from water vapor. A new analysis by physicist Clive Best of the global 5500 station CRUTEM4 database over the past 111 years comes to the same conclusion: feedback from water vapor is negative.
"the IPCC argues that  feedbacks from increased water evaporation will lead to enhanced warming. This is not observed in those regions most effected by water vapour. In fact the opposite seems to be the case implying negative feedback."
His analysis compares the most ARID stations [low humidity/water vapor] with the most WET stations [high humidity/water vapor] and finds that
"There is a clear trend in the data that ARID stations cool faster and warm faster than  WET stations." 
... 
"Water Feedback =  - 1.8 +- 0.2 W/m2K-1   
Remarkably this is the same value as that derived from  a simple argument regarding the Faint Sun paradox see here."

Shocker: Warming increases number of fish

A paper published today in Earth Interactions finds that warmer sea temperatures are associated with more fish.


Physical oceanographic influences on central Benguela fish catch

Mark R. Jury
University of Zululand, KwaDlangezwa, South Africa, 3886, and Physics Dept, University of Puerto Rico Mayagüez, PR 00681


Abstract
Ocean and atmosphere reanalysis fields are used to study environmental conditions and their relation to commercial fish catch in the central Benguela upwelling zone, using both targeted and objective techniques. Composite maps and sections indicate a 10-20% weakening of southeasterly winds, a 0.5°C warming of sea temperatures over the shelf and changes in currents and sub-surface upwelling associated with higher fish catch. During periods of high fish catch, recirculating gyres form that may aid the retention of eggs and larvae. Offshore winds contribute to poleward Ekman transport in a 50 m deep layer within 100 km of the coast.

In addition to composite analysis, the natural variability is studied by principal component analysis of wind stress, sea level, temperature, salinity, currents and vertical motion in the period 1970-2007. Comparison of interannual time scores and fisheries data indicate that anomalous poleward winds and warmer temperatures in the Luderitz plume, driven by an atmospheric trough in the South Atlantic, are associated with higher catch rates.