Showing posts sorted by relevance for query arctic temperatures warmer. Sort by date Show all posts

Tuesday, January 8, 2013

New paper finds Arctic was up to 12.6°C warmer than today

A paper published today in Palaeogeography, Palaeoclimatology, Palaeoecology reconstructs temperatures from Bylot Island in the Canadian Arctic during the late Pliocene epoch and finds mean annual temperatures were 11.4°C warmer than present-day temperatures. The authors also find June-July temperatures were "approximately 12.6°C warmer than present-day." The paper reconstructs temperatures using tree-rings from a fossilized forest that grew on Bylot Island, which is covered by ice and permafrost today. The paper adds to many other peer-reviewed papers demonstrating that the Arctic has been much warmer than modern times during many periods in the past, and without causing any "tipping points" as claimed by climate alarmists for more than 2°C warming.


Annually resolved temperature reconstructions from a late Pliocene–early Pleistocene polar forest on Bylot Island, Canada

  • a Department of Geosciences, University of Arizona, Tucson, AZ 85721,USA
  • b Laboratory of Tree-Ring Research, University of Arizona, Tucson, AZ 85721,USA
  • c Département de Géographie, Université de Montréal, Montréal, QC, CANADA H2V 2B8
  • d Centre d'Études Nordiques, Université Laval, Québec, QC, CANADA G1V 0A6

Abstract

Here we use δ18O ratios measured in tree rings of crossdated sub-fossil wood to reconstruct an annually resolved record of temperature and δ18O of meteoric water for an interglacial late Pliocene–early Pleistocene fossil forest found on Bylot Island, Nunavut, Canada. Our record represents the first crossdated record of Pliocene wood. Mean annual temperatures determined in this study average − 3.4 ± 3.8 °C, which is 11.4 ± 4.4 °C warmer than present-day Bylot Island (− 14.8 ± 2.2 °C). June–July temperatures average 13.5 ± 1.1 °C, approximately 12.6 ± 1.6 °C warmer than present-day. Meteoric water δ18O values average − 15.5 ± 2.9‰, ~ 2–6‰ more enriched than present values of precipitation δ18O. Our temperatures are comparable to mid-Pliocene modeled temperatures for the Arctic (3–5 °C warmer than present), suggesting that interglacial warm periods in the late Pliocene–early Pleistocene may have been as warm as the mid-Pliocene warm period. That both the Bylot Island forest deposit and the Kap København deposit represent the remains of northern tree-line vegetation that lived during warm interglacial periods within the overall cool Plio-Pleistocene suggests that forest deposits in the Arctic capture a snapshot of interglacial conditions during the Plio-Pleistocene rather than the average Pliocene climate and may not be suitable records to study Pliocene cooling.

Highlights

► Annually resolved Plio-Pleistocene Arctic temperatures from fossil wood tree rings. ► This is the first crossdated series of Plio-Pleistocene wood. ► Using isotopes and ring widths avegae MAT was -3.4 ± 3.8 °C ► The average reconstructed June-July temperature was 13.5 ± 1.1 °C. ► Interannual variability was 1.5° C with no clear trend over the 120 year record.

Tuesday, November 19, 2013

Hansen's NASA GISS data confirm the Arctic was warmer from 1920-1940 and cooled 1940-2000

A 2005 paper published in the ICES Journal of Marine Science shows NASA GISS data demonstrating that 20th century Arctic temperatures peaked between 1920 to 1940, followed by a decline over the remainder of the 20th century. According to the authors, 
"From approximately 1920 to 1940, North Atlantic Waters from Greenland to Norway warmed significantly, by as much as 3–4°C (Tåning, 1948). Although the causes of this event are not well understood, there is no doubt of its authenticity or widespread occurrence in temperature records (Figure 7)." and
"a major warming event in Icelandic and Greenland waters between 1920 and 1940 was extensively documented (e.g. Sæmundsson, 1932; Ahlmann, 1948; Lysgaard, 1948)."


Figure 7
Surface air temperatures for (a) St. John's, Newfoundland; (b) Nuuk, Greenland; (c) Akureyi, Iceland; and (d) Bodo, Norway. Solid line is a decadal moving average. Data from NASA database at Goddard Space Center [James Hansen's former employer GISS], New York.
The paper corroborates a new paper finding ice core proxy temperatures and 4 meteorological datasets show that 20th century Arctic temperatures peaked between 1920-1940 and cooled to the end of the record in 2000. 

This is the opposite pattern to what would be expected if man-made greenhouse gases were the cause, as even alarmists claim the increase in greenhouse gases has only had a significant effect since 1950. Instead, both of these papers demonstrate 20th century Arctic temperatures peaked between 1920-1940, followed by a declining trend to the end of the record in 2000.

Both papers demonstrate Hansen's red crayon for the Arctic amounts to nothing more than cherry picking baseline dates for comparison, omitting the hottest years from 1920-1940 as the baseline, along with upjusting station data and inappropriate extrapolations from warmer stations further south.

Hansen's red crayon can be used much more in the Arctic if the cherry-picked baseline is the global cooling scare years between 1951-1980, as Hansen did in the above figure. If the Arctic's warmest years of the 20th century between 1920-1940 were used as the baseline instead, the Arctic would show little temperature change or possibly even cooling.

On distributional responses of North Atlantic fish to climate change

G.A. Rose

Changes in fish distribution and climate in the North Atlantic have been observed for millennia by seafaring peoples, chronicled in many historical anecdotes, and recently studied systematically. For temperate to Arctic North Atlantic fish, a literature compendium of limits of temperature, salinity, and depth during feeding and spawning was used to investigate factors that influence distribution. Latitude and depth were negatively correlated with species number and density. Peak numbers of species feed at 0–4°C, but spawn at 2–7°C and salinities of 32.5–33.5. Principal components of feeding depths and temperatures suggested four groups of species: (i) small pelagics characterized by shallow habitat and cooler temperatures; (ii) most groundfish in deeper and warmer waters; (iii) warm-water large pelagics; and (iv) deepwater species. Spawning temperatures, salinities, depths, and timing produced groupings consistent with feeding components for pelagics, but differing for distant migrants such as tunas. Principal components (PCA) of spawning characteristics explained 56% of the variance in species resilience (doubling time), while PCA of feeding characteristics explained only 23%. We infer that the small pelagics capelin (Mallotus villosus) and herring (Clupea harengus) react strongly and quickly to climate change because of their physiological limits and potential for fast population growth. Verification comes from Icelandic and Greenland waters, which warmed considerably during 1920–1940, and where capelin, herring, cod (Gadus morhua), and other species shifted north very quickly.

Saturday, December 18, 2010

Paper: Arctic Temperatures 2-3C higher only 1000 years ago

A paper presented at the American Geophysical Union meeting this week finds that Ellesmere Island in the Canadian High Arctic experienced a "dramatic" Medieval Warming Period from 800-1200 AD with temperatures 2 to 3 degrees C higher than the mean temperature of the past 100 years. Ellesmere Island was also in the news this week due to a discovery of a mummified forest where "no trees now grow" due to its "current frigid state."


A 5,000 year alkenone-based temperature record from Lower Murray Lake reveals a distinct Medieval Warm Period in the Canadian High Arctic

D'Andrea, W. J.; Bradley, R. S.

American Geophysical Union, Fall Meeting 2010, abstract #PP43C-10

Lake-based paleotemperature reconstructions are of particular importance in the Arctic, where other useful archives (e.g., tree rings, speleothems) for developing dense networks of quantitative climate records are absent or limited. Lacustrine alkenone paleothermometry offers a new avenue for investigating the evolution and variability of Arctic temperatures during the Holocene. We have generated a ~5,000 year long, decadally-resolved record of summer water temperature from the annually-laminated sediments of Lower Murray Lake on Ellesmere Island in the Canadian High Arctic. The varved sediments of Lower Murray Lake allowed high-resolution sampling and excellent chronologic control of the sedimentary record. We calibrated the alkenone paleothermometer for Lower Murray Lake using previously published data as well as new data from lakes in Norway and Svalbard, providing a quantitative record of temperature variability for the past 5,000 years. The previously published mass accumulation rate from Lower Murray Lake has been interpreted as a paleotemperature record and provides complimentary information to the new alkenone record. Melt percentage measurements from the nearby Agassiz Ice Cap provide another independent summer temperature reconstruction for comparison. Most strikingly, the alkenone record reveals warm lake water temperatures beginning ~800 AD and persisting until ~1200 AD, with temperatures up to 2-3 deg C warmer than the mean temperature for the past 100 years. This dramatic medieval warm period on Ellesmere Island interrupted a distinct (neoglacial) cooling trend that had begun approximately 2000 years earlier. Furthermore, the three warmest intervals seen in the alkenone record during the past 5,000 years correspond to the periods during which the area was occupied by Paleo-Eskimo groups, providing evidence that local climate conditions played a significant role in determining migration patterns of people of the Arctic Small Tools tradition.

Mummified forest provides climate change clues
By ALICIA CHANG, AP Science Writer

AP Dec 16, 2010: "On a remote island in the Canadian Arctic where no trees now grow, a newly unearthed mummified forest is giving researchers a peek into how plants reacted to ancient climate change.

That knowledge will be key as scientists begin to tease out the impacts of global warming in the Arctic.

The ancient forest found on Ellesmere Island, which lies north of the Arctic Circle in Canada, contained dried out birch, larch, spruce and pine trees. Research scientist Joel Barker of Ohio State University discovered it by chance while camping in 2009.

"At one point I crested a small ridge and the cliff face below me was just riddled with wood," he recalled.

Armed with a research grant, Barker returned this past summer to explore the site, which was buried by an avalanche 2 million to 8 million years ago. Melting snow recently exposed the preserved remains of tree trunks, leaves and needles.

About a dozen such frozen forests exist in the Canadian Arctic, but the newest site is farthest north.

The forest existed during a time when the Arctic climate shifted from being warmer than it is today to its current frigid state. Judging by the lack of diverse wood species and the trees' small leaves, the team suspected that plants at the site struggled to survive the rapid change from deciduous forest to evergreen.

"This community was just hanging on," said Barker, who presented his findings Thursday at the American Geophysical Union meeting in San Francisco.

The next step is to examine tree rings to better understand how past climate conditions stressed plant life and how the Arctic tundra ecosystem will respond to global warming.

Since 1970, temperatures have climbed more than 4.5 degrees in much of the Arctic, much faster than the global average."

Note: the alarmist claim in the last sentence above from James Hansen/GISS is based upon extrapolated temperatures from sites up to 1000 miles south and is contradicted by data from the Danish Meteorology Institute, which has direct measurements from multiple sites in the high Arctic:
  

Monday, February 24, 2014

Why "The Arctic is melting!" is just Mann-made global warming scaremongering

Reblogged from Real Science:

Understanding The 1979 Arctic Ice Cherry Pick

Posted on February 22, 2014 by stevengoddard

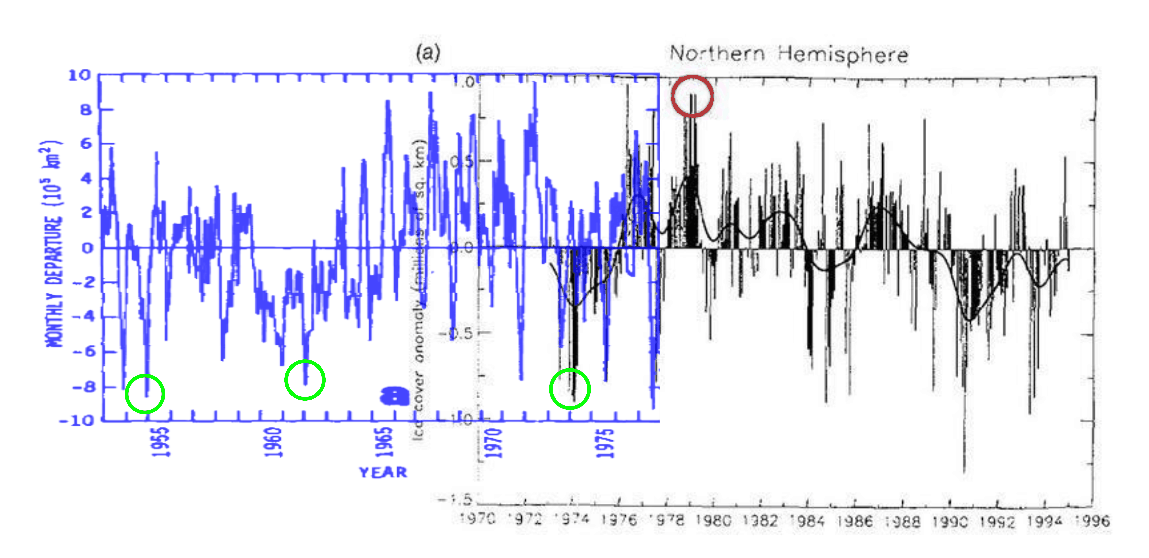
Climate fraudsters like to claim that Earth began in 1979, the year of peak Arctic sea ice. The graph below shows why. If they started their graph in 1954, there would be almost no downwards trend to the present.


journals.ametsoc.org/doi/pdf/10.1175/1520-0485(1979)009<0580>2.0.CO%3B2


Reblogged from Global Warming Solved:

Is the Arctic melting?

Ice trends

The satellite records only began in October 1978, however. This coincided with the start of a recent warming trend in the Arctic. Before that, from the 1950s-1970s, Arctic temperatures were cooling. So, it is quite likely that in the decades immediately before the satellite records began, average Arctic sea ice extent was actually increasing, but we just weren’t monitoring it. It seems that the Arctic sea ice extent naturally goes through periods of expansion, followed by periods of contraction.


In case you’re unsure about which is which, the Arctic is the polar region in the north (the one with polar bears, etc.) and the Antarctic is the polar region in the south (the one with penguins, etc.)

In this essay, we look at what we know about Arctic sea ice extent.

1. The satellite era
2. What do we know about Arctic temperatures?
3. The pre-satellite era
4. The great Arctic explorers
5. Conclusions

1. The satellite era

Every winter, the sea ice in the polar regions grows, but then in the summer, it melts again.


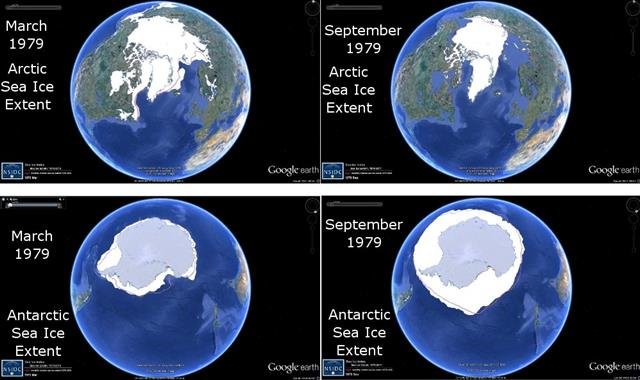
Figure 1. Minimum and maximum sea ice extents for northern and southern hemispheres in 1979. Click to enlarge.Since winter and summer are reversed between the southern and northern hemispheres, this means that as the Arctic sea ice reaches its maximum extent in March, the Antarctic sea ice is reaching its minimum extent. By September, the situation has reversed (minimum Arctic and maximum Antarctic sea ice). This can be seen from the Google Earth images in Figure 1 (generated using data from NSIDC).


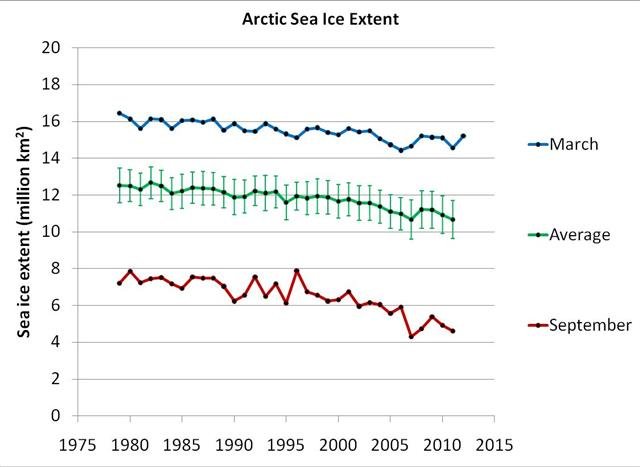
Figure 2. Trends in maximum (March), minimum (September) and average annual sea ice extents for the Arctic, since records began in 1979. Error bars for the average value correspond to the standard errors. Click to enlarge.This cyclical pattern occurs every year. However, since satellite records began in 1979, the maximum (March) and minimum (September) sea ice extents in the Arctic seem to have been gradually decreasing. This can be seen from Figure 2 (generated using NSIDC data).


This has led many people to worry that it is man-made global warming which is causing the Arctic sea ice to melt, and that humans are therefore destroying an entire ecosystem, threatening animals such as polar bears.

As a result, much of the research in the Arctic in recent years has become dominated by a heavy focus on man-made global warming, rather than studying the Arctic as a fascinating region in itself.


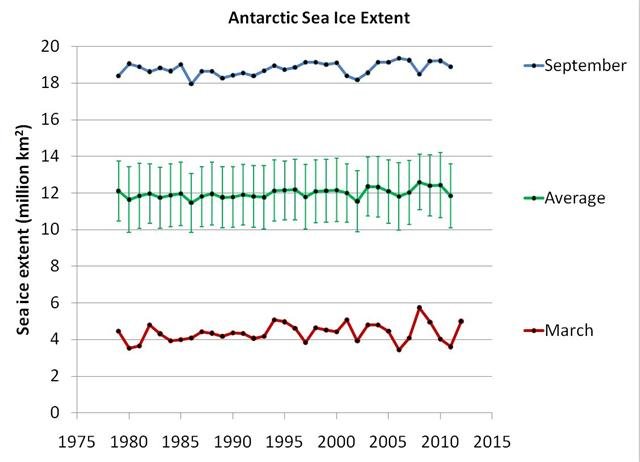
Figure 3. Trends in maximum (September), minimum (March) and average annual sea ice extents for the Antarctic, since records began in 1979. Error bars for the average value correspond to the standard errors. Click to enlarge.Interestingly, even though you might expect “global” warming to occur globally, in the southern half of the world, the Antarctic sea ice extent doesn’t seem to have changed much (see Figure 3). This apparent paradox has puzzled those who believe the Arctic melting is due to man-made global warming.

As a result, some groups have struggled to come up with explanations as to why man-made global warming is not causing melting of Antarctic sea ice. For example, Zhang, 2007 (Open access) proposed that warmer waters off Antarctica might make the water less salty, and that maybe this would stop the ice from melting. We believe a much simpler explanation is that the changes in the Arctic sea ice arenot due to the “man-made global warming” assumed by current climate models. If the explanation is not “CO2-related”, then we would no longer need to worry about why the models don’t match the data – it would just mean that the models are wrong.

At any rate, since the Antarctic sea ice extent doesn’t seem to be declining, the public concern over sea ice seems to be confined to the Arctic. With that in mind, let us limit our discussion in this essay to the Arctic, i.e., the region which has shown a decrease in polar sea ice. The fact that the Arctic sea ice seems to have been steadily decreasing “since records began” does initially seem alarming. However, as we will see below, this is because “the records” only began in October 1978, as the satellites weren’t launched until then.
There may be some problems with the satellite estimates of sea ice extent, e.g., see here. Estimating sea ice extent from satellites is a complex problem – the satellites aren’t actually photographing the amount of ice, so it’s not a simple case of looking at a photograph and saying “oh, there’s some ice there, and none there”.

Instead, they measure microwave emissions. Analysts then try to convert those measurements into estimates of sea ice. These conversions rely on several different assumptions being valid. If there are problems with those assumptions, it may affect the reliability of the satellite estimates.

However, for the purposes of this post, we assume that the satellite estimates are reliable.

2. What do we know about Arctic temperatures?


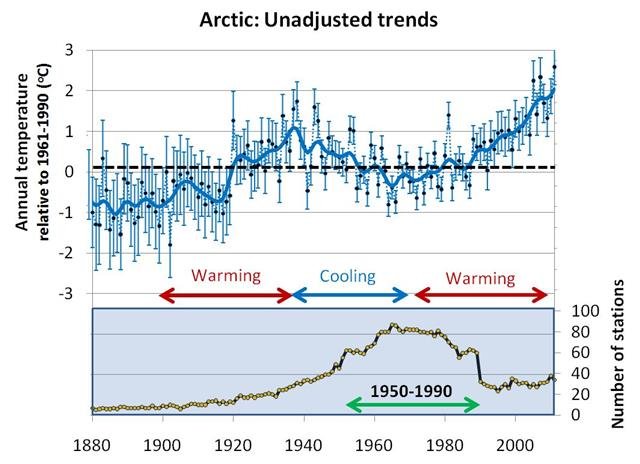
Figure 4. Top panel: Unadjusted average temperature trends of all GHCN stations in the Arctic Circle. Thick solid line corresponds to a smoothed average (11 point binomial). Bottom panel: Number of stations available in a given year. Taken from our Urbanization bias III paper. Click to enlarge.In Figure 4, the average annual temperature trends for the Arctic are shown (the graph is taken from our “Urbanization bias III” paper – Provide link!). We can see that there has indeed been a warming trend since the late 1970s. However, if we look at the rest of the data, the problem of the sea ice record only beginning in 1979 should become obvious – the warming trend since the 1970s followed acooling trend from the 1940s. If the sea ice records had started just a bit earlier, they would probably have first shown sea ice growth!

Before the 1940s-1970s Arctic cooling, there also seems to have been another warming period (1900s-1930s). We do not have enough weather records to reliably tell what happened to Arctic temperatures before the 20th century, but it is at least plausible that similar cooling and warming periods also occurred then. It seems that temperatures in the Arctic naturally alternate between periods of warming and periods of cooling.

In the next sections, we will argue that sea ice conditions in the late 1970s were relatively severe. So, the fact that the Arctic sea ice extent seems to have been decreasing since then is not an indicator of “unusual and dramatic melting of the Arctic”. Instead, it seems that the satellite monitoring of the Arctic sea ice just coincidentally started at the wrong time, i.e., just when the last Arctic cooling period had ended!

But before we get to that, some readers might say, “If you look at the graph of Arctic temperatures since 1880, the linear trend shows warming, so that must be due to human activity!”. Well, no.

First, the trends are non-linear, so the “linear trend” is irrelevant. There are periods of both warming and cooling, so the linear trend changes depending on where you start and end your analysis. If you want to, you can technically calculate a “linear trend” for any (x,y) dataset, but if it is non-linear data, as is the case here, then it is a meaningless calculation. See our “Urbanization bias I” paper for more discussion (Provide link!).

Second, there is no reason to assume warming must be “man-made”, rather than just a natural occurrence. For instance, Prof. Syun-Ichi Akasofu, the founding director of the International Arctic Research Center (retired in 2007) argues that the world may still be recovering naturally from the Little Ice Age of the 18th and 19th centuries. Dr. Willie Soon has found that the warming and cooling trends in the Arctic are actually strongly correlated to changes in solar activity, e.g., Soon, 2009 (Abstract; Google Scholar access).


Figure 5. Locations of stations used for constructing the above graph. The 6 stations with data for at least 75 of the last 80 years are shown with white squares. Click to enlarge.Finally, as we discuss in our “Urbanization bias III” paper (Provide link!), there are very few stations with long records available for the Arctic (see the bottom panel of the earlier figure showing Arctic temperature trends). The map in Figure 5 shows the locations of all the available stations – only six of the stations have data for 75 of the last 80 years, and five of them are from a relatively small region (northern Scandinavia).

This means that if there are non-climatic biases in any of the station records, it could strongly alter the apparent trends of the average “Arctic temperatures”. This is a particular concern for periods when the number of stations were very low, e.g., there appears to have been a sudden warming step change at about 1920, but there were only a few stations actually available then, so it is hard to know if the apparent step change was genuinely climatic.

For example, many of the Arctic stations are airport stations, and improvements in the airport infrastructure, such as insulation of permafrost-based runways (e.g., Instanes & Mjureke, 2005) could easily have introduced warming biases in recent decades.

Also, you might not think urbanization bias would be a major problem in the Arctic, since most of the big cities are at lower latitudes. But, in tundra conditions, even modest urbanization can introduce significant biases.


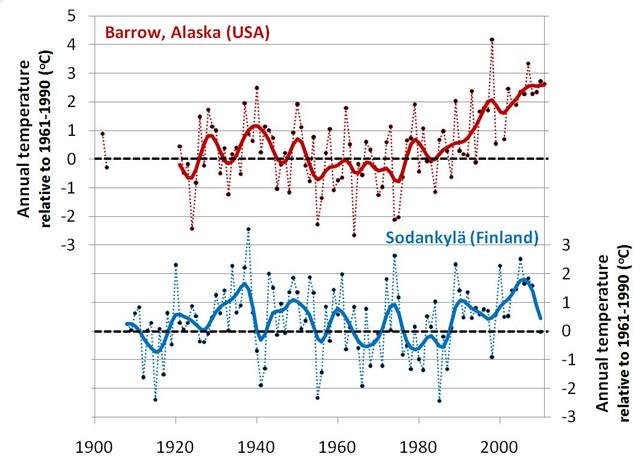
Figure 6. Comparison of temperature trends for two of the six Arctic stations with relatively long and complete records. Thick solid lines correspond to smoothed averages (11 point binomial). Taken from our Urbanization bias III paper. Click to enlarge.For instance, even though Barrow, Alaska (USA) still has a relatively small population (4,500 in 2000), urbanisation has led to a considerable urban heat island there in recent years – see Hinkel et al., 2003(Open access). This would have introduced an artificial warming trend which would make the recent warm period seem warmer than it actually was. In comparison, the rural Sodankylä, Finland station also shows a warming trend since the late 1970s, but it followed a cooling period from the 1940s, and its warmest year was actually in 1937 (see Figure 6).

So, unfortunately, the data is really too limited to make definite conclusions (e.g., only six stations with data for 75 of the last 80 years, and at least one of them is known to have an urban heat island). It may well be that the recent warm period was warmer than the early 20th century warm period, as the raw data suggests… Or it may be that biases in the raw data are substantial, and the early 20th century warm period was just as warm as the recent warm period, or maybe even warmer.

Whatever the case, it is clear that the Arctic seems to alternate between periods of warming and periods of cooling. Hence, the fact that “the Arctic sea ice has been decreasing since records began” is merely down to the fact that the records only began in 1978. In the next sections, we will try to estimate how sea ice varied, before the satellite era.

3. The pre-satellite era

A few groups have attempted to construct sea ice estimates for the pre-satellite era using various combinations of land, ship, submarine, buoy and aircraft measurements made over the years, e.g., the Chapman & Walsh dataset or the Zakharov dataset (Note that the server for the Zakharov dataset is not always online, so the link sometimes doesn’t work). These datasets represent a considerable amount of compilation work, and probably could be used to extract useful climate information. But, as we will discuss below, there are too many inconsistencies in the data sources for a simple analysis.

Some people have used these datasets to argue that the decreasing trend during the satellite era is an acceleration of an already decreasing trend in the pre-satellite era. For instance on the “Open Mind” blog, the blogger “Tamino” has used the Walsh & Chapman dataset to claim that the satellite era melt is unprecedented, e.g., here. However, these datasets should not be used for estimating long term trends. The problem is that such datasets are actually composite datasets constructed by compiling together as many measurements as the researchers can for a given year.

The measurement sources vary dramatically over the years. For instance, in Siberia, measurements up until the late 1930s were mostly from shipping lane reports, while after the late 1930s they mostly came from aircraft measurements. In addition, the actual regions with available data varied substantially over the decades. So, a sea ice estimate for a region constructed from shipping reports in the 1920s might not be directly comparable to an estimate for the same region from the 1940s made from aircraft measurements. Hence, they cannot be used for calculating long term trends.

We suspect that with careful work and calibration, it might be possible to construct useful long term trends for at least part of the pre-satellite era. However, they don’t seem to be reliable yet. For example, we saw in the previous section, that the temperature records show a period of substantial warming followed by a period of substantial cooling up to the satellite era. But, pre-satellite sea ice datasets such as Walsh & Chapman’s don’t show any of that variability in the pre-satellite era.

So, unfortunately, we can’t use the pre-satellite estimates for assessing how unusual the recent melting has (or hasn’t) been. Fortunately, there are ways of assessing how unusual the sea ice in 1979 (at the start of the satellite era) was. If the claim that the recent Arctic melting is unusual and due to man-made global warming were true, then this would mean that the sea ice extent in September 1979 was relatively low (September being the month of minimum sea ice in the Arctic).

In the following section, we will assess this claim, by trying to answer the question, “Would the great 19th and early 20th Arctic explorers have been able to carry out all their voyages if they had attempted it during 1979 conditions?” If September 1979 sea ice extent was already quite low, then 1979 conditions would have been relatively easy for them. However, as we will see, many of the early explorers managed to get much further than they could have in 1979. In other words, at the time of those voyages, the sea ice extent was probably much lower than it was at the start of the satellite era.

Monday, August 27, 2012

New paper finds deep Arctic Ocean from 50,000 to 11,000 years ago was 1–2°C warmer than modern temperatures

A new paper published in Nature Geoscience finds "From about 50,000 to 11,000 years ago, the central Arctic Basin from 1,000 to 2,500 meters deep was ... 1–2°C warmer than modern Arctic Intermediate Water." This finding is particularly surprising because it occurred during the last major ice age.
Horizontal axis is thousands of years ago with modern temperatures at the left and 50,000 years ago at the right. Temperature proxy of the Intermediate Water Layer of the Arctic Ocean is shown in top graph with degrees C anomaly noted at the upper right vertical axis. Note this graph is on an inverse scale with warmer temps at the bottom and colder temps at the top.

Deep Arctic Ocean warming during the last glacial cycle


T. M. Cronin, G. S. Dwyer, J. Farmer, H. A. Bauch, R. F.
Spielhagen, M. Jakobsson, J. Nilsson, W. M. Briggs Jr &
A. Stepanova

Nature Geoscience (2012) doi:10.1038/ngeo1557


In the Arctic Ocean, the cold and relatively fresh water
beneath the sea ice is separated from the underlying warmer
and saltier Atlantic Layer by a halocline. Ongoing sea ice
loss and warming in the Arctic Ocean have
demonstrated the instability of the halocline, with
implications for further sea ice loss. The stability of the
halocline through past climate variations is unclear.
Here we estimate intermediate water temperatures over the
past 50,000 years from the Mg/Ca and Sr/Ca values of
ostracods from 31 Arctic sediment cores. From about 50 to
11 [thousand years] ago, the central Arctic Basin from 
1,000 to 2,500m was occupied by a water mass we call 
Glacial Arctic Intermediate Water. This water mass was 
1–2°C warmer than modern Arctic Intermediate Water,
with temperatures
peaking during or just before millennial-scale Heinrich cold
events and the Younger Dryas cold interval. We use
numerical modelling to show that the intermediate depth
warming could result from the expected decrease in the flux
of fresh water to the Arctic Ocean during glacial conditions,
which would cause the halocline to deepen and push the
warm Atlantic Layer into intermediate depths. Although not
modelled, the reduced formation of cold, deep waters due to
the exposure of the Arctic continental shelf could also
contribute to the intermediate depth warming.

Monday, March 4, 2013

New paper finds Arctic temperatures were up to 3.8°C warmer ~3000 years ago

A paper published today in Quaternary Science Reviews reconstructs Arctic temperatures in Kamchatka, USSR over the past 4,500 years and finds the highest reconstructed temperatures were about 3.8°C warmer than modern temperatures. The authors find "the highest reconstructed temperature reaching 16.8 °C between 3700 and 2800 years before the present," about 3.8°C above "modern temperatures (∼13 °C)." In addition, the data shows temperatures between 2500 - 1100 [during the Medieval and Roman warming periods] were about 1-2°C above modern temperatures of ~13°C. The paper adds to many other peer-reviewed papers demonstrating that there is nothing unusual, unnatural, or unprecedented regarding modern Arctic temperatures. 
Graph on left side shows reconstructed July temperatures were 1-2°C  higher than modern from 2500-1100 years ago [during the Roman and Medieval warming periods], and up to 3.8°C higher than modern from 3700-2800 years ago [during Egyptian and Minoan warming periods]. Second graph from left shows similar changes in Greenland ice core data.

Late Holocene climate and environmental changes in Kamchatka inferred from the subfossil chironomid record
  • a Alfred Wegener Institute for Polar and Marine Research, Research Unit Potsdam, Telegrafenberg A43, 14473 Potsdam, Germany
  • b Kazan Federal University, Kremlyovskaya Str., 18, 420018 Kazan, Russia
  • c Potsdam University, Am Neuen Palais 10, 14469 Potsdam, Germany
  • d University of Tromsø, Department of Geology, Dramsveien 201, 9037 Tromsø, Norway
  • e Institute of Volcanology and Seismology FED RAS, Piipa blvd., 9, 683006 Petropavlovsk-Kamchatsky, Russia

Abstract

This study presents a reconstruction of the Late Holocene climate in Kamchatka based on chironomid remains from a 332 cm long composite sediment core recovered from Dvuyurtochnoe Lake (Two-Yurts Lake, TYL) in central Kamchatka. The oldest recovered sediments date to about 4500 cal years BP. Chironomid head capsules from TYL reflect a rich and diverse fauna. An unknown morphotype of Tanytarsini,Tanytarsus type klein, was found in the lake sediments. Our analysis reveals four chironomid assemblage zones reflecting four different climatic periods in the Late Holocene. Between 4500 and 4000 cal years BP, the chironomid composition indicates a high lake level, well-oxygenated lake water conditions and close to modern temperatures (∼13 °C). From 4000 to 1000 cal years BP, two consecutive warm intervals were recorded, with the highest reconstructed temperature reaching 16.8 °C between 3700 and 2800 cal years BP. Cooling trend, started around 1100 cal years BP led to low temperatures during the last stage of the Holocene. Comparison with other regional studies has shown that termination of cooling at the beginning of late Holocene is relatively synchronous in central Kamchatka, South Kurile, Bering and Japanese Islands and take place around 3700 cal years BP. From ca 3700 cal years BP to the last millennium, a newly strengthened climate continentality accompanied by general warming trend with minor cool excursions led to apparent spatial heterogeneity of climatic patterns in the region. Some timing differences in climatic changes reconstructed from chironomid record of TYL sediments and late Holocene events reconstructed from other sites and other proxies might be linked to differences in local forcing mechanisms or caused by the different degree of dating precision, the different temporal resolution, and the different sensitive responses of climate proxies to the climate variations. Further high-resolution stratigraphic studies in this region are needed to understand the spatially complex pattern of climate change in Holocene in Kamchatka and the surrounding region.

Highlights

► We investigated fossilized chironomids in lake sediment core from Central Kamchatka. ► We reconstructed late Holocene climate variations using chironomid inference model. ► Before 3.7 cal ka BP reconstructed TJuly are close to present day temperatures. ► Between 3.7 and 1.1 cal ka BP two warm stages are reconstructed. ► After 1.1 cal ka BP lower than present day TJuly are reconstructed.

Tuesday, September 20, 2011

New paper says a warmer Arctic will be a cleaner Arctic, finds new negative-feedback

from AGU Journal Highlights September 20, 2011

Arctic air may become cleaner as temperatures rise

The air in the Arctic is cleaner during summer than during winter. Previous studies have shown that for light-scattering pollutants, this seasonal cycle is due mainly to summer precipitation removing pollutants from the air during atmospheric transport from midlatitude industrial and agricultural sources.
With new measurements from Barrow, Alaska, and Alert, Nunavut, Canada, Garrett et al. extended previous research to show that light-absorbing aerosols such as black carbon are also efficiently removed by seasonal precipitation.
Precipitation removes these particles from the air most efficiently at high humidities and relatively warm temperatures, suggesting that as the Arctic gets warmer and wetter in the future, the air and snow might also become cleaner. If Arctic aerosols have a net warming effect, as is believed to be the case, precipitation removing these particles from the air would represent a negative climate feedback, mitigating anticipated Arctic warming.

GEOPHYSICAL RESEARCH LETTERS, VOL. 38, L16805, 6 PP., 2011
doi:10.1029/2011GL048221
Key Points
  • Arctic aerosol have a strong seasonal cycle that is dominated by wet scavenging
  • Both soot and sulfate are affected nearly equally by wet scavenging processes
  • We can anticipate from this study that a warmer Arctic will be a cleaner Arctic
Timothy J. Garrett et al
In a prior study, a decade-long dataset of ground-based aerosol and carbon monoxide measurements from Barrow, Alaska (71°N, 157°W) was used to show that surface air in the Arctic is clean during the summer, less due to inhibited transport of pollutants from mid-latitudes, and more because of efficient wet scavenging at temperatures near freezing. Here, the analysis is extended to light-absorbing aerosols, such as black carbon, and to measurements from Alert, Canada (82°N, 62°W). The data imply that both light scattering and light absorbing aerosols have similar seasonal cycles, independent of location, and they are controlled nearly equally by wet scavenging. Removal is particularly efficient at high relative humidities and warm temperatures, which suggests that a future warmer and wetter Arctic may also be cleaner. Assuming aerosol pollutants generally have a warming effect in the Arctic, such an increase in wet scavenging would represent a negative Arctic climate feedback.

Saturday, January 25, 2014

New paper finds the Arctic was warmer than the present during the Medieval Warm Period

A paper published today in Global and Planetary Change reconstructs temperatures in Northern Fennoscandia [within the Arctic circle] over the past 1,600 years and finds more non-hockey-sticks clearly demonstrating that the Arctic was warmer than the present during the Medieval Warm Period. The paper adds to over 1,000 peer-reviewed published non-hockey-sticks finding the Medieval Warm Period was global, as warm or warmer than the present, and that there is nothing unusual, unnatural, or unprecedented about the current warm period. 

Furthermore, the authors find a natural 70-80 year oscillation of temperatures, similar to the 60-70 year oscillation of the natural Pacific Decadal Oscillation [PDO].

So much for "Arctic amplification."


All four of these temperature reconstructions show the Medieval Warm Period ~1000 years ago was warmer than the present [year 2000].


Fig. 1. Different estimates of Northern Fennoscandian temperature anomalies between 400-2000 AD. Shown are the present conventional estimate (Ttorn, green) which is rather close to that in Grudd08, the present filtered estimate (Tlong, blue), smoothed temperatures of Esper12 (Tesp, red) and smoothed August SST reconstruction from the Norwegian Sea (black).
Fig. 3. August SST [sea surface temperature] reconstructions from the south of Iceland (above, blue) and the Norwegian Sea (below, blue) (modified from Miettinen et al., 2012). Red solid lines show smoothed values.

The new temperature reconstruction presented by this paper shows the Medieval Warm Period [~1000 years ago] in the Arctic was warmer than the present [year 2000] temperatures. 
Fig. 4. The present estimate of the climatic temperature anomalies (red, Tclim = Tesp + Tsea + Tvolc), and Tesp from Fig. 1 (thick blue).

A 70-80 year peridiocity identified from tree ring temperatures AD 550 – 1980 in Northern Scandinavia

  • a Finnish Meteorological Institute, P.O. Box 503, FI – 00101 Helsinki, FINLAND
  • b Department of Geosciences and Geography, P.O. Box 64, FI – 00014 University of Helsinki FINLAND

Highlights

Volcanism and millennial variations
Decadal (volcanic) variations
Multidecadal (oceanic) variations
Climate variations as seen in tree-ring temperatures
Biases in the Torneträsk paleotemperatures

Abstract

The classical Maximum Density data of 65 Torneträsk trees from years 441-1980 AD are studied in millennial, centennial and volcanic scales. The millennial scale is analyzed applying a specific filtering method. In that scale, the climate is cool after 1200-1400 AD. This more or less steady period is suggested to be due to volcanic episodes, which reduced the northward heat transport in the North Atlantic. The century scale variation, on the other hand, is suggested to be due to [natural] internal oscillations in sea surface temperature (SST) and to be connected to variations in the Arctic sea ice. Specifically, these oscillations have caused an additional warming and cooling trend in Northern Fennoscandian temperatures before and after 1930’s, respectively.
Variations in the temperature estimates are explained by the results for different temporal scales. All of them show local impacts leading to differences when compared with hemispheric estimates. The long-term estimate of the temperature as derived from the present Torneträsk data is found to be biased. The source of that is unknown.