| |||
| A leading British climate scientist claims the current rate of decline in solar activity is such that there is now a real risk of a ‘Little Ice Age’. The severe cold went hand in hand with an exceptionally inactive sun, and was called the Maunder solar minimum. Now a leading scientist from Reading University has told me that the current rate of decline in solar activity is such that there’s a real risk of seeing a return of such conditions. Following analysis of the data, Professor Lockwood believes solar activity is now falling more rapidly than at any time in the last 10,000 years. Based on his findings he’s raised the risk of a new Maunder minimum from less than 10% just a few years ago to 25-30%. --Paul Hudson, BBC Weather, 28 October 2013 The sun is ‘quietening’ really rapidly. We think it is actually quietening more rapidly than at any time in the last 10,000 years. So this is a major change. We think lower solar activity does seem to tie up with more cold winters in central Europe and the UK. –- Professor Michael Lockwood, BBC TV 28 October 2013  Britain faces a new mini-Ice Age with decades of severe Siberian winters and washout summers, an expert has warned. Professor Mike Lockwood, of Reading University, said erratic and extreme weather patterns could be the norm in 20 years. He said the risk of harsh winters and wet miserable summers has gone up to 25 to 30 per cent compared with 10 per cent a few years ago. Weakening sunspot activity is to blame for a “major change” in the UK’s weather he told BBC TV. Climatologist Dr Dennis Wheeler from Sunderland University, said: “When we have had periods where the sun has been quieter than usual we tend to get these much harsher winters.” --Nathan Rao, Daily Express, 28 October 2013 The previous lengthy period of low solar activity was the so-called Maunder Minimum that occurred between about 1640 and 1710. This was coincident with a cold climatic spell called the Little Ice Age. This was once thought to be confined to North West Europe, then the Northern Hemisphere. However recent research is showing this cold spell to be a global phenomenon. It would be fair to say that no one knows why the Little Ice Age took place... It may be no coincidence that estimates of the turn-around in solar activity from grand maximum to decline might have occurred between 1985 – 95, and that global annual average surface temperatures have been flat since 1997. --David Whitehouse, The Global Warming Policy Foundation, 30 October 2013 Predictions that 2013 would see an upsurge in solar activity and geomagnetic storms disrupting power grids and communications systems have proved to be a false alarm. Instead, the current peak in the solar cycle is the weakest for a century. Subdued solar activity has prompted controversial comparisons with the Maunder Minimum, which occurred between 1645 and 1715, when a prolonged absence of sunspots and other indicators of solar activity coincided with the coldest period in the last millennium. The comparisons have sparked a furious exchange of views between observers who believe the planet could be on the brink of another period of cooling, and scientists who insist there is no evidence that temperatures are about to fall. In all fairness, Russian scientists have warned over a decade ago that the Earth will enter a mini ice age period. --MINA News, 19 September 2013 The sun is acting bizarrely and scientists have no idea why. Solar activity is in gradual decline, a change from the norm which in the past triggered a 300-year-long mini ice age. The fall-off in sunspot activity still has the potential to affect our weather for the worse, Dr Elliott said. Research by Prof Mike Lockwood at the University of Reading showed how low solar activity could alter the position of the jet stream over the north Atlantic, causing severe cold during winter months. This was likely the cause of the very cold and snowy winters during 2009 and 2010, Dr Elliott said. “It all points to perhaps another little ice age,” he said. “It seems likely we are going to enter a period of very low solar activity and could mean we are in for very cold winters.” -- Dick Ahlstrom, The Irish Times, 12 July 2013 The Little Ice Age appears to have affected the climate powerfully. IPCC-leaning scientists, however, say that the Little Ice Age couldn't have been caused by solar variability - not even solar variability combined with sky-darkening volcanic eruptions - as the effects would have been too weak. A Swiss team of researchers now say that in fact the Little Ice Age most certainly could have been triggered by variations in the Sun. --Lewis Page, The Register, 1 October 2013  1) BBC: Real Risk Of A Maunder Minimum 'Little Ice Age' Says Leading Scientist - BBC Weather, 28 October 2013 2) Now Get Ready For An ‘Ice Age’ As Experts Warn Of Siberian Winter Ahead - Daily Express, 28 October 2013 3) David Whitehouse: Cold Winters, Hot News - The Global Warming Policy Foundation, 30 October 2013 4) New Paper: Solar Quiet Spells Can Trigger Little Ice Age - The Register, 1 October 2013 5) Sun’s Bizarre Activity May Trigger Another Little Ice Age (Or Not) - The Irish Times, 12 July 2013 6) Solar Activity Drops To 100-Year Low, Puzzling Scientists - MINA News, 19 September 2013 7) Atlantic Hurricane Season Quietest In 45 Years, Experts Say - Reuters, 25 October 2013 |
Showing posts sorted by relevance for query little ice age. Sort by date Show all posts
Showing posts sorted by relevance for query little ice age. Sort by date Show all posts
Wednesday, October 30, 2013
Growing Risk Of A Maunder Minimum 'Little Ice Age'?
From today's Global Warming Policy Foundation newsletter:
Wednesday, December 21, 2011
Chilling Thoughts For Global-Warming Alarmists
By James Taylor, 12.05.11, Forbes.com
The central issues in the global warming debate have little to do with whether or not temperatures have warmed during the past century. Nearly all scientists agree that temperatures have indeed warmed during the past 100 years, just as they have warmed (and cooled) many times in previous centuries. The more important issues are whether current temperatures are abnormally warm in a longer-term perspective and whether present warming trends threaten disaster in the foreseeable future.
The first principle to keep in mind is context. While it is true that global temperatures have risen somewhat during the past 100-plus years since the Little Ice Age ended, there was little room for temperatures to go at the time but up. The Little Ice Age, lasting from approximately A.D. 1300 to 1900, brought the planet’s coldest extended temperatures during the last 10,000 years. Saying that temperatures have risen by one degree or so since the end of the Little Ice Age tells us little about the long-term temperature context because the arbitrary baseline of the Little Ice Age was an exceptionally cold climate anomaly.
Keeping this long-term temperature context in mind, we often hear that a given month, year or decade was "the hottest in recorded history," but that statement only holds true when "recorded history" is defined as the past 130 years or so since the depths of the Little Ice Age. Proponents of a global warming crisis justify this convenient definition of "recorded history" based on the establishment of a relatively global system of weather and temperature stations approximately 130 years ago. Fair enough, but proxy climate data from a variety of sources, including ice cores drilled in the Greenland and Antarctic ice sheets, show that global temperatures were warmer for most of the past 10,000 years than they are today. Hu - man civilization first developed, and then thrived, during climate conditions warmer than today. Today’s temperatures, in a more appropriate long-term context, are unusually cold, not hot.
The second principle to remember is that the Earth’s long-term temperature history gives us proof that warmer temperatures have in the real world always been better for human civilization than colder ones. The Little Ice Age was typified by crop failures, famines, plagues, extreme weather events and human population contractions. By contrast, our recently warming temperatures have been a welcome reprieve from the harsh and unusually cold conditions of the Little Ice Age. During the past century as global temperatures have risen, forests have expanded, deserts have retreated, soil moisture has improved, crops have flourished and extreme weather events such as hurricanes and tornadoes have become less frequent.
While our ability to document the frequency of famines, plagues, droughts, hurricanes, etc. is more limited for the millennia before the Little Ice Age, we do know that during these warmer millennia human civilization thrived and the planet’s climate was not thrown into a chaotic downward spiral. Indeed, the Earth’s climate remains quite benign despite these thousands of years of recent warmer temperatures.
This gets to the heart of the global warming debate. If we have real-world evidence that temperatures were warmer during most of the past 10,000 years (and also during several interglacial warm periods over the past few million years) than they are today and if we also have real-world evidence that human civilization thrived during these warmer periods and the warmer temperatures did not trigger so-called "tipping points," sending the planet into a climate catastrophe, then we have little reason to believe our present and moderately warming temperatures are poised to cause a climate catastrophe.
For many scientists this distinction between theory and real-world conditions is what typifies the differences between so-called "alarmists" and "skeptics." As Colorado State University emeritus professor and hurricane expert William Gray frequently explains, alarmists base their climate alarmism on speculative computer models programmed and run within the confines of cubicles and drywall. Skeptics, on the other hand, base their skepticism on real-world data and observations.
Proponents of an imminent global warming crisis may present interesting theories about catastrophes that may occur if the Earth returns to the warmer temperatures that predominated during most of the past 10,000 years, but such theories are strongly contradicted by thousands of years of real-world data and real-world climate observations. The scientific method dictates that realworld observations trump speculative theory, not the other way around.
JAMES TAYLOR IS SENIOR FELLOW FOR ENVIRONMENT POLICY AT THE HEARTLAND INSTITUTE AND MANAGING EDITOR OF ENVIRONMENT & CLIMATE NEWS.
Monday, March 9, 2015
Dr. Soon's latest paper on natural climate variability published in Nature Geoscience
A paper published today in the journal Nature Geoscience studies changes in the intertropical convergence zone (ITCZ) over the western Pacific during the Little Ice Age. The paper is co-authored by skeptics Willie Soon and Robert M. Carter, and is yet another example of the high quality, peer-reviewed work on natural climate variability and potential solar-climate relationships being published in highly respected journals by CAGW skeptics such as Dr. Soon.
Unable to attack on a scientific basis anything Dr. Soon has published in peer-reviewed journals, smear-mongerer Gavin Schmidt of NASA/GISS instead told the NYT, “The science that Willie Soon does is almost pointless.” Schmidt thus claims it is "pointless" to study natural variability, solar-climate relationships, and hundreds of potential solar amplification mechanisms published in the peer-reviewed literature, effectively because Schmidt & his falsified climate models have already made their mind up that man-made CO2 is the climate control knob & the sun plays a "pointless" role in climate.

Note: Other papers have linked shifts in the ITCZ to solar activity and the bipolar seesaw theory of (natural) climate change.
UPDATE:
Related posts:
Yes, the sun (was) driving global warming
The Sun explains 95% of climate change over the past 400 years; CO2 had no significant influence
Climate Modeling: Ocean Oscillations + Solar Activity R²=.96
Analysis: Solar activity & ocean cycles are the 2 primary drivers of climate, not CO2
Analysis shows accumulated solar energy explains 20th century global warming; no significant effect of CO2
The Time-Integral of Solar Activity explains Global Temperatures 1610-2012, not CO2
Natural Climate Change has been Hiding in Plain Sight
New paper confirms the Sun was particularly active during the latter 20th century
Global warming made simple: How natural variability explains 20th century global warming without man-made CO2
Sunspot Integral v. Temperature
The Sun can't possibly explain global warming
New paper finds recent Grand Maximum of solar activity was 'rare or even unique event' in 3,000 years
New paper finds up to 72% of temperature increase over past 150 years due to the Sun
Unable to attack on a scientific basis anything Dr. Soon has published in peer-reviewed journals, smear-mongerer Gavin Schmidt of NASA/GISS instead told the NYT, “The science that Willie Soon does is almost pointless.” Schmidt thus claims it is "pointless" to study natural variability, solar-climate relationships, and hundreds of potential solar amplification mechanisms published in the peer-reviewed literature, effectively because Schmidt & his falsified climate models have already made their mind up that man-made CO2 is the climate control knob & the sun plays a "pointless" role in climate.
Note: Other papers have linked shifts in the ITCZ to solar activity and the bipolar seesaw theory of (natural) climate change.
UPDATE:
Fingerprints of the Sun on Asia-Australia Summer Monsoon Rainfalls during the Little Ice Age
author: source: Time: 2015-03-10
A new paper has been published in Nature Geoscience entitled ‘Dynamics of the intertropical convergence zone over the western Pacific during the Little Ice Age ’ by Hong Yan of the Institute of Earth Environment, Chinese Academy of Sciences and an international team of co-authors from the Alfred Wegener Institute (Wei Wei), Harvard-Smithsonian Center for Astrophysics (Willie Soon), Institute of Earth Environment (Zhisheng An, Weijian Zhou and Yuhong Wang), University of Hong Kong (Zhonghui Liu) and Institute of Public Affairs (Robert M. Carter). The results of the research indicate that both the East Asia Summer Monsoon and the Northern Australia Summer Monsoon retreated synchronously during the recent cold Little Ice Age in response to external forcings such as solar irradiance variation and possibly large volcanic eruptions.
The Asia-Australia monsoon covers the world’s most populated areas, and therefore understanding the factors that control monsoon-belt climatic variation through time is important for response-planning for healthy social-economic development for the globe. Many previous studies have focused on the past climate changes in the Asia-Australia monsoon area, often proposing that the western Pacific Intertropical Convergence Zone (ITCZ) or the associated rainbelt should have migrated southward during cold climate episodes, such as the Little Ice Age (AD 1400-1850). Such migrations should be associated with the occurrence of a weaker East Asian Summer Monsoon and a stronger Australian Summer Monsoon, with opposing rainfall variations between the two hemispheres.
However, hydrological records from the Asia-Australia summer monsoon area, analysed by Professor Hong Yan and his coauthors, show that southward migration of the ITCZ did not occur during the cold Little Ice Age. Instead, the hydrological data support the operation of a new dynamic mechanism named ‘ITCZ/Rainbelt contraction’ in the Western Pacific region during the Little Ice Age.
Prima facie, a southward migration of the ITCZ should result in less precipitation in the East Asia Summer Monsoon area but more rainfall in Australia Summer Monsoon area. In contrast, the Synthesis of a large set of palaeoclimatological records from across the monsoonal area establishes that the precipitation in both continental East Asia and northern Australia decreased synchronously during the Little Ice Age. The unusual spatial variation in paleoclimate records therefore documents a distinctly different rainfall pattern that violates the former expectation of ITCZ southward migration. Furthermore, comparison of these results with solar records indicates that a relationship exists between the rainfall changes and Total Solar Insolation.
To explain these changes, the scientists propose an alternative dynamic scenario which they have tested using process-based climate modeling. Rather than strict north-south migration, the multi-decadal to centennial change for the western Pacific Intertropical Convergence Zone can excitingly be shown to have contracted or expanded in parallel with solar irradiance variations. This new understanding clearly adds to the richness of mechanisms by which the Earth climate system can vary naturally and significantly over periods between a few decades and up to a century in length.
Pattern of rainfall within the East Asia Summer Monsoon (left) and Australia Summer Monsoon (right) area during the LIA. Locations of proxy-hydrology records in the Asia-Australia monsoon area are indicated. Locations that were dry, without apparent change and wet during the LIA are marked in red, purple and blue, respectively. The decreased rainfall in East Asia continent and northern Australia suggested the synchronous retreat of the East Asian Summer Monsoon and the Australian Summer Monsoon during the Little Ice Age (Image by Dr YAN Hong).
Related posts:
Yes, the sun (was) driving global warming
The Sun explains 95% of climate change over the past 400 years; CO2 had no significant influence
Climate Modeling: Ocean Oscillations + Solar Activity R²=.96
Analysis: Solar activity & ocean cycles are the 2 primary drivers of climate, not CO2
Analysis shows accumulated solar energy explains 20th century global warming; no significant effect of CO2
The Time-Integral of Solar Activity explains Global Temperatures 1610-2012, not CO2
Natural Climate Change has been Hiding in Plain Sight
New paper confirms the Sun was particularly active during the latter 20th century
Global warming made simple: How natural variability explains 20th century global warming without man-made CO2
Sunspot Integral v. Temperature
The Sun can't possibly explain global warming
New paper finds recent Grand Maximum of solar activity was 'rare or even unique event' in 3,000 years
New paper finds up to 72% of temperature increase over past 150 years due to the Sun
Tuesday, December 18, 2012
Another day, another non-hockey-stick
A paper published today in Quaternary Research reconstructs June-July air temperature over the past 785 years in British Columbia, Canada. The paper shows that reconstructed temperatures at the end of the record in 2010 were colder than in the 1940's and during at least 6 other periods within the Little Ice Age from 1350-1850 AD. The temperature record shows there is nothing unusual, unnatural, unprecedented, or accelerated about the 20th and 21st centuries.
 |
| Top graph shows reconstructed temperatures from 1225-2010. The reconstructed temperatures of 2010 have been exceeded many times over the past 785 years, even during the Little Ice Age |
Tree-ring derived Little Ice Age temperature trends from the central British Columbia Coast Mountains, Canada


- University of Victoria Tree-Ring Laboratory, Department of Geography, University of Victoria, Victoria, British Columbia, Canada V8W 3R4
Abstract
Most glaciers in the British Columbia Coast Mountains reached their maximum Holocene extent during the Little Ice Age. Early- and late-Little Ice Age intervals of expansion and retreat fluctuations describe a mass-balance response to changing climates. Although existing dendroclimatic records provide insights into these climatic fluctuations over the last 400 yr, their short durations prohibit evaluation of early-Little Ice Age climate variability. To extend the duration of these records, submerged coarse woody debris salvaged from a high-elevation lake was cross-dated to living chronologies. The resulting chronology provides the opportunity to reconstruct a regional June–July air-temperature anomaly record extending from AD 1225 to 2010. The reconstruction shows that the intervals AD 1350–1420, 1475–1550, 1625–1700 and 1830–1940 characterized distinct periods of below-average June–July temperature followed by periods of above-average temperature. Our reconstruction provides the first annually resolved insights into high-elevation climates spanning the Little Ice Age in this region and indicates that Little Ice Age moraine stabilization corresponds to persistent intervals of warmer-than-average temperatures. We conclude that coarse woody debris submerged in high-elevation lakes has considerable potential for developing lengthy proxy climate records, and we recommend that researchers focus attention on this largely ignored paleoclimatic archive.
Tuesday, May 8, 2012
New paper confirms Little Ice Age was a global phenomenon, related to solar activity
A paper published today in Geophysical Research Letters confirms that "the Little Ice Age was a global event, probably caused by a change in solar [activity] and volcanic forcing [activity]." The paper finds that Greenland and Antarctica cooled synchronously, although to different magnitudes, suggesting to the authors that climate feedbacks operate differently in the Northern and Southern Hemispheres. The Little Ice Age was associated with the Maunder Minimum, a lull in solar activity that may be similar to the present. This paper corroborates other recent research showing that the Little Ice Age was a global, not local, phenomenon. According to the paper, the temperature from 1400-1800 AD in Antarctica was on average ~ 0.52C colder and Greenland ~ 1C colder than than the last 100 year average. This would imply that the 0.7C global warming since 1850 simply represents a recovery from the Little Ice Age.
GEOPHYSICAL RESEARCH LETTERS, VOL. 39, L09710, 7 PP., 2012
doi:10.1029/2012GL051260
doi:10.1029/2012GL051260
Key Points
- Cold interval from 1300 to 1800 C.E. at WAIS Divide
- The 1400-1800 C.E. was 0.52+/-0.28 deg C colder than the last 100 years
- Cooling broadly synchronous to Greenland cooling, with lesser amplitude
Scripps Institution of Oceanography, University of California, San Diego, La Jolla, California, USA
Scripps Institution of Oceanography, University of California, San Diego, La Jolla, California, USA
Scripps Institution of Oceanography, University of California, San Diego, La Jolla, California, USA
The largest climate anomaly of the last 1000 years in the Northern Hemisphere was the Little Ice Age (LIA) from 1400–1850 C.E., but little is known about the signature of this event in the Southern Hemisphere, especially in Antarctica. We present temperature data from a 300 m borehole at the West Antarctic Ice Sheet (WAIS) Divide. Results show that WAIS Divide was colder than the last 1000-year average from 1300 to 1800 C.E. The temperature in the time period 1400–1800 C.E. was on average 0.52 ± 0.28°C colder than the last 100-year average. This amplitude is about half of that seen at Greenland Summit (GRIP). This result is consistent with the idea that the LIA was a global event, probably caused by a change in solar and volcanic forcing, and was not simply a seesaw-type redistribution of heat between the hemispheres as would be predicted by some ocean-circulation hypotheses. The difference in the magnitude of the LIA between Greenland and West Antarctica suggests that the feedbacks amplifying the radiative forcing may not operate in the same way in both regions.
Wednesday, September 19, 2012
New paper shows Canadian temperatures as warm or warmer than the present many times over past 785 years
A paper published today in Quaternary Research reconstructs June-July temperature trends from the British Columbia Coast Mountains in Canada over the past 785 years from 1225-2010. The paper shows temperatures were as warm or warmer than the present [2010] during many periods in the past including around ~ 1240, 1270, 1310, 1340, 1400, 1460, 1500, 1550, 1590, 1660, 1670, 1710, 1820, and 1930-1940.
Tree-ring derived Little Ice Age temperature trends from the central British Columbia Coast Mountains, Canada
Kara J. Pitman, Dan J. Smith
Most glaciers in the British Columbia Coast Mountains reached their maximum Holocene extent during the Little Ice Age. Early- and late-Little Ice Age intervals of expansion and retreat fluctuations describe a mass-balance response to changing climates. Although existing dendroclimatic records provide insights into these climatic fluctuations over the last 400yr, their short durations prohibit evaluation of early-Little Ice Age climate variability. To extend the duration of these records, submerged coarse woody debris salvaged from a high-elevation lake was cross-dated to living chronologies. The resulting chronology provides the opportunity to reconstruct a regional June–July air-temperature anomaly record extending from AD1225 to 2010. The reconstruction shows that the intervals AD1350–1420, 1475–1550, 1625–1700 and 1830–1940 characterized distinct periods of below-average June–July temperature followed by periods of above-average temperature. Our reconstruction provides the first annually resolved insights into high-elevation climates spanning the Little Ice Age in this region and indicates that Little Ice Age moraine stabilization corresponds to persistent intervals of warmer-than-average temperatures. We conclude that coarse woody debris submerged in high-elevation lakes has considerable potential for developing lengthy proxy climate records, and we recommend that researchers focus attention on this largely ignored paleoclimatic archive.
 |
| Reconstructed June-July temperature anomalies from 1225-2010 from Fig. 6 below. Added red line shows temperature anomaly at the end of the record in 2010. |
|
Figure 6. Reconstruction of air temperature anomaly ring-width variability AD 1225–2010. (a) June–July air temperature anomaly reconstruction. Gray lines represent annual reconstruction indices and the black line shows a 10-yr weighted running mean. (b) Wavelet power spectrum of extended tree-ring chronology. Cross-hatched regions represent the cone of influence where zero-padding of the data was used to reduce variance using a Marlet-2 function. Black contours indicate significant modes of variance with a 5% significance level using an autoregressive lag-1 red-noise background spectrum (Torrence and Compo, 1998).
|
 |
| Figure 7. Normalized air-temperature tree-ring reconstruction smoothed with a 25-yr spline. Vertical bars represent the number (50-yr increments) of dated central Coast Mountain Little Ice Age moraines reported by Smith and Desloges (2000), Larocque and Smith (2003) and Harvey and Smith (in press) in accordance with air-temperature trends. |
Tree-ring derived Little Ice Age temperature trends from the central British Columbia Coast Mountains, Canada
Source:Quaternary Research
Kara J. Pitman, Dan J. Smith
Most glaciers in the British Columbia Coast Mountains reached their maximum Holocene extent during the Little Ice Age. Early- and late-Little Ice Age intervals of expansion and retreat fluctuations describe a mass-balance response to changing climates. Although existing dendroclimatic records provide insights into these climatic fluctuations over the last 400yr, their short durations prohibit evaluation of early-Little Ice Age climate variability. To extend the duration of these records, submerged coarse woody debris salvaged from a high-elevation lake was cross-dated to living chronologies. The resulting chronology provides the opportunity to reconstruct a regional June–July air-temperature anomaly record extending from AD1225 to 2010. The reconstruction shows that the intervals AD1350–1420, 1475–1550, 1625–1700 and 1830–1940 characterized distinct periods of below-average June–July temperature followed by periods of above-average temperature. Our reconstruction provides the first annually resolved insights into high-elevation climates spanning the Little Ice Age in this region and indicates that Little Ice Age moraine stabilization corresponds to persistent intervals of warmer-than-average temperatures. We conclude that coarse woody debris submerged in high-elevation lakes has considerable potential for developing lengthy proxy climate records, and we recommend that researchers focus attention on this largely ignored paleoclimatic archive.
Monday, November 4, 2013
What is happening to the oceans?
WHAT IS HAPPENING TO THE OCEANS?
Click on image to enlarge.
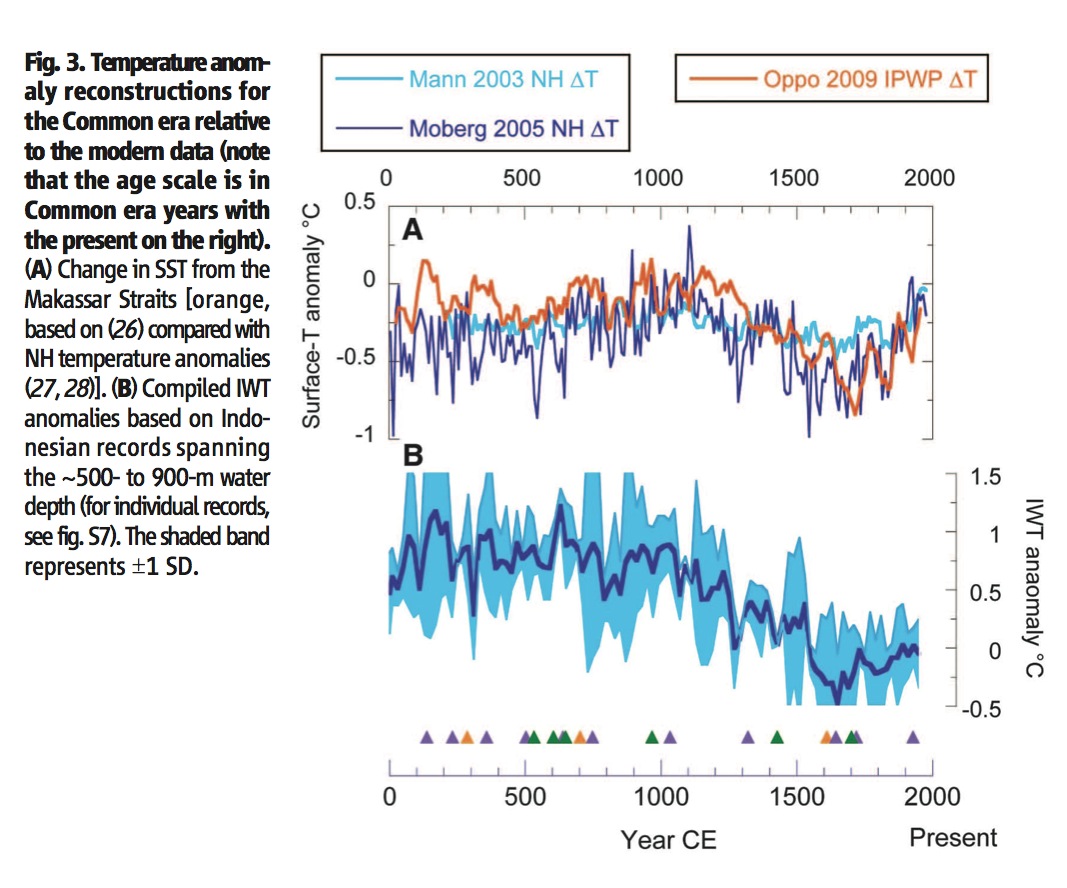
New research carried out by and published in the journal Science (University press release) is providing fascinating new insights about how the heat content of the oceans have been changing over the last few thousand years, as well as providing yet more evidence that the Medieval Warm Period and the Little Ice Age were global and not regional events.
The research involves looking for proxy historical data for the temperature of a region of the Pacific in Indonesia. This is regarded as an important stretch of water because it acts as a crossroads between extensive water masses from the northern and southern hemispheres and as such measurements made in one locale represent a much larger volume of ocean.
The work builds on the paper by Oppo et al (2009) in Nature (and see here) that studied the so-called Pacific Warm Pool – the greatest collection of warm water on Earth – and found evidence of the global extent of the Medieval Warm Period and the Little Ice Age.
Understanding how the heat content of the oceans is vital to understanding global climate change. It is believed that most – 90% – of the energy from the Earth’s energy imbalance due to man-made fossil fuels goes into the oceans and not the surface. Hence some scientists have been looking to the ocean depths to find where the energy has gone during the remarkable 16-year long pause in surface temperatures.
The current researchers looked at the isotopic signature (magnesium calcium ratio) found in the remains of shells of a certain species of marine animal – hyalinea balthica. Click on image to enlarge.
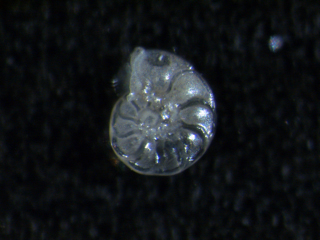
From studies of deposition rates they were able to provide proxy estimates of ocean temperature for various depths for the past 10,000 years – the Holocene.
The top line from this research is that it provides further evidence that the Medieval Warm Period and the Little Ice Age were not events confined to small areas but were global events.
This work also comes to other fascinating conclusions. The temperature of intermediate ocean layers, between 500 and 1000 metres, has in general declined in the last 10,000 years from the early Holocene when ocean temperatures were about 2 deg C higher than they are today. The authors also suggest that the rate of change of ocean heat content (OHC) is greater today than it has been for the past 10,000 years – a claim I will look at more closely.
The problem with the suggestion that OHC is rising faster now than at any time in the Holocene is, as the authors admit, that they have only century-scale resolution of ocean changes in the past. It is possible that similar warming rates were occurring in the past but one cannot say for certain because the ‘signal’ from the deep ocean would be averaged and smoothed over century long periods making it unlikely that changes of decades would appear in the data.
Another interesting point is that this study seems to compliment the data obtained by Marcott et al (2013), or at least the part of Marcott’s data that refers to the Holocene and not the recent data that was tagged onto his dataset. The surprising thing is that Marcott showed fairly steady (slowly declining) land temperatures throughout the Holocene whilst the current study shows deep ocean cooling.
Writing in the Huffington Post Professor Michael Mann – whose ‘hockey stick’ research once eliminated the Medieval Warm Period and the Little Ice Age – considers the scope and limitations of the research. Mann cites the PAGES 2k consortium finding published earlier this year in Nature Geoscience that finds little evidence for a global Medieval Warm Period and Little Ice Age. Mann’s criticisms make for interesting reading and shows that such research is not as settled as many would conclude after reading media reports, especially those who do little more than reproduce the headline in the hyped press release accompanying this research. At the forefront of research into ocean temperatures and heat content there are more questions than answers.
Ten thousand years ago it seems that the OHC was much larger than it is today, and it was declining. During the Medieval Warm Period it was much larger than today (though curiously the ocean temperature was not that much higher) but only a few centuries later – the Little Ice Age of the 17th century – OHC was substantially lower than today. Click on image to enlarge.
Since then OHC has increased but from a very low base, so that even today it is still below general Holocene levels. Fitting these observations into an anthropogenic scheme will be interesting. Looking at the OHC data from the past two centuries one must ask the question: what is anthropogenic and what is due to the recovery from the Little Ice Age?
Related:
New paper finds Pacific Ocean has been significantly warmer than the present throughout vast majority of past 10,000 years
Thursday, August 22, 2013
Review finds the Medieval Warming Period in the Arctic was warmer than the present
A new review by Dr. Craig Idso of the peer-reviewed literature on the Medieval Warm Period in the Arctic concludes, "It is clear that the suite of measurements described in the studies reviewed above continues to indicate that the Arctic - which climate models suggest should be super-sensitive to greenhouse-gas-induced warming - is still not even as warm as it was several centuries ago during portions of the Medieval Warm Period, when there was much less CO2 and methane in the air than there is today, which facts further suggest that the planet's more modest current warmth need not be the result of historical increases in these two trace greenhouse gases."
Medieval Warm Period (Arctic) -- Summary
This review begins with the study of Dahl-Jensen et al. (1998), who used temperature measurements from two Greenland Ice Sheet boreholes to reconstruct the temperature history of this portion of the earth over the past 50,000 years. Their data indicated that after the termination of the glacial period, temperatures steadily rose to a maximum of 2.5°C warmer than at present during the Holocene Climatic Optimum (4,000 to 7,000 years ago). The Medieval Warm Period (MWP) and Little Ice Age (LIA) were also observed in the record, with temperatures 1°C warmer and 0.5-0.7°C cooler than at the time of their writing, respectively. After the Little Ice Age, they report that temperatures once again rose, but that they had "decreased during the last decades," thereby indicating that the MWP in this part of the Arctic was significantly warmer than it was just before the turn of the century.Wagner and Melles (2001) also worked on Greenland, where they extracted a 3.5-m-long sediment core from a lake (Raffels So) on an island (Raffles O) located just off Liverpool Land on the east coast of Greenland, which they analyzed for a number of properties related to the past presence of seabirds there, obtaining a 10,000-year record that tells much about the region's climatic history. Key to the study were biogeochemical data, which, in the words of the two researchers, reflect "variations in seabird breeding colonies in the catchment which influence nutrient and cadmium supply to the lake."
These data revealed sharp increases in the values of the parameters they represented between about 1100 and 700 years before present (BP), indicative of the summer presence of significant numbers of seabirds during that "medieval warm period," as Wagner and Melles described it, which had been preceded by a several-hundred-year period (the Dark Ages Cold Period) with little to no bird presence. And after that "medieval warm period," their data suggested another absence of birds during what they called "a subsequent Little Ice Age," which they said was "the coldest period since the early Holocene in East Greenland."
The Raffels So data also showed signs of a resettlement of seabirds during the last century, as indicated by an increase of organic matter in the lake sediment and confirmed by bird counts. However, values of the most recent measurements of seabird numbers were not as great as those inferred for the earlier Medieval Warm Period, which result indicates that higher temperatures prevailed during much of the period from 1100 to 700 years BP than those that had been observed over the most recent hundred years.
A third Greenland study was conducted by Kaplan et al. (2002), who derived a climatic history of the Holocene by analyzing the physical-chemical properties of sediments obtained from a small lake in the southern sector of Greenland. This work revealed that the interval from 6000 to 3000 years BP was marked by warmth and stability, but that the climate cooled thereafter until its culmination in the Little Ice Age. From 1300-900 years BP, however, there was a partial amelioration during the Medieval Warm Period, which was associated with an approximate 1.5°C rise in temperature.
In a non-Greenland Arctic study, Jiang et al. (2002) analyzed diatom assemblages from a high-resolution core extracted from the seabed of the north Icelandic shelf, which led to their reconstruction of a 4600-year history of summer sea surface temperature at that location. Starting from a maximum value of about 8.1°C at 4400 years BP, the climate was found to have cooled fitfully for about 1700 years and then more consistently over the final 2700 years of the record. The most dramatic departure from this long-term decline was centered on about 850 years BP, during the Medieval Warm Period, when the temperature rose by more than 1°C above the line describing the long-term downward trend to effect an almost complete recovery from the colder temperatures of the Dark Ages Cold Period, after which temperatures continued their descent into the Little Ice Age, ending with a final most recent value of approximately 6.3°C. Hence, their data clearly showed that the Medieval Warm Period in this part of the Arctic was significantly warmer than it is there now.
Moving on, Moore et al. (2001) analyzed sediment cores from Donard Lake, Baffin Island, Canada, producing a 1240-year record of average summer temperatures for this Arctic region. Over the entire period from AD 750-1990, temperatures averaged 2.9°C. However, anomalously warm decades with summer temperatures as high as 4°C occurred around AD 1000 and 1100, while at the beginning of the 13th century, Donard Lake witnessed "one of the largest climatic transitions in over a millennium," as "average summer temperatures rose rapidly by nearly 2°C from 1195-1220 AD, ending in the warmest decade in the record" with temperatures near 4.5°C.
This rapid warming of the 13th century was followed by a period of extended warmth that lasted until an abrupt cooling event occurred around 1375, which made the following decade one of the coldest in the record. This event signaled the onset of the Little Ice Age, which lasted for 400 years, until a gradual warming trend began around 1800, which was followed by a dramatic cooling event in 1900 that brought temperatures back to levels similar to those of the Little Ice Age. This cold regime lasted until about 1950, whereupon temperatures warmed for about two decades but then tended downwards again, all the way to the end of the record in 1990. Thus, in this part of the Arctic, the Medieval Warm Period was also warmer than it is there currently.
The following year, Grudd et al. (2002) assembled tree-ring widths from 880 living, dead, and subfossil northern Swedish pines into a continuous and precisely dated chronology covering the period 5407 BC to AD 1997. The strong association between these data and summer (June-August) mean temperatures of the last 129 years of the period then enabled them to produce a 7400-year history of summer mean temperature for northern Swedish Lapland. The most dependable portion of this record, based upon the number of trees that were sampled, consisted of the last two millennia, which Grudd et al. said "display features of century-timescale climatic variation known from other proxy and historical sources, including a warm 'Roman' period in the first centuries AD and a generally cold 'Dark Ages' climate from about AD 500 to about AD 900." They also noted that "the warm period around AD 1000 may correspond to a so-called 'Mediaeval Warm Period,' known from a variety of historical sources and other proxy records." Last of all, they stated that "the climatic deterioration in the twelfth century can be regarded as the starting point of a prolonged cold period that continued to the first decade of the twentieth century," which "Little Ice Age," in their words, is also "known from instrumental, historical and proxy records." Going back even further in time, the tree-ring record displays several more of these relatively warmer and colder periods. And in a telling commentary on current climate-alarmist claims, they report that "the relatively warm conditions of the late twentieth century do not exceed those reconstructed for several earlier time intervals." In fact, the warmth of many of the earlier warm intervals significantly exceeded the warmth of the late 20th century.
Seppa and Birks (2002) used a recently developed pollen-climate reconstruction model and a new pollen stratigraphy from Toskaljavri - a tree-line lake in the continental sector of northern Fenoscandia (located just above 69°N latitude) - to derive quantitative estimates of annual precipitation and July mean temperature. And as they described it, their reconstructions "agree with the traditional concept of a 'Medieval Warm Period' (MWP) and 'Little Ice Age' in the North Atlantic region (Dansgaard et al., 1975) and in northern Fennoscandia (Korhola et al., 2000)." In addition, they reported there was "a clear correlation between [their] MWP reconstruction and several records from Greenland ice cores," and that "comparisons of a smoothed July temperature record from Toskaljavri with measured borehole temperatures of the GRIP and Dye 3 ice cores (Dahl-Jensen et al., 1998) and the ð18O record from the Crete ice core (Dansgaard et al., 1975) show the strong similarity in timing of the MWP between the records." Last of all, they noted that "July temperature values during the Medieval Warm Period (ca. 1400-1000 cal yr B.P.) were ca. 0.8°C higher than at present," where present means the last six decades of the 20th century.
Noting that temperature changes in high latitudes are (1) sensitive indicators of global temperature changes, and that they can (2) serve as a basis for verifying climate model calculations, Naurzbaev et al. (2002) developed a 2,427-year proxy temperature history for the part of the Taimyr Peninsula of northern Russia that lies between 70°30' and 72°28' North latitude, based on a study of ring-widths of living and preserved larch trees, while further noting that "it has been established that the main driver of tree-ring variability at the polar timber-line [where they conducted their study] is temperature (Vaganov et al., 1996; Briffa et al., 1998; Schweingruber and Briffa, 1996)." And in doing so, they found that "the warmest periods over the last two millennia in this region were clearly in the third [Roman Warm Period], tenth to twelfth [Medieval Warm Period] and during the twentieth [Current Warm Period] centuries."
With respect to the second of these periods, they emphasize that "the warmth of the two centuries AD 1058-1157 and 950-1049 attests to the reality of relative mediaeval warmth in this region." Their data also reveal three other important pieces of information: (1) the Roman and Medieval Warm Periods were both warmer than the Current Warm Period has been to date, (2) the "beginning of the end" of the Little Ice Age was somewhere in the vicinity of 1830, and (3) the Current Warm Period peaked somewhere in the vicinity of 1940.
All of these observations are at odds with what is portrayed in the thousand-year Northern Hemispheric hockeystick temperature history of Mann et al. (1998, 1999) and its thousand-year global extension developed by Mann and Jones (2003), wherein (1) the Current Warm Period is depicted as the warmest such era of the past two millennia, (2) recovery from the Little Ice Age does not begin until after 1910, and (3) the Current Warm Period experiences it highest temperatures in the latter part of the 20th century's final decade.
Advancing two years closer to the present, Knudsen et al. (2004) documented climatic changes over the last 1200 years by means of high-resolution multi-proxy studies of benthic and planktonic foraminiferal assemblages, stable isotopes, and ice-rafted debris found in three sediment cores retrieved from the North Icelandic shelf. This work revealed that "the time period between 1200 and around 7-800 cal. (years) BP, including the Medieval Warm Period, was characterized by relatively high bottom and surface water temperatures," after which "a general temperature decrease in the area marks the transition to ... the Little Ice Age." They also note that "minimum sea-surface temperatures were reached at around 350 cal. BP, when very cold conditions were indicated by several proxies." Thereafter, they report that "a modern warming of surface waters ... is not registered in the proxy data," and that "there is no clear indication of warming of water masses in the area during the last decades," even in sea surface temperatures measured over the period 1948-2002.
Fast-forwarding another two years,Grinsted et al. (2006) developed "a model of chemical fractionation in ice based on differing elution rates for pairs of ions ... as a proxy for summer melt (1130-1990)," based on data obtained from a 121-meter-long ice core they extracted from the highest ice field in Svalbard (Lomonosovfonna: 78°51'53"N, 17°25'30"E), which was "validated against twentieth-century instrumental records and longer historical climate proxies." This history indicated that "in the oldest part of the core (1130-1200), the washout indices [were] more than 4 times as high as those seen during the last century, indicating a high degree of runoff." In addition, they said they had performed regular snow pit studies near the ice core site since 1997 (Virkkunen, 2004) and that "the very warm 2001 summer resulted in similar loss of ions and washout ratios as the earliest part of the core." They then stated that "this suggests that the Medieval Warm Period in Svalbard summer conditions [was] as warm (or warmer) as present-day, consistent with the Northern Hemisphere temperature reconstruction of Moberg et al. (2005)." In addition, they concluded that "the degree of summer melt was significantly larger during the period 1130-1300 than in the 1990s," which likewise suggests that a large portion of the Medieval Warm Period was significantly warmer than the peak warmth (1990s) of the Current Warm Period.
Moving ahead two more years, Besonen et al. (2008) derived thousand-year histories of varve thickness and sedimentation accumulation rate for Canada's Lower Murray Lake (81°20'N, 69°30'W), which is typically covered for about eleven months of each year by ice that reaches a thickness of 1.5 to 2 meters at the end of each winter. With respect to these parameters, they write - citing seven other studies - that "field-work on other High Arctic lakes clearly indicates that sediment transport and varve thickness are related to temperatures during the short summer season that prevails in this region, and we have no reason to think that this is not the case for Lower Murray Lake."
So what did they find? As the six scientists describe it, the story told by both the varve thickness and sediment accumulation rate histories of Lower Murray Lake is that "the twelfth and thirteenth centuries were relatively warm," and in this regard we note their data indicate that Lower Murray Lake and its environs were often much warmer during this time period (AD 1080-1320) than they were at any point in the 20th century, which has also been shown to be the case for Donard Lake (66.25°N, 62°W) by Moore et al. (2001).
Working concurrently on a floating platform in the middle of a small lake (Hjort So) on an 80-km-long by 10.5-km-wide island (Store Koldewey) just off the coast of Northeast Greenland, Wagner et al. (2008) recovered two sediment cores of 70 and 252 cm length, the incremental portions of which they analyzed for grain-size distribution, macrofossils, pollen, diatoms, total carbon, total organic carbon, and several other parameters, the sequences of which were dated by accelerator mass spectrometry, with radiocarbon ages translated into calendar years before present. This work revealed, as they describe it, an "increase of the productivity-indicating proxies around 1,500-1,000 cal year BP, corresponding with the medieval warming," while adding that "after the medieval warming, renewed cooling is reflected in decreasing amounts of total organic carbon, total diatom abundance, and other organisms, and a higher abundance of oligotrophic to meso-oligotrophic diatom taxa." And, as they continue, "this period, the Little Ice Age, was the culmination of cool conditions during the Holocene and is documented in many other records from East and Northeast Greenland, before the onset of the recent warming [that] started ca. 150 years ago."
In addition to the obvious importance of their finding evidence for the Medieval Warm Period, the six researchers' statement that the Little Ice Age was the culmination, or most extreme sub-set, of cool conditions during the Holocene, suggests that it would not be at all unusual for such a descent into extreme coolness to be followed by some extreme warming, which further suggests there is nothing unusual about the degree of subsequent warming experienced over the 20th century, especially in light of the fact that the earth has not yet achieved the degree of warmth that held sway over most of the planet throughout large portions of that prior high-temperature period.
One year later, based on the use of a novel biomarker (IP25), which they described as a mono-unsaturated highly-branched isoprenoid that is synthesized by sea ice diatoms that have been shown to be stable in sediments below Arctic sea ice, Vareet al. (2009) used this new climatic reconstruction tool - together with "proxy data obtained from analysis of other organic biomarkers, stable isotope composition of bulk organic matter, benthic foraminifera, particle size distributions and ratios of inorganic elements" - to develop a spring sea ice record for that part of the central Canadian Arctic Archipelago. And in doing so, they discovered evidence for a decrease in spring sea ice between approximately 1200 and 800 years before present (BP), which they associated with "the so-called Mediaeval Warm Period."
Contemporaneously, Norgaard-Pedersen and Mikkelsen (2009), working with a sediment core retrieved in August 2006 from the deepest basin of Narsaq Sound in southern Greenland, analyzed several properties of the materials thus obtained from which they were able to infer various "glacio-marine environmental and climatic changes" that had occurred over the prior 8,000 years. This work revealed the existence of two periods (2.3-1.5 ka and 1.2-0.8 ka) that appeared to coincide roughly with the Roman and Medieval Warm Periods, while they identified the colder period that followed the Medieval Warm Period as the Little Ice Age and the colder period that preceded it as the Dark Ages Cold Period. And citing the works of Dahl-Jensen et al. (1998), Andresen et al. (2004), Jensen et al. (2004) and Lassen et al. (2004), the two Danish scientists said that the cold and warm periods identified in those researchers' studies "appear to be more or less synchronous to the inferred cold and warm periods observed in the Narsaq Sound record," providing ever more evidence for the reality of thenaturally-occurring phenomenon that governs this millennial-scale oscillation of climate.
One year later, Vinther et al. (2010) analyzed 20 ice core records from 14 different sites, all of which stretched at least 200 years back in time, as well as near-surface air temperature data from 13 locations along the southern and western coasts of Greenland that covered approximately the same time interval (1784-2005), plus a similar temperature data set from northwest Iceland (said by the authors to be employed "in order to have some data indicative of climate east of the Greenland ice sheet"). This work demonstrated that winter ð18O was "the best proxy for Greenland temperatures." And based on that determination and working with three longer ice core ð18O records (DYE-3, Crete and GRIP), they developed a temperature history that extended more than 1400 years back in time.
This history revealed, in the words of the seven scientists, that "temperatures during the warmest intervals of the Medieval Warm Period" - which they defined as occurring some 900 to 1300 years ago - "were as warm as or slightly warmer than present day Greenland temperatures." As for what this result implies, they state that further warming of present day Greenland climate "will result in temperature conditions that are warmer than anything seen in the past 1400 years," which, of course, has not happened yet. Furthermore, Vinther et al. readily acknowledge that the independent "GRIP borehole temperature inversion suggests that central Greenland temperatures are still somewhat below the high temperatures that existed during the Medieval Warm Period."
About this same time, Kobashi et al. (2010) had a paper published in which they had written that "in Greenland, oxygen isotopes of ice (Stuiver et al., 1995) have been extensively used as a temperature proxy, but the data are noisy and do not clearly show multi-centennial trends for the last 1,000 years in contrast to borehole temperature records that show a clear 'Little Ice Age' and 'Medieval Warm Period' (Dahl-Jensen et al., 1998)." However, they went on to note that nitrogen (N) and argon (Ar) isotopic ratios - 15N/14N and 40Ar/36Ar, respectively - can be used to construct a temperature record that "is not seasonally biased, and does not require any calibration to instrumental records, and resolves decadal to centennial temperature fluctuations."
After describing the development of the new approach, they used it to construct a history of the last thousand years of central Greenland surface air temperature, based on values of the isotopic ratios of nitrogen and argon previously derived by Kobashi et al. (2008) from air bubbles trapped in the GISP2 ice core that had been extracted from central Greenland, obtaining the result depicted in the figure below.
Central Greenland surface temperature reconstruction for the last millennium. Adapted from Kobashi et al. (2010).
This figure depicts the central Greenland surface temperature reconstruction produced by the six scientists; and as best as can be determined from this representation, the peak temperature of the latter part of the Medieval Warm Period - which actually began some time prior to the start of their record, as demonstrated by the work of Dansgaard et al. (1975), Jennings and Weiner (1996), Johnsen et al. (2001) and Vinther et al. (2010) - was approximately 0.33°C greater than the peak temperature of the Current Warm Period, and about 1.67°C greater than the temperature of the last decades of the 20th century.
One year closer to the present, and noting that the varve thicknesses of annually-laminated sediments laid down by Hvitarvatn, a proglacial lake in the central highlands of Iceland, is controlled by the rate of glacial erosion and efficiency of subglacial discharge from the adjacent Langjokull ice cap, Larsen et al. (2011) employed a suite of environmental proxies contained within those sediments to reconstruct the region's climate variability and glacial activity over the past 3000 years, which proxies included varve thickness, varve thickness variance, ice-rafted debris, total organic carbon (mass flux and bulk concentration), and the C:N ratio of sedimentary organic matter. And when all was said and done, this effort indicated that "all proxy data reflect a shift toward increased glacial erosion and landscape destabilization from ca 550 AD to ca 900 AD and from ca 1250 AD to ca 1950 AD, separated by an interval of relatively mild conditions," and they state that "the timing of these intervals coincides with the well-documented periods of climate change commonly known as the Dark Ages Cold Period, the Medieval Warm Period, and the Little Ice Age."
In the case of the Medieval Warm Period, they additionally note that "varve thickness decreases after 950 AD and remains consistently low through Medieval time with slightly thinner annual laminations than for any other multi-centennial period in the past 3000 years," which suggests that the MWP was the warmest period of the past three millennia, while they say that "the LIA was the most severe multi-centennial cold interval of the late Holocene" and "likely since regional deglaciation 10,000 years ago."
Finally, for those desiring additional brief reports on the Medieval Warm Period in the Arctic, go to www.co2science.org and search for Hill et al. (2001), Joynt and Wolfe (2001), Hantemirov and Shiyatov (2002), Andersson et al. (2003), Helama et al. (2005), Mazepa (2005), Weckstrom et al. (2006), Jiang et al. (2007), Zabenskie and Gajewski (2007), Grudd (2008), Justwan et al. (2008), Scire et al. (2008), Axford et al. (2009), Bjune et al. (2009), Cook et al. (2009), Fortin and Gajewski (2010), Büntgen et al. (2011), Divine et al. (2011), Ran et al. (2011), Velle et al. (2011), D'Andrea et al. (2012) and Esperet al. (2012), full references for which articles are included in the Reference section below.
In concluding this summary, it is clear that the suite of measurements described in the studies reviewed above continues to indicate that the Arctic - which climate models suggest should be super-sensitive to greenhouse-gas-induced warming - is still not even as warm as it was several centuries ago during portions of the Medieval Warm Period, when there was much less CO2 and methane in the air than there is today, which facts further suggest that the planet's more modest current warmth need not be the result of historical increases in these two trace greenhouse gases.
References
Andersson, C., Risebrobakken, B., Jansen, E. and Dahl, S.O. 2003. Late Holocene surface ocean conditions of the Norwegian Sea (Voring Plateau). Paleoceanography 18: 10.1029/2001PA000654.
Andresen, C.S., Bjorck, S., Bennike, O. and Bond, G. 2004. Holocene climate changes in southern Greenland: evidence from lake sediments. Journal of Quaternary Science 19: 783-793.
Axford, Y., Geirsdottir, A., Miller, G.H. and Langdon, P.G. 2009. Climate of the Little Ice Age and the past 2000 years in northeast Iceland inferred from chironomids and other lake sediment proxies. Journal of Paleolimnology 41: 7-24.
Besonen, M.R., Patridge, W., Bradley, R.S., Francus, P., Stoner, J.S. and Abbott, M.B. 2008. A record of climate over the last millennium based on varved lake sediments from the Canadian High Arctic. The Holocene 18: 169-180.
Bjune, A.E., Seppa, H. and Birks, H.J.B. 2009. Quantitative summer-temperature reconstructions for the last 2000 years based on pollen-stratigraphical data from northern Fennoscandia. Journal of Paleolimnology 41: 43-56.
Briffa, K.R., Schweingruber, F.H., Jones, P.D., Osborn, T.J., Shiyatov, S.G. and Vaganov, E.A. 1998. Reduced sensitivity of recent tree-growth to temperature at high northern latitudes. Nature 391: 678-682.
Büntgen, U., Raible, C.C., Frank, D., Helama, S., Cunningham, L., Hofer, D., Nievergelt, D., Verstege, A., Timonen, M., Stenseth, N.C. and Esper, J. 2011. Causes and consequences of past and projected Scandinavian summer temperatures, 500-2100 AD. PLoS ONE 6: 10.1371/journal.pone.0025133.
Cook, T.L., Bradley, R.S., Stoner, J.S. and Francus, P. 2009. Five thousand years of sediment transfer in a high arctic watershed recorded in annually laminated sediments from Lower Murray Lake, Ellesmere Island, Nunavut, Canada. Journal of Paleolimnology 41: 77-94.
Dahl-Jensen, D., Mosegaard, K., Gundestrup, N., Clow, G.D., Johnsen, S.J., Hansen, A.W. and Balling, N. 1998. Past temperatures directly from the Greenland Ice Sheet. Science 282: 268-271.
D'Andrea, W.J., Vaillencourt, D.A., Balascio, N.L., Werner, A., Roof, S.R., Retelle, M. and Bradley, R.S. 2012. Mild Little Ice Age and unprecedented recent warmth in an 1800 year lake sediment record from Svalbard. Geology 40: 1007-1010.
Dansgaard, W., Johnsen, S.J., Gundestrup, N., Clausen, H.B. and Hammer, C.U. 1975. Climatic changes, Norsemen and modern man. Nature 255: 24-28.
Divine, D., Isaksson, E., Martma, T., Meijer, H.A.J., Moore, J., Pohjola, V., van de Wal, R.S.W. and Godtliebsen, F. 2011. Thousand years of winter surface air temperature variations in Svalbard and northern Norway reconstructed from ice-core data. Polar Research 30: 10.3402/polar.v30i0.7379.
Esper, J., Büntgen, U., Timonen, M. and Frank, D.C. 2012. Variability and extremes of northern Scandinavian summer temperatures over the past two millennia. Global and Planetary Change 88-89: 1-9.
Fortin, M.-C. and Gajewski, K. 2010. Holocene climate change and its effect on lake ecosystem production on Northern Victoria island, Canadian Arctic. Journal of Paleolimnology 43: 219-234.
Grinsted, A., Moore, J.C., Pohjola, V., Martma, T. and Isaksson, E. 2006. Svalbard summer melting, continentality, and sea ice extent from the Lomonosovfonna ice core. Journal of Geophysical Research 111: 10.1029/2005JD006494.
Grudd, H. 2008. Tornetrask tree-ring width and density AD 500-2004: a test of climatic sensitivity and a new 1500-year reconstruction of north Fennoscandian summers. Climate Dynamics: 10.1007/s00382-0358-2.
Grudd, H., Briffa, K.R., Karlen, W., Bartholin, T.S., Jones, P.D. and Kromer, B. 2002. A 7400-year tree-ring chronology in northern Swedish Lapland: natural climatic variability expressed on annual to millennial timescales. The Holocene 12: 657-665.
Hantemirov, R.M. and Shiyatov, S.G. 2002. A continuous multimillennial ring-width chronology in Yamal, northwestern Siberia.The Holocene 12: 717-716.
Helama, S., Timonen, M., Holopainen, J., Ogurtsov, M.G., Mielikainen, K., Eronen, M., Lindholm, M. and Merilainen, J. 2009. Summer temperature variations in Lapland during the Medieval Warm Period and the Little Ice Age relative to natural instability of thermohaline circulation on multi-decadal and multi-centennial scales. Journal of Quaternary Science 24: 450-456.
Hiller, A., Boettger, T. and Kremenetski, C. 2001. Medieval climatic warming recorded by radiocarbon dated alpine tree-line shift on the Kola Peninsula, Russia. The Holocene 11: 491-497.
Jennings, A.E. and Weiner, N.J. 1996. Environmental change in eastern Greenland during the last 1300 years: evidence from foraminifera and lithofacies in Nansen Fjord, 68°N. The Holocene 6: 179-191.
Jensen, K.G., Kuijpers, A., Koc, N. and Heinemeier, J. 2004. Diatom evidence of hydrographic changes and ice conditions in Igaliku Fjord, South Greenland, during the past 1500 years. The Holocene 14: 152-164.
Jiang, H., Ren, J., Knudsen, K.L., Eiriksson, J. and Ran, L.-H. 2007. Summer sea-surface temperatures and climate events on the North Icelandic shelf through the last 3000 years. Chinese Science Bulletin 52: 789-796.
Jiang, H., Seidenkrantz, M-S., Knudsen, K.L. and Eiriksson, J. 2002. Late-Holocene summer sea-surface temperatures based on a diatom record from the north Icelandic shelf. The Holocene 12: 137-147.
Johnsen, S.J., Dahl-Jensen, D., Gundestrup, N., Steffensen, J.P., Clausen, H.B., Miller, H., Masson-Delmotte, V., Sveinbjörnsdottir, A.E. and White, J. 2001. Oxygen isotope and palaeotemperature records from six Greenland ice-core stations: Camp Century, Dye-3, GRIP, GISP2, Renland and NorthGRIP. Journal of Quaternary Science 16: 299-307.
Joynt III, E.H. and Wolfe, A.P. 2001. Paleoenvironmental inference models from sediment diatom assemblages in Baffin Island lakes (Nunavut, Canada) and reconstruction of summer water temperature. Canadian Journal of Fisheries and Aquatic Sciences 58: 1222-1243.
Justwan, A., Koc, N. and Jennings, A.E. 2008. Evolution of the Irminger and East Icelandic Current systems through the Holocene, revealed by diatom-based sea surface temperature reconstructions. Quaternary Science Reviews 27: 1571-1582.
Kaplan, M.R., Wolfe, A.P. and Miller, G.H. 2002. Holocene environmental variability in southern Greenland inferred from lake sediments. Quaternary Research 58: 149-159.
Kobashi, T., Severinghaus, J.P., Barnola, J.-M., Kawamura, K., Carter, T. and Nakaegawa, T. 2010. Persistent multi-decadal Greenland temperature fluctuation through the last millennium. Climatic Change 100: 733-756.
Kobashi, T., Severinghaus, J.P. and Kawamura, K. 2008. Argon and nitrogen isotopes of trapped air in the GISP2 ice core during the Holocene epoch (0-11,600 B.P.): methodology and implications for gas loss processes. Geochimica et Cosmochimica Acta 72: 4675-4686.
Knudsen, K.L., Eiriksson, J., Jansen, E., Jiang, H., Rytter, F. and Gudmundsdottir, E.R. 2004. Palaeoceanographic changes off North Iceland through the last 1200 years: foraminifera, stable isotopes, diatoms and ice rafted debris. Quaternary Science Reviews 23: 2231-2246.
Korhola, A., Weckstrom, J., Holmstrom, L. and Erasto, P. 2000. A quantitative Holocene climatic record from diatoms in northern Fennoscandia. Quaternary Research 54: 284-294.
Larsen, D.J., Miller, G.H., Geirsdottir, A. and Thordarson, T. 2011. A 3000-year varved record of glacier activity and climate change from the proglacial lake Hvitarvatn, Iceland. Quaternary Science Reviews 30: 2715-2731.
Lassen, S.J., Kuijpers, A., Kunzendorf, H., Hoffmann-Wieck, G., Mikkelsen, N. and Konradi, P. 2004. Late Holocene Atlantic bottom water variability in Igaliku Fjord, South Greenland, reconstructed from foraminifera faunas. The Holocene 14: 165-171.
Mann, M.E., Bradley, R.S. and Hughes, M.K. 1998. Global-scale temperature patterns and climate forcing over the past six centuries. Nature 392: 779-787.
Mann, M.E., Bradley, R.S. and Hughes, M.K. 1999. Northern Hemisphere temperatures during the past millennium: Inferences, uncertainties, and limitations. Geophysical Research Letters 26: 759-762.
Mann, M.E. and Jones, P.D. 2003. Global surface temperatures over the past two millennia. Geophysical Research Letters30: 10.1029/2003GL017814.
Mazepa, V.S. 2005. Stand density in the last millennium at the upper tree-line ecotone in the Polar Ural Mountains. Canadian Journal of Forest Research 35: 2082-2091.
Moberg, A., Sonechkin, D.M., Holmgren, K., Datsenko, N.M. and Karlenm, W. 2005. Highly variable Northern Hemisphere temperatures reconstructed from low- and high-resolution proxy data. Nature 433: 613-617.
Moore, J.J., Hughen, K.A., Miller, G.H. and Overpeck, J.T. 2001. Little Ice Age recorded in summer temperature reconstruction from varved sediments of Donard Lake, Baffin Island, Canada. Journal of Paleolimnology 25: 503-517.
Naurzbaev, M.M., Vaganov, E.A., Sidorova, O.V. and Schweingruber, F.H. 2002. Summer temperatures in eastern Taimyr inferred from a 2427-year late-Holocene tree-ring chronology and earlier floating series. The Holocene 12: 727-736.
Norgaard-Pedersen, N. and Mikkelsen, N. 2009. 8000 year marine record of climate variability and fjord dynamics from Southern Greenland. Marine Geology 264: 177-189.
Ran, L., Jiang, H., Knudsen, K.L. and Eiriksson, J. 2011. Diatom-based reconstruction of palaeoceanographic changes on the North Icelandic shelf during the last millennium. Palaeogeography, Palaeoclimatology, Palaeoecology 302: 109-119.
Schweingruber, F.H. and Briffa, K.R. 1996. Tree-ring density network and climate reconstruction. In: Jones, P.D., Bradley, R.S. and Jouzel, J. (Eds.), Climatic Variations and Forcing Mechanisms of the Last 2000 Years, NATO ASI Series 141. Springer-Verlag, Berlin, Germany, pp. 43-66.
Sicre, M.-A., Jacob, J., Ezat, U., Rousse, S., Kissel, C., Yiou, P., Eiriksson, J., Knudsen, K.L., Jansen, E. and Turon, J.-L. 2008. Decadal variability of sea surface temperatures off North Iceland over the last 2000 years. Earth and Planetary Science Letters 268: 137-142.
Seppa, H. and Birks, H.J.B. 2002. Holocene climate reconstructions from the Fennoscandian tree-line area based on pollen data from Toskaljavri. Quaternary Research 57: 191-199.
Stuiver, M., Grootes, P.M. and Brazunias, T.F. 1995. The GISP2 ð18O climate record of the past 16,500 years and the role of the sun, ocean, and volcanoes. Quaternary Research 44: 341-354.
Vaganov, E.A., Shiyatov, S.G. and Mazepa,V.S. 1996. Dendroclimatic Study in Ural-Siberian Subarctic. Nauka, Novosibirsk, Russia.
Vare, L.L., Masse, G., Gregory, T.R., Smart, C.W. and Belt, S.T. 2009. Sea ice variations in the central Canadian Arctic Archipelago during the Holocene. Quaternary Science Reviews 28: 1354-1366.
Velle, G., Kongshavn, K. and Birks, H.J.B. 2011. Minimizing the edge-effect in environmental reconstructions by trimming the calibration set: Chironomid-inferred temperatures from Spitsbergen. The Holocene 21: 417-430.
Vinther, B.M., Jones, P.D., Briffa, K.R., Clausen, H.B., Andersen, K.K., Dahl-Jensen, D. and Johnsen, S.J. 2010. Climatic signals in multiple highly resolved stable isotope records from Greenland. Quaternary Science Reviews 29: 522-538.
Virkkunen, K. 2004. Snowpit Studies in 2001-2002 in Lomonosovfonna, Svalbard. M.S. Thesis, University of Oulu, Oulu, Finland.
Wagner, B., Bennike, O., Bos, J.A.A., Cremer, H., Lotter, A.F. and Melles, M. 2008. A multidisciplinary study of Holocene sediment records from Hjort So on Store Koldewey, Northeast Greenland. Journal of Paleolimnology 39: 381-398.
Wagner, B. and Melles, M. 2001. A Holocene seabird record from Raffles So sediments, East Greenland, in response to climatic and oceanic changes. Boreas 30: 228-239.
Weckstrom, J., Korhola, A., Erasto, P. and Holmstrom, L. 2006. Temperature patterns over the past eight centuries in Northern Fennoscandia inferred from sedimentary diatoms. Quaternary Research 66: 78-86.
Zabenskie, S. and Gajewski, K. 2007. Post-glacial climatic change on Boothia Peninsula, Nunavut, Canada. Quaternary Research 68: 261-270.
Subscribe to:
Posts (Atom)