CRU "selected" only 1643 of the 4495 surface stations available to produce the hockey stick temperature graph below
This "selected" instrumental record was "Mike's Nature Trick" grafted onto the tree-ring proxies to "hide the decline" in the tree ring proxies to produce the infamous Mann Hockey Stick.
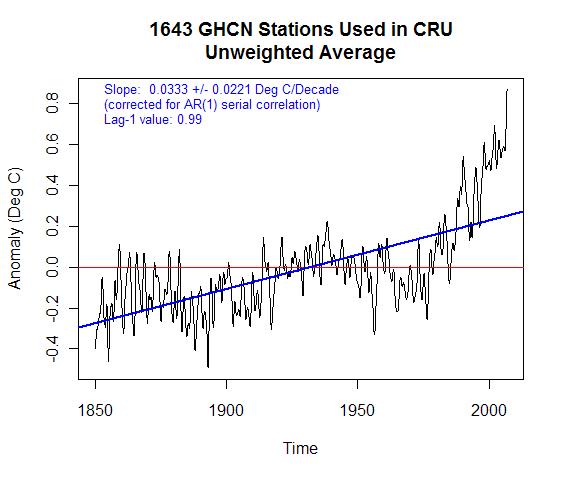
The Air Vent has graphed the "raw" data from all 4495 surface stations below. Lo and behold, no hockey stick.

Read more about the data at the above link. Seems to confirm the CRU email from Phil Jones to Michael Mann, Malcolm Hughes and others, Mar 11, 2003, which stated: “Even with the instrumental record, the early and late 20th century warming periods are only significant locally at between 10-20% of grid boxes.” Begs the question, were the stations that showed significant 20th century warming (probably those biased by urban heat island effect) selected in order to produce the hockey stick graph?
No comments:
Post a Comment