Showing posts sorted by relevance for query antarctic peninsula. Sort by date Show all posts

Thursday, December 5, 2013

New paper finds no change in maximum temperatures of Antarctic Peninsula over past 66 years

A new paper finds "there is no evidence for an increase of the annual maximum temperature" over the past 66 years in the Antarctic Peninsula.

From the latest NIPCC Report update:

The Strange "Global Warming" of the Antarctic Peninsula

Reference: Franzke, C. 2013. Significant reduction of cold temperature extremes at Faraday/Vernadsky station in the Antarctic Peninsula. International Journal of Climatology 33: 1070-1078.

Antarctica is a region of the planet expected to see a great increase in temperature as a result of greenhouse gas-induced global warming. Temperatures there have been routinely measured at the Faraday/Vernadsky station on the Antarctic Peninsula ever since February of 1947; and they reveal a warming of approximately 3.8°C through January 2011, making the peninsula a veritable global warmer's paradise. But the location has one ... small ... problem. According to the study of Franzke (2013), "there is no evidence for an increase of the annual maximum temperature."

"Typically," in the words of Franzke, "one would expect that a significant warming also leads to absolute warmer temperatures and not just to a reduction in cold temperatures." But the latter is precisely what has happened at the Faraday/Vernadsky weather station: it's only the colder temperatures that have gotten warmer.

Franzke also notes that "global climate projections suggest that the frequency of hot extremes will increase due to global warming," citing Meehl et al. (2007). The models therefore also miss the mark as it applies to the Antarctic Peninsula, and to other parts of the world as well (see, for example, Kukla and Karl, 1993; Easterling et al., 1997). And thus it is that Franzke writes that the data from the Antarctic Peninsula "are somewhat at odds with the general opinion that global warming leads to more frequent and larger extremes." In fact, on the Antarctic Peninsula, Franzke finds that "annual maximum temperatures are almost constant over the last six decades," while minimum temperatures have actually gotten less extreme.

And so it is that there may not have been even a relative heat wave on the Antarctic Peninsula since the start of temperature measurements there some six and a half decades ago.

Additional References:


Easterling, D.R., Horton, B., Jones, P.D., Peterson, T.C., Karl, T.R., Parker, D.E., Salinger, M.J., Razuvayev, V., Plummer, N., Jamason, P. and Folland, C.K. 1997. Maximum and minimum temperature trends for the globe. Science 277: 364-367.

Kukla, G. and Karl, T.R. 1993. Nighttime warming and the greenhouse effect. Environmental Science and Technology 27: 1468-1474.

Meehl, G.A., Stocker, T.F., Collins, W.D., Friedlingstein, P., Gaye, A.T., Gregory, J.M., Kitoh, A., Knutti, R., Murphy, J.M., Noda, A., Raper, S.C.B., Watterson, I.G., Weaver, A.J. and Zhao, Z.-C. 2007. In: IPCC Climate Change 2007: The Physical Science Basis: Contribution of Working Group I to the Fourth Assessment Report of the Intergovernmental Panel on Climate Change (Solomon, S., Qin, D., Manning, M., Chen, Z., Marquis, M., Averyt, K.B., Tignor, M. and Miller, H.L., Eds.), Cambridge University Press, Cambridge, United Kingdom, pp. 747-846.

Antarctica, Warming, Looks Ever More Vulnerable

Thursday, August 23, 2012

New paper shows sea temperatures near Antarctica were about 10°C warmer 12,000 years ago

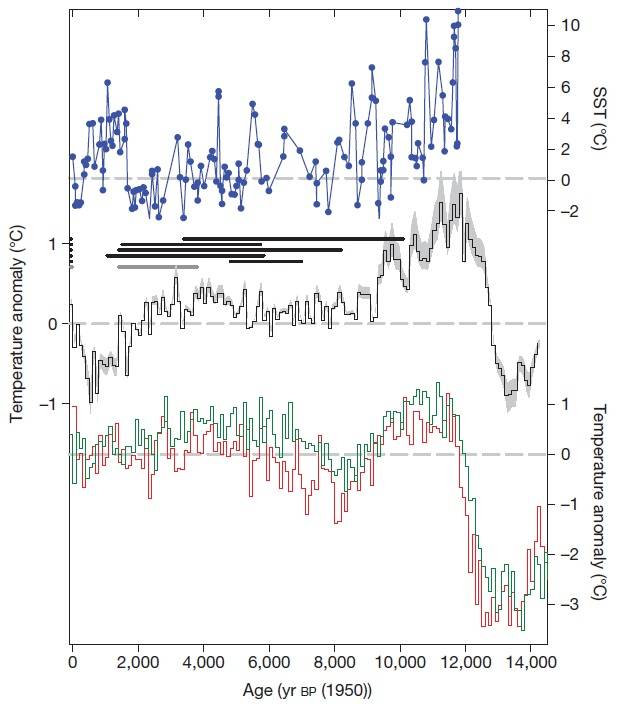
According to a press release from the British Antarctic Survey, temperatures of the Antarctic peninsula were 1.3°C warmer than today 11,000 years ago. Examination of a graph from the paper [below] also indicates nearby sea surface temperatures were up to a remarkable 10°C warmer than the 1961-1990 mean 12,000 years ago as the Earth emerged from the last major ice age. The graph also indicates the Antarctic peninsula warmed at a much faster rate from 13,000 to 12,000 years ago than over the past 1000 years. Greenhouse gases could not possibly explain this radical climate change, especially given the fact that there was little change in greenhouse gases during these periods and that infrared radiation from greenhouse gases cannot heat the oceans.

Related: The cognitive dissonance of AGW
 
Ice core shows Antarctic Peninsula warming is nothing unusual

Press release flatly contradicts what boffins said

New ice core data from the Antarctic Peninsula has revealed that temperatures in the region during the past 10,000 years have often been higher than they are today, and that warming of the sort seen there recently has also occurred in the pre-industrial past.

The new data are derived from a massive new 364m-long core extracted from the ice sheet lying on top of James Ross Island towards the northern tip of the Antarctic Peninsula in the freezing Weddell Sea. The core was extracted by scientists from the British Antarctic Survey, assisted by French boffins, who reached the area courtesy of the Royal Navy ice-patrol ship HMS Endurance and her helicopters.

The mighty core has allowed analysing boffins to reconstruct local temperatures and snowfall way back to the end of the last ice age. The info is of particular interest as the Peninsula has warmed up rather quickly over the last 50 years or so, and is bucking the overall Antarctic trend which has seen vast new expanses of sea ice appear around the coasts of the austral continent. Thus it is that the Ross Island ice core results have made it into this week's edition of agenda-setting boffinry mag Nature.

So what have we got?
Ice core reconstruction of Antarctic Peninsula climate during the Holocene. credit: Nature
Top graph is Sea Surface Temperature (SST) relative to the 1961-1990 mean [grey horizontal dotted line]. Second graph is the reconstructed Antarctic temperatures from the ice core of the paper relative to the 1961-1990 mean [grey horizontal dotted line]. Graph caption from Nature:
The JRI ice-core temperature reconstruction relative to the 1961–1990 mean (black trace, 100-yr average; the grey band indicates the standard error of the calibration dependence) is shown alongside a sea surface temperature (SST) reconstruction
As is plain from the graphs, it has often been hotter than it is now at Ross Island during the past 10,000 years - today's temperatures are nothing exceptional. The idea that they must result from man-made carbon emissions doesn't, on the face of it, seem that credible.

But perhaps the recent warming has been exceptionally, unprecedentedly fast? The Esperanza station not far from James Ross has recorded a climb of 2°C since it was established in 1958. Maybe something is happening along the Peninsula which has never happened before in the Holocene (post Ice Age) era?

It would certainly seem so. A press release [1] issued ahead of the Nature paper by the British Antarctic Survey states uncompromisingly:
The scientists reveal that the rapid warming of this region over the last 100 years has been unprecedented.
[Since the publication of this article the press release webpage has been amended to say "very unusual" - Ed.]

Panic Stations!

Hold on though. The actual Nature paper [2] has this to say:
The high rate of warming over the past century is unusual (but not unprecedented) in the context of natural climate variability over the past two millennia.
And for good measure:
Repeating the temperature trend analysis using 50-year windows confirms the finding that the rapidity of recent Antarctic Peninsula warming is unusual but not unprecedented ... natural millennial-scale climate variability has resulted in warming on the eastern Antarctic Peninsula that has been ongoing for a number of centuries and had left ice shelves in this area vulnerable to collapse.
So yes, ice shelves along the shores of the Weddell Sea may very well snap off in coming years, especially if warming should continue. It appears to have happened often enough in the pre-industrial past:
There is evidence for instability of the Larsen A ice shelf between 3,800 and 1,400 yr [ago]. Farther south again, the Larsen B ice shelf probably remained intact throughout the Holocene, although there is evidence that the ice shelf was progressively weakened by melting ... temperatures similar to present occurred in this region for much of the Holocene, resulting in a regime in which ice shelves were only transient features along the northern-most part of the eastern Antarctic Peninsula and were undergoing decay farther to the south. An additional new perspective is that recent warming to levels consistent with the mid Holocene meant that the ice shelves along the northeastern Peninsula were poised for the succession of collapses observed there over recent decades.
Or in other words there really doesn't seem to be anything happening on the Antarctic Peninsula that hasn't happened before. Global warming may, as may climate scientists believe it is, be set to increase disastrously in the coming century: but there's no particular sign of it to be seen at the Peninsula, now that we have an accurate insight into the area's past history.
What this episode does show is just how blindly and unquestioningly the general scientific and media communities believe in the idea of carbon-driven climate apocalypse: the mindset of the PR staffer who wrote that press release and the various journalists who have uncritically reprocessed it is more reminiscent of religion than of science. 

Sunday, November 28, 2010

Antarctic Temperatures and Ice Extent Not Unprecedented

An article posted this week on the Nongovernmental International Panel on Climate Change (NIPPC) & CO2science.org websites shows the Medieval Warming Period (MWP) extended to Antarctica with temperatures as warm as the present and that "the present state of reduced ice on the western Antarctic Peninsula is not unprecedented," even within the last thousand years, which stands in stark contrast to the long-held claim of the Intergovernmental Panel on Climate Change that late-20th-century warmth was globally unprecedented over the past one to two millennia." The Medieval Warming Project map site clearly shows that the MWP was a global phenomenon during which temperatures exceeded the present in most studies:

The Medieval Warm Period on the Antarctic Peninsula
Hall, B.L., Koffman, T. and Denton, G.H. 2010. Reduced ice extent on the western Antarctic Peninsula at 700-970 cal. yr B.P. Geology 38: 635-638.

"In a paper published in the July 2010 issue of Geology, Hall et al. (2010) note that (1) "over the past 50 years, the Antarctic Peninsula warmed ~2°C," that (2) "rapid breakups have destroyed several small, thin ice shelves fringing the Antarctic Peninsula," and that (3) removal of ice-shelf back pressure resulted in a marked increase in seaward flow of glaciers discharging into the now abandoned embayments," leading them to ask a most important question: "Is the recent warming of the Antarctic Peninsula unique in the Holocene?"

In an attempt to answer this question, the three researchers "examined organic-rich sediments exposed by recent retreat of the Marr Ice Piedmont on western Anvers Island near Norsel Point," where they say that glaciers "have been undergoing considerable retreat in response to the well-documented warming," which led to their sampling area being deglaciated about six years ago. And based on what they found and describe as "the first record of terrestrial organic material exposed by recently retreating ice that bears on past glacier extent and climate in this sensitive region," Hall et al. conclude that "ice was at or behind its present position at ca. 700-970 cal. yr B.P. and during at least two earlier times, represented by the dates of shells, in the mid-to-late Holocene," which means, in their words, that "the present state of reduced ice on the western Antarctic Peninsula is not unprecedented," even within the last thousand years, which finding stands in stark contrast to the long-held claim of the Intergovernmental Panel on Climate Change that late-20th-century warmth was globally unprecedented over the past one to two millennia.

This finding thus prompted the U.S. scientists to ask another important question: "How widespread is the event at 700-970 cal yr B.P.?" Starting first with the Antarctic Peninsula itself, they write that (1) "Khim et al. (2002) noted a pronounced high-productivity (warm) event between 500 and 1000 cal. yr B.P. in magnetic susceptibility records from Bransfield Basin," that (2) "dates of moss adjacent to the present ice front in the South Shetland Islands (Hall, 2007) indicate that ice there was no more extensive between ca. 650 and 825 cal. yr B.P. than it is now," and that (3) "Bentley et al. (2009) reported that evidence for warming at this time seems restricted to the Western Antarctic Peninsula and is seen best in some (although not all) marine cores (i.e., Domack et al., 2003)," all of which observations suggest, in their words, that "at least in the western and northern Antarctic Peninsula area," the warmth they discovered "is not an anomalous event."

Looking a little further abroad, Hall et al. say their "evidence for reduced ice extent at 700-970 cal. yr B.P. is consistent with tree-ring data from New Zealand that show a pronounced peak in summer temperatures (Cook et al., 2002)," and that "New Zealand glaciers were retracted at the same time (Schaefer et al., 2009)." Moreover, they add that their data "are compatible with a record of glacier fluctuations from southern South America, the continental landmass closest to Antarctica (Strelin et al., 2008)." And, last of all, the timing of the warm interval discovered by Hall et al. (AD 1030-1300) compares well with that of the entire globe, as may be seen on CO2 Science's Interactive Map and Time Domain Plot of their Medieval Warm Period Project.

In conclusion, as ever more relevant evidence is acquired, the case for an equivalent or warmer-than-present Medieval Warm Period grows ever stronger, continually weakening the climate-alarmist claim that the planet's current warmth can only be explained by including the warming they believe to have been produced by the increasing concentrations of atmospheric CO2 and other greenhouse gases that were experienced over the course of the 20th century, all of which gases' concentrations were much reduced back at the time of the equal or greater warmth of the Medieval Warm Period."

Thursday, August 21, 2014

New paper finds melt rate of Antarctic Peninsula has decreased since 1993 & decrease in LW radiation from GHGs

According to Joe 'exploding head' Romm, the Antarctic Peninsula meltdown to China is now "non-linear, fastest in 1000 years!" However, a paper published today in The Cryosphere paints an entirely different picture.

The paper examines the surface energy budget on the two major Larsen & Wilkins ice shelves in the Antarctic Peninsula over the past 21 years from 1989-2010. According to the authors, "the automated weather station observations on the Larsen Ice Shelf did not show any significant temperature trend, and the reanalyses [of temperature data] showed warming trends only over the Wilkins Ice Shelf." However, the authors find a large upward biases in the reanalyzed data, stating, "Focusing on biases of seasonal means, our validation results include three interesting issues: (1) all three reanalyses had warm temperature biases in all seasons..."  Thus, it isn't clear how much, if any, of the warming of the Wilkins Ice Shelf is real vs. due to biases in the reanalyses, and meanwhile direct weather station observations of the Larsen Ice Shelf show no warming over the past 21 years.

Contrary to Romm's claim 4 months ago that the supposed Antarctic Peninsula meltdown is "non-linear, fastest in 1000 years," the authors instead find the fastest melt rates of the past 21 years were in 1992-1993 and have decreased since then:


The paper attributes the possible warming of the Wilkins Ice Shelf to natural changes in atmospheric pressure, wind, and cloud fraction, but not longwave radiation from the steady increase in greenhouse gases. Why? Because the authors paradoxically find that net longwave radiation from greenhouse gases has decreased over the past 21 years, rather than increased from the steady rise of greenhouse gases as predicted by AGW theory. 

This is shown in the following tables where LW = net longwave radiation from greenhouse gases at the surface of the Antarctic Peninsula, SW = net shortwave radiation from the Sun, Ann = Annual. There are statistically significant negative trends in net longwave radiation on both ice shelves, not positive as would be expected from the steady rise of well-mixed greenhouse gases. Another paper has also found a paradoxical decrease of longwave radiation from greenhouse gases over the past 14 years in the US Great Plains.


The authors also note that monthly mean temperatures only rose above the freezing point twice over the past 21 years, during the summers of 1989–1990 and 1994–1995. 
"Unfortunately the Larsen C AWS was out of commissionin summer 1992–1993, and thus could not be used for confirmingthe peaking of melt during that summer. During summers1989–1990 and 1994–1995, which are identifiable bythe high number of melt days on LCIS, the monthly meantemperature was above 0 C during one summer month accordingto the AWS. Monthly mean temperatures did not riseabove freezing point during any other period between 1989and 2010. According to the AWS data, summer 2002–2003,which experienced a large melt, was not distinctly warmerthan other summers."
Joe Romm

The Cryosphere, 8, 1519-1538, 2014
www.the-cryosphere.net/8/1519/2014/
doi:10.5194/tc-8-1519-2014


I. Välisuo1,2, T. Vihma1, and J. C. King3
1Finnish Meteorological Institute, Helsinki,Finland
2Departement of Physics, University of Helsinki, Helsinki, Finland
3British Antarctic Survey, Cambridge, UK

Abstract. Ice shelves in the Antarctic Peninsula have significantly disintegrated during recent decades. To better understand the atmospheric contribution in the process, we have analysed the inter-annual variations in radiative and turbulent surface fluxes and weather conditions over Larsen C Ice Shelf (LCIS) and Wilkins Ice Shelf (WIS) in the Antarctic Peninsula in 1989–2010. Three atmospheric reanalyses were applied: ERA-Interim by ECMWF, Climate Forecast System Reanalysis (CFSR) by NCEP, and JRA-25/JCDAS by the Japan Meteorological Agency. In addition, in situ observations from an automatic weather station (AWS) on LCIS were applied, mainly for validation of the reanalyses. The AWS observations on LCIS did not show any significant temperature trend, and the reanalyses showed warming trends only over WIS: ERA-Interim in winter (0.23 °C yr−1) and JRA-25/JCDAS in autumn (0.13 °C yr−1). In LCIS from December through August and in WIS from March through August, the variations of surface net flux were partly explained by the combined effects of atmospheric pressure, wind and cloud fraction. The explained variance was much higher in LCIS (up to 80%) than in WIS (26–27%). Summer melting on LCIS varied between 11 and 58 cm water equivalent (w.e.), which is comparable to previous results. The mean amount of melt days per summer on LCIS was 69. The high values of melting in summer 2001–2002 presented in previous studies on the basis of simple calculations were not supported by our study. Instead, our calculations based on ERA-Interim yielded strongest melting in summer 1992–1993 on both ice shelves. On WIS the summer melting ranged between 10 and 23 cm w.e., and the peak values coincided with the largest disintegrations of the ice shelf. The amount of melt on WIS may, however, be underestimated by ERA-Interim, as previously published satellite observations suggest that it suffers from a significant bias over WIS.


Related:

Tuesday, May 13, 2014

New paper finds most of Antarctica cooled over the past 1,000 years

A new paper published in Nature Climate Change reconstructs temperatures in Antarctica and South America over the past 1000 years and shows that most of Antarctica has cooled over the past 1000 years. The temperature reconstructions in figure 1a below show South America was about as warm during the Medieval Warm Period 800-1000 years ago, and shows that Antarctica as a whole has cooled ~0.4C over the past 1000 years.

The authors find only the relatively small Antarctic Peninsula and a small portion of the southern tip of South America warmed over the past 1000 years:

Temperature reconstructions for South America on top, James Ross Island [JMI] on the Antarctic Peninsula in middle, and Antarctica as a whole on bottom graph. Blue colors indicate cooling, white no change, red warming in legend for fig 1b. 
Climate models, however, predicted anthropogenic global warming to cause the most pronounced warming at both poles, a significant decrease in Antarctic sea ice, and more warming and sea ice loss in Antarctica than the Arctic, all of which are failed predictions. Instead, Antarctic sea ice levels is currently well above the highest recorded levels in history for time of year. 


Evolution of the Southern Annular Mode during the past millennium

Main


Warming of the polar regions has global implications for sea-level rise and climate change feedback processes such as decreased planetary albedo and the release of naturally stored carbon reservoirs. High-latitude amplification of global warming trends is clearly observed across the Arctic45. In contrast, Antarctica is the only continental region where long-term cooling over the past 2,000 years has not yet been reversed to climate warming5. Yet some regions of Antarctica have warmed significantly over the past ~50 years, with the Antarctic Peninsula and parts of west Antarctica displaying the most rapid temperature increases in the Southern Hemisphere67. Understanding these regional responses of Antarctic temperature to recent climate change requires an improved characterization of natural and anthropogenically driven changes in Southern Hemisphere climate variability.
Here we use the James Ross Island (JRI) ice core from the northern Antarctic Peninsula789 (64.2° S, 57.7° W; Fig. 1), along with other published temperature-sensitive proxies5, to reconstruct Southern Annular Mode (SAM) variability since AD 1000. The SAM can be defined as the zonal mean atmospheric pressure difference between the mid-latitudes (~40° S) and Antarctica (~65° S; ref 1). The positive phase of the SAM is associated with low pressure anomalies over Antarctica and high pressure anomalies over the mid-latitudes, and this enhanced atmospheric pressure gradient results in strengthening and poleward contraction of the Southern Hemisphere westerly jet stream1. The mountainous geographic barrier of the Antarctic Peninsula makes temperature variability in this region particularly sensitive to the strength of the westerly winds passing through Drake Passage. As such, JRI is a key location for documenting SAM-related climate variability (Fig. 1b) and previous work89 has demonstrated that the water-isotope-derived temperature record from the JRI ice core is significantly correlated with observational indices of the SAM110.

Figure 1: Regional temperature histories.
a, James Ross Island (JRI) temperature reconstruction79 (green) alongside continent-scale temperature reconstructions5 for South America (red) and Antarctica (blue; excludes JRI). Anomalies shown as 7 yr (thin grey lines) and 70 yr (thick lines and grey shading) moving averages, relative to AD1961–1990 means (dashed lines). b, Location of JRI (green cross) and proxies used in the South America (red crosses) and Antarctica (blue crosses) temperature reconstructions. Shading shows spatial correlation coefficient (rp < 0.1) of the annual SAM index1 with 2 m air temperature in the ERA-Interim reanalysis16 (January–December averages; AD 1979– 2012).
The JRI temperature record since AD 1000 has an inverse correlation with the Past Global Changes 2k network (PAGES2k) reconstruction of continental Antarctic temperature5 (Fig. 1a). This opposing temperature history between the Antarctic Peninsula and the main Antarctic continent is consistent with the spatial response of surface air temperatures to SAM variability (Fig. 1b) and is statistically significant on annual to multidecadal timescales (Table 1). The JRI temperature record also shows similarities to the PAGES2k South American temperature reconstruction5 that may indicate a shared climate forcing, although the positive correlation between the two data sets is not statistically significant (Table 1). However, in their long-term evolution, the South American and JRI reconstructions both indicate that the coolest 50-year interval of the past millennium occurred at AD1410–1460, with progressive phases of warming since that time (Fig. 1a).

Tuesday, August 6, 2013

New paper finds Antarctic sea ice retreated during the 1940's when CO2 was 'safe' & not since

A new paper published in Quaternary Science Reviews reconstructs sea ice changes around the Antarctic Peninsula from 1860-2000 and finds "abrupt changes between 1935 and 1950, marked by ocean warming and sea ice retreat in both sides of the Antarctic Peninsula." However, the authors find that from 1950-2000 there was no trend in sea ice extent, stating, "Since 1950, inferred environmental conditions do not provide evidence for any trend related to the recent warming". Satellite data, available since 1979, shows Antarctic sea ice is currently at record highs, 900,000 square kilometers above the 1979-2008 average. If man-made CO2 emissions had anything to do with Antarctic sea ice, the opposite pattern would have been observed over the past 153 years.

Notes: Global sea ice is also currently above the 1979-2008 mean. The Antarctic Peninsula is falsely claimed to be one of the most rapidly warming regions on Earth.
Satellite data for Antarctic sea ice extent
Diatoms and biomarkers evidence for major changes in sea ice conditions prior the instrumental period in Antarctic Peninsula

  • a Université Bordeaux, EPOC, UMR 5805, F-33400 Talence, France
  • b UMR-CNRS 7159 LOCEAN, Université Pierre et Marie Curie, Paris VI, Jussieu, 75252 Paris Cedex 05, France
  • c UMI 3376 TAKUVIK, CNRS & Université Laval, 1045 Avenue de la Médecine, G1V 0A6 Québec, Canada

Abstract

The Antarctic Peninsula (AP) has been identified as one of the most rapidly warming region on Earth. Satellite monitoring currently allows for a detailed understanding of the relationship between sea ice extent and duration and atmospheric and oceanic circulations in this region. However, our knowledge on ocean–ice–atmosphere interactions is still relatively poor for the period extending beyond the last 30 years. Here, we describe environmental conditions in Northwestern and Northeastern Antarctic Peninsula areas over the last century using diatom census counts and diatom specific biomarkers (HBIs) in two marine sediment multicores (MTC-38C and -18A, respectively). Diatom census counts and HBIs show abrupt changes between 1935 and 1950, marked by ocean warming and sea ice retreat in both sides of the AP. Since 1950, inferred environmental conditions do not provide evidence for any trend related to the recent warming but demonstrate a pronounced variability on pluri-annual to decadal time scale. We propose that multi-decadal sea ice variations over the last century are forced by the recent warming, while the annual-to-decadal variability is mainly governed by synoptic and regional wind fields in relation with the position and intensity of the atmospheric low-pressure trough around the AP. However, the positive shift of the SAM since the last two decades cannot explain the regional trend observed in this study, probably due to the effect of local processes on the response of our biological proxies.

Related:

New paper finds Antarctic sea ice has markedly increased over past 7000 years

Tuesday, September 16, 2014

New paper finds solar energy at surface of Antarctic Peninsula controls ice melt, not CO2

A new paper published in Atmospheric Chemistry and Physics finds the "largest contributor to the melting energy" during the melt season on the Antarctic Peninsula is the net solar energy received at the surface, which is in turn dependent upon cloud cover and 'föhn wind jets' which clear cloud cover.

According to the authors,
"The surface energy budget of the model during the melting periods showed that the net downwelling short-wave surface flux [the net solar energy at the surface] was the largest contributor to the melting energy, indicating that the cloud clearing effect of föhn events is likely to be the most important factor for increased melting relative to non-föhn days."
Thus, glacier melt on the Antarctic Peninsula, one of many so-called 'canaries in the coal mine' for CAGW, is not primarily dependent upon alarmist claims of radiative forcing from man-made CO2, but rather natural variations in cloud cover and solar energy received at the surface.

The paper comes on the heels of another paper published a few days ago finding Arctic sea ice extent linked to absorption of sunlight by clouds, a similar mechanism governing net shortwave solar energy received by the surface.  


Thus, given these two new papers, solar energy modulated by cloud cover may be the dominant factor controlling ice extent/mass in both the Arctic and Antarctic, not radiative forcing from man-made CO2.


Atmos. Chem. Phys., 14, 9481-9509, 2014
www.atmos-chem-phys.net/14/9481/2014/
doi:10.5194/acp-14-9481-2014


D. P. Grosvenor1,*, J. C. King2, T. W. Choularton1, and T. Lachlan-Cope2
1University of Manchester, Centre for Atmospheric Science, SEAES, Manchester, UK
2British Antarctic Survey, Cambridge, UK
*now at: School of Earth and Environment, University of Leeds, Leeds, UK

Abstract. Mesoscale model simulations are presented of a westerly föhn event over the Antarctic Peninsula mountain ridge and onto the Larsen C ice shelf, just south of the recently collapsed Larsen B ice shelf. Aircraft observations showed the presence of föhn jets descending near the ice shelf surface with maximum wind speeds at 250–350 m in height. Surface flux measurements suggested that melting was occurring. Simulated profiles of wind speed, temperature and wind direction were very similar to the observations. However, the good match only occurred at a model time corresponding to ~9 h before the aircraft observations were made since the model föhn jets died down after this. This was despite the fact that the model was nudged towards analysis for heights greater than ~1.15 km above the surface.

Timing issues aside, the otherwise good comparison between the model and observations gave confidence that the model flow structure was similar to that in reality. Details of the model jet structure are explored and discussed and are found to have ramifications for the placement of automatic weather station (AWS) stations on the ice shelf in order to detect föhn flow. Cross sections of the flow are also examined and were found to compare well to the aircraft measurements. Gravity wave breaking above the mountain crest likely created a~situation similar to hydraulic flow and allowed föhn flow and ice shelf surface warming to occur despite strong upwind blocking, which in previous studies of this region has generally not been considered. Our results therefore suggest that reduced upwind blocking, due to wind speed increases or stability decreases, might not result in an increased likelihood of föhn events over the Antarctic Peninsula, as previously suggested.

The surface energy budget of the model during the melting periods showed that the net downwelling short-wave surface flux [the net solar energy at the surface] was the largest contributor to the melting energy, indicating that the cloud clearing effect of föhn events is likely to be the most important factor for increased melting relative to non-föhn days. The results also indicate that the warmth of the föhn jets through sensible heat flux ("SH") may not be critical in causing melting beyond boundary layer stabilisation effects (which may help to prevent cloud cover and suppress loss of heat by convection) and are actually cancelled by latent heat flux ("LH") effects (snow ablation). It was found that ground heat flux ("GRD") was likely to be an important factor when considering the changing surface energy budget for the southern regions of the ice shelf as the climate warms.

Tuesday, September 11, 2012

New paper finds Antarctic Peninsula has accumulated significant extra ice since 1850

A paper published today in Geophysical Research Letters finds the Antarctic Peninsula has experienced a "significant accumulation" of "up to 45 meters of extra ice thickness over the past 155 years." This finding is contrary to the alarmist claims of the highly-flawed study published by RealClimate's Dr. Eric Steig, which alleged that the Antarctic Peninsula is rapidly warming. The finding is particularly surprising since the "significant accumulation" of ice has occurred since the end of the Little Ice Age in ~ 1850. 


GEOPHYSICAL RESEARCH LETTERS, doi:10.1029/2012GL052559
Key Points
  • Accumulation increase results in up to 45 m extra ice thickness over 155 years
  • Model predicts GIA-related subsidence of up to 7 mm/yr which will affect GPS
  • GRACE-derived rates of ice-mass change are biased low by ignoring this signal
Authors:
Grace A. Alexandra Nield
Pippa L. L Whitehouse
Matt A. A King
Peter J. J Clarke
Michael J. J Bentley
Antarctic Peninsula (AP) ice core records indicate significant accumulation increase since 1855, and any resultant ice mass increase has the potential to contribute substantially to present-day Glacial Isostatic Adjustment (GIA). We derive empirical orthogonal functions from climate model output to infer typical spatial patterns of accumulation over the AP and, by combining with ice core records, estimate annual accumulation for the period 1855-2010. In response to this accumulation history, high resolution ice-sheet modeling predicts ice thickness increases of up to 45 m, with the greatest thickening in the northern and western AP. Whilst this thickening is predicted to affect GRACE estimates by no more than 6.2 Gt/yr, it may contribute up to -7 mm/yr to the present-day GIA uplift rate, depending on the chosen Earth model, with a strong east-west gradient across the AP. Its consideration is therefore critical to the interpretation of observed GPS velocities in the AP.

Thursday, May 1, 2014

No evidence of unusual, unnatural, or unprecedented warming in Antarctica

From the latest NIPCC Report:


Reference: van Ommen, T. 2013. Antarctic response. Nature Geoscience 6: 334-335.

In a news & views item published in Nature Geoscience, van Ommen (2013) comments on the prior publications of Abram et al. (2013) and Steig et al. (2013), which, in his words, "add to the evidence that changes currently seen in Antarctica are unusual relative to the past 2000 years." And he says that "taken together, alongside other indicators of change, the message is becoming clearer: Antarctica is very likely to be showing a response to the warming climate of the planet," which he says may "reflect the effects of a combination of natural variability and the early impacts of rising greenhouse gas concentrations."

But are the findings of Abram et al. and Steig et al. truly unusual relative to the past 2000 years? In a word, no. And why? Because several scientific studies of Antarctic temperature reconstructions clearly suggest otherwise, as can readily be verified by perusing the brief one-sentence synopses listed below that pertain to a half-dozen journal articles on this subject.

1. Roberts et al. (2004) conducted a fossil diatom analysis of an 82-cm sediment core that was removed from the deepest part of one of the Windmill Islands of East Antarctica, finding a multi-centennial period of warmth (2000-1700 14C yr BP) that experienced summer temperatures they described as being "much higher than present summer temperatures."

2. Hall et al. (2006) found evidence of elephant seal presence at 14 different locations along Antarctica's Victoria Land Coast between 600 BC and AD1400, which they said is indicative of "warmer-than-present climate conditions."

3. Hall (2007) determined that the Collins Ice Cap margin on Fildes Peninsula (King George Island, South Shetland Islands) "is still more extensive than it was prior to ~650 cal. yr BP," which led her to conclude that the climate prior to that time may have been "as warm as or warmer than present."

4. Hall et al. (2010) examined organic-rich sediments exposed by the recent retreat of the Marr Ice Piedmont on western Anvers Island near Norsel Point, finding peat from the exposed sediments dated between 707 ± 36 and 967 ± 47 cal. yr B.P., which led them to conclude that "ice was at or behind its present position at ca. 700-970 cal. yr B.P.," meaning that temperatures during that period were as warm as or warmer than they are currently.

5. Bertler et al. (2011) studied deuterium (δD) data obtained from a 180-meter-long ice core that had been extracted from the ice divide of Victoria Lower Glacier in the northernmost McMurdo Dry Valleys, finding that "the McMurdo Dry Valleys were 0.35°C warmer during the Medieval Warm Period than during the Modern Era."

6. Lu et al. (2012), working with "a downcore δ18O record of natural ikaite hydration waters and crystals collected from the Antarctic Peninsula," found that the "most recent crystals suggest a warming relative to the Little Ice Age in the last century, possibly as part of the regional recent rapid warming," but they add that this latter event "is not yet as extreme in nature as the Medieval Warm Period."

So, no. There is nothing unusual, unnatural or unprecedented about the current level of warmth in and around Antarctica relative to the past 2000 years. And, therefore, there is no logical basis for accusing the historical increase in the air's CO2 concentration over the past 2000 years of having caused any unusual, unnatural or unprecedented warming of the globe, simply because there has been no such warming.

Additional References


Abram, N., Mulvaney, R., Wolff, E.W., Triest, J., Kipfstuhl, S., Trusel, L.D., Vimeux, F., Fleet, L. and Arrowsmith, C. 2013. Acceleration of snow melt in an Antarctic Peninsula ice core during the twentieth century. Nature Geoscience 6: 404-411.

Bertler, N.A.N., Mayewski, P.A. and Carter, L. 2011. Cold conditions in Antarctica during the Little Ice Age - Implications for abrupt climate change mechanisms. Earth and Planetary Science Letters 308: 41-51.

Hall, B.L. 2007. Late-Holocene advance of the Collins Ice Cap, King George Island, South Shetland Islands. The Holocene 17: 1253-1258.

Hall, B.L., Hoelzel, A.R., Baroni, C., Denton, G.H., Le Boeuf, B.J., Overturf, B. and Topf, A.L. 2006. Holocene elephant seal distribution implies warmer-than-present climate in the Ross Sea. Proceedings of the National Academy of Sciences USA 103: 10,213-10,217.

Hall, B.L., Koffman, T. and Denton, G.H. 2010. Reduced ice extent on the western Antarctic Peninsula at 700-970 cal. yr B.P. Geology 38: 635-638.

Lu, Z., Rickaby, R.E.M., Kennedy, H., Kennedy, P., Pancost, R.D., Shaw, S., Lennie, A., Wellner, J. and Anderson, J.B. 2012. An ikaite record of late Holocene climate at the Antarctic Peninsula. Earth and Planetary Science Letters 325-326: 108-115.

Roberts, D., McMinn, A., Cremer, H., Gore, D.B. and Melles, M. 2004. The Holocene evolution and palaeosalinity history of Beall Lake, Windmill Islands (East Antarctica) using an expanded diatom-based weighted averaging model. Palaeogeography, Palaeoclimatology, Palaeoecology 208: 121-140.

Steig, E.J., Ding, Q., White, J.C.W., Kuettel, M., Rupper, S.B., Neumann, T.A., Neff, P.D., Gallant, A.J.E., Mayewski, P.A., Taylor, K.C., Hoffmann, G., Dixon, D.A., Schoenemann, S., Markle, B.M., Schneider, D.P., Fudge, T.J., Schauer, A.J., Teel, R.P., Vaughn, B., Burgener, L., Williams, J. and Korotkikh, E. 2013. Recent climate and ice-sheet changes in West Antarctica compared with the past 2000 years. Nature Geoscience 6: 372-375.