Showing posts sorted by relevance for query clouds solar. Sort by date Show all posts

Sunday, January 5, 2014

Paper finds solar amplification mechanism via clouds at the South Pole, amplifies surface solar irradiance up to 24 times

A paper published in Atmospheric Chemistry and Physics finds evidence of a solar amplification mechanism via cloud cover at the South Pole. According to the authors, at solar cycle minimums, cloud cover increases which further decreases solar radiation reaching the surface of the South Pole by 1.8% - 2.4%, depending on the wavelength, and vice-versa for solar cycle maximums. This begs the question: Could the current record high Antarctic sea ice extent be related to the current weakest solar cycle in 100 years rather than AGW? ;)

The paper adds to many other peer-reviewed papers describing solar amplification mechanisms by which tiny 0.1% changes of total solar irradiance can be amplified to produce large effects on climate. According to this paper, 0.1% changes in solar irradiation over solar cycles are amplified by a factor of 18 to 24 times at the surface of the South Pole, dependent upon wavelength. As noted by Dr. Roy Spencer, a mere 1-2% change in global cloud cover [such as the 1.8% - 2.4% found by this paper] can alone account for global warming - or global cooling.


The current solar cycle is the weakest in 100-200 years.


Atmos. Chem. Phys., 11, 1177-1189, 2011
www.atmos-chem-phys.net/11/1177/2011/
doi:10.5194/acp-11-1177-2011

Full paper available here:


J. E. Frederick and A. L. Hodge
Department of the Geophysical Sciences, University of Chicago, Chicago, Illinois, USA
Abstract. This research examines a 17-year database of UV-A (320–400 nm) and visible (400–600 nm) solar irradiance obtained by a scanning spectroradiometer located at the South Pole. The goal is to define the variability in solar irradiance reaching the polar surface, with emphasis on the influence of cloudiness and on identifying systematic trends and possible links to the solar cycle. To eliminate changes associated with the varying solar elevation, the analysis focuses on data averaged over 30–35 day periods centered on each year's austral summer solstice. The long-term average effect of South Polar clouds is a small attenuation, with the mean measured irradiances being about 5–6% less than the clear-sky values, although at any specific time clouds may reduce or enhance the signal that reaches the sensor. The instantaneous fractional attenuation or enhancement is wavelength dependent, where the percent deviation from the clear-sky irradiance at 400–600 nm is typically 2.5 times that at 320–340 nm. When averaged over the period near each year's summer solstice, significant correlations appear between [ground level] irradiances at all wavelengths and the solar cycle as measured by the 10.7 cm solar radio flux. An approximate 1.8 ± 1.0% decrease in ground-level irradiance occurs from solar maximum to solar minimum for the wavelength band 320–400 nm. The corresponding decrease for 400–600 nm is 2.4 ± 1.9%. The best-estimate declines appear too large to originate in the sun. If the correlations have a geophysical origin, they suggest a small variation in atmospheric attenuation [clouds] with the solar cycle over the period of observation, with the greatest attenuation [more clouds] occurring at solar minimum.

Wednesday, January 21, 2015

Analysis: Solar radiation & cloud cover control the temperature in Sweden


Repost from The Climate Scam site, showing the remarkable correlation between solar radiation (modulated by clouds) and temperature in Sweden (google translation from Swedish).


The weather gods control the temperature in Sweden


Commenters have noted that the solar radiation in Sweden has increased while the temperature has risen. SMHI has published measurements of global radiation / insolation here . 

Summer temperatures and solar radiation as line graphs
Figure 7 - The summer temperature and solar radiation as line graphs
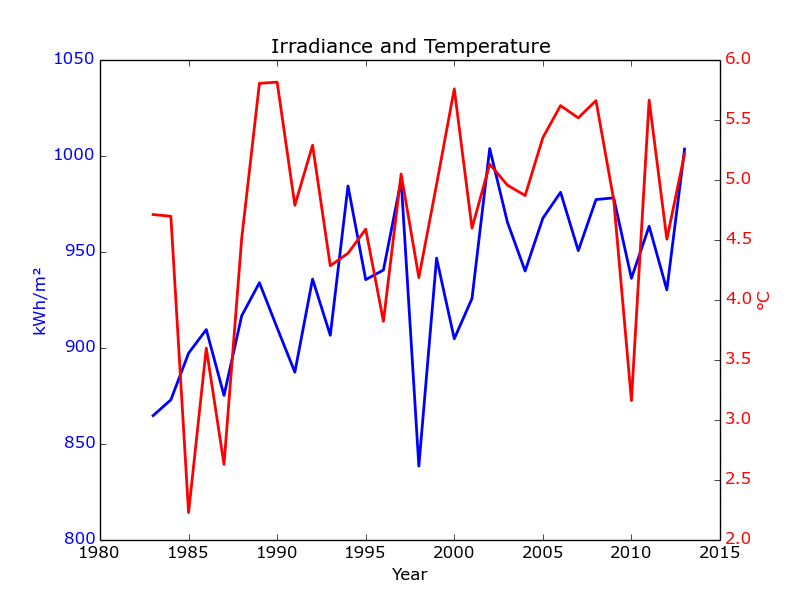
Annual solar radiation from SMHI and temperature from ECMWF.  The lines show the average values ​​for the towns of Kiruna, Luleå, Umeå, Östersund, Karlstad, Stockholm, Visby and Lund
Figure 1 - annual solar radiation from SMHI and temperature from ECMWF (ERA-Interim). The lines show the average values ​​for the towns of Kiruna, Luleå, Umeå, Östersund, Karlstad, Stockholm, Visby and Lund, 1983 - 2013
In the figure above you can see that on a yearly basis seems higher insolation give higher temperatures, but there are also large variations which must be explained in other ways. One must remember that it is not only the sun that affect our temperature. It will also large amounts of energy to us here in Sweden by the winds. To get a better picture of the situation goes, I therefore over to analyzing the data on seasonal basis (summer, fall, winter, spring) instead.

Why has solar radiation increased?

A hypothesis why solar radiation has increased is that the amount of aerosols have declined recently after having increased during the 1950-70's. This explanation fits very well into växthuseffekts hypothesis because it can not explain why the temperature dropped during the 1950-70 centuries otherwise.
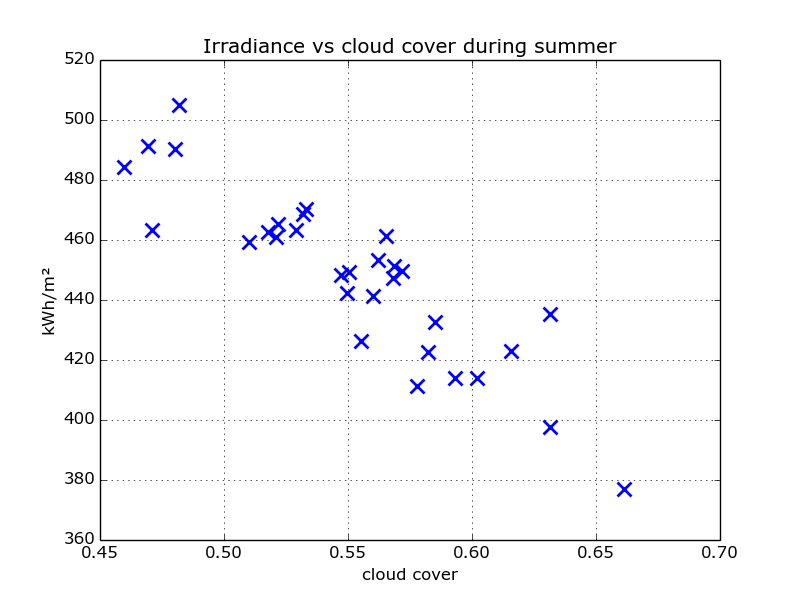
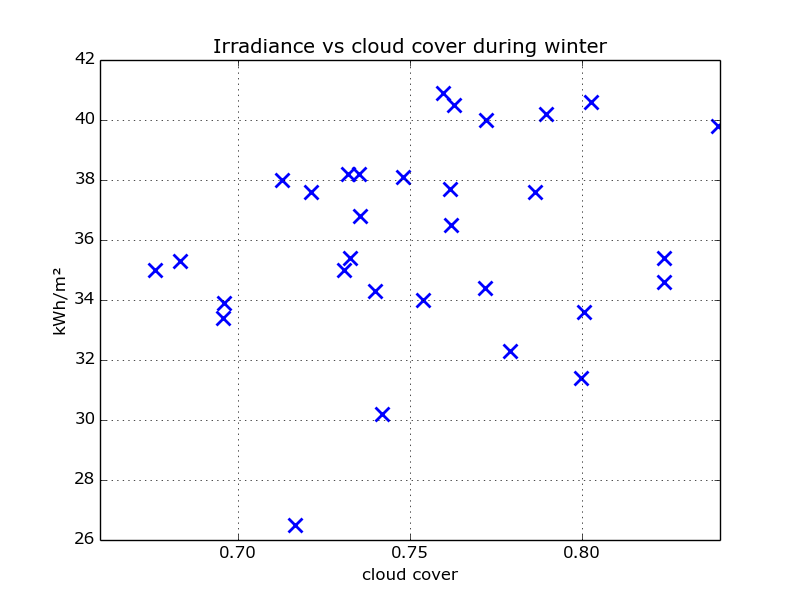
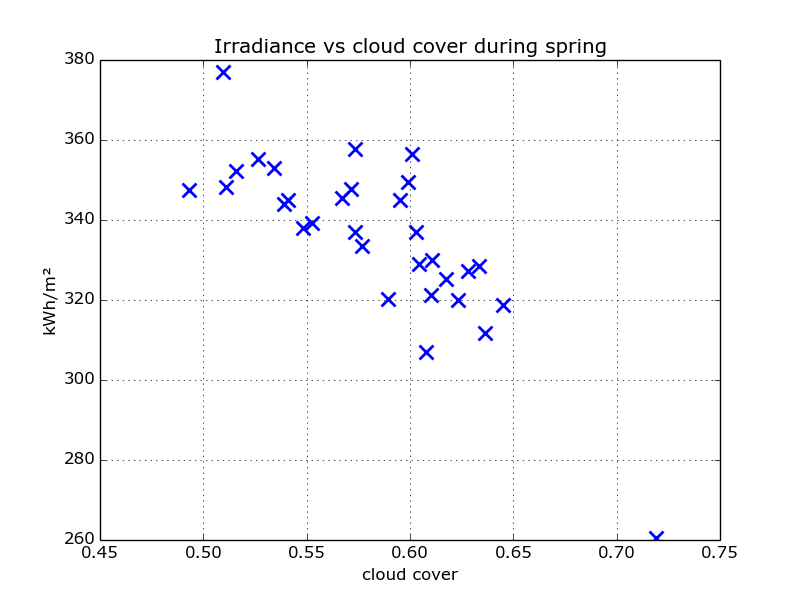
But solar radiation is also affected very much by the amount of clouds. From ECMWF (ERA-Interim), one can get access to the amount of clouds that have been calculated in the same way as you do when you make weather forecasts. These values ​​should therefore be free from the influence of aerosols. Below are the solar radiation as a function of the proportion of clouds for the four seasons (click the figures for larger size).
scatter_irradiance_cloud_summerSolar radiation vs Rain
scatter_irradiance_cloud_winterscatter_irradiance_cloud_spring
Figure 2 - Solar radiation as a function of cloudy 1983-2013. The points show the average values ​​for the towns of Kiruna, Luleå, Umeå, Östersund, Karlstad, Stockholm, Visby and Lund.
For summer and spring seems to be a very strong connection between rain and solar radiation.Less cloud gives more sun. The relationship is somewhat weaker for the fall, but winter seems ratio should be the opposite. More clouds giving more "sun". The explanation for this is probably that even the long-wave radiation from the clouds measured. And during the winter when the sun's rays are weak, the radiation from the clouds to break through in the statistics.
I asked a question SMHI which wavelengths included in the measurement and got the following response:
" Most of this energy is in the wavelength range 300-4000 nm and distributed roughly 8 percent in the ultraviolet (UV), 48 percent in the visible and 44 percent in the near-infrared (IR) portion of the spectrum outside the Earth's atmosphere. "
The conclusion from this simple exercise is that there seems to be a strong link between cloud cover and solar radiation and therefore ought aerosol hypothesis could be written off. It has atleast not critical. It is thus that the weather patterns have changed and it has given us more sun.

Does increased insolation provide higher temperatures?

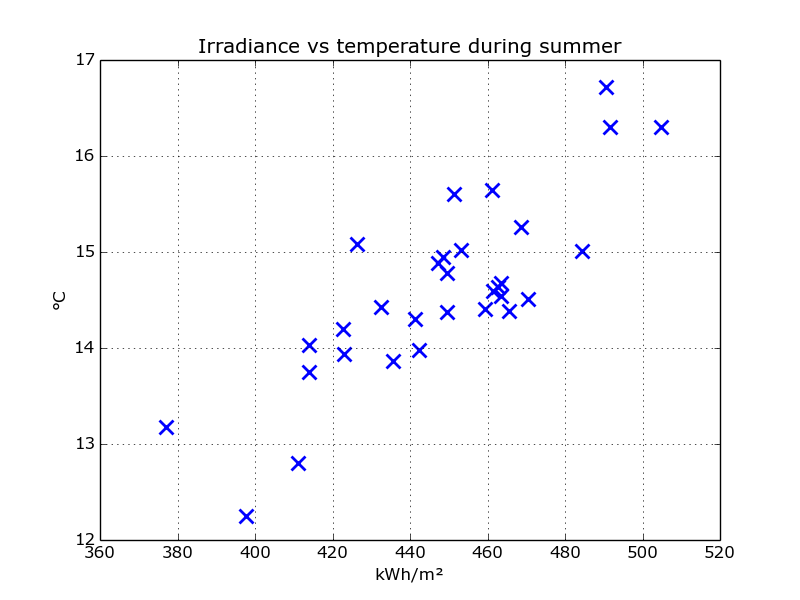
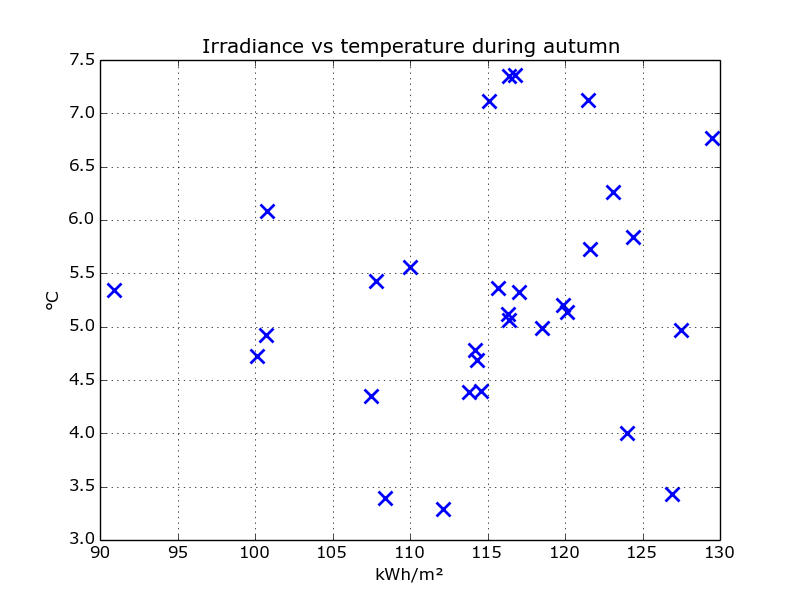
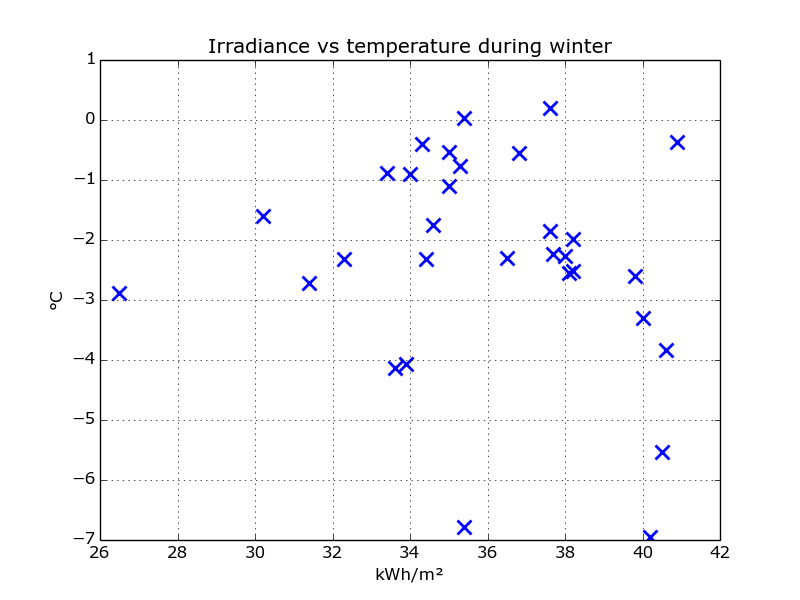
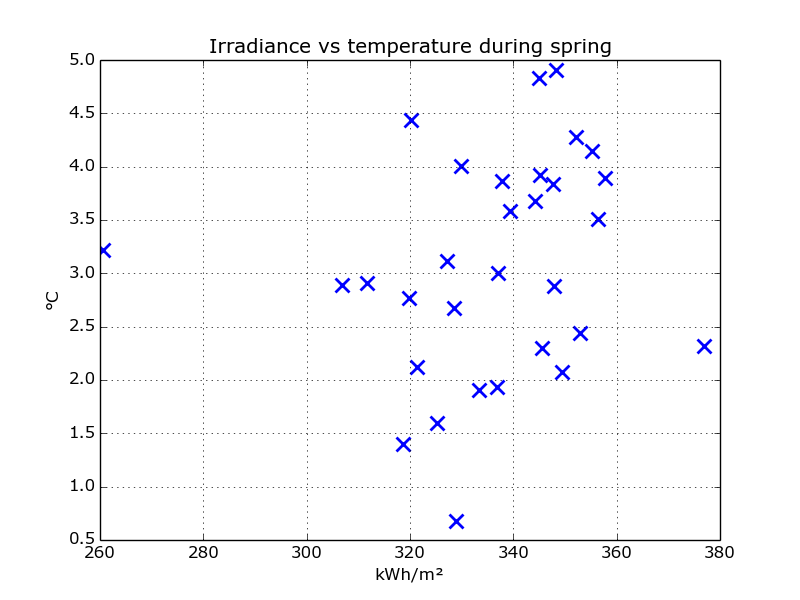
Let's look at how the temperature has been affected by solar radiation. Below are the four seasons with the temperature as a function of solar radiation.
scatter_irradiance_temp_summerscatter_irradiance_temp_autumn
scatter_irradiance_temp_winterscatter_irradiance_temp_spring
Figure 3 As temperature as a function of solar radiation 1983-2013.
There seem to be a strong link between solar radiation and temperature during the summer.But this access seems to be missing for the other seasons.
The handyman can also figure out the "climate sensitivity" from summer figure, and one can then validate whether the IPCC 4 W / m2 at doubling of carbon dioxide could provide several degrees higher temperature.
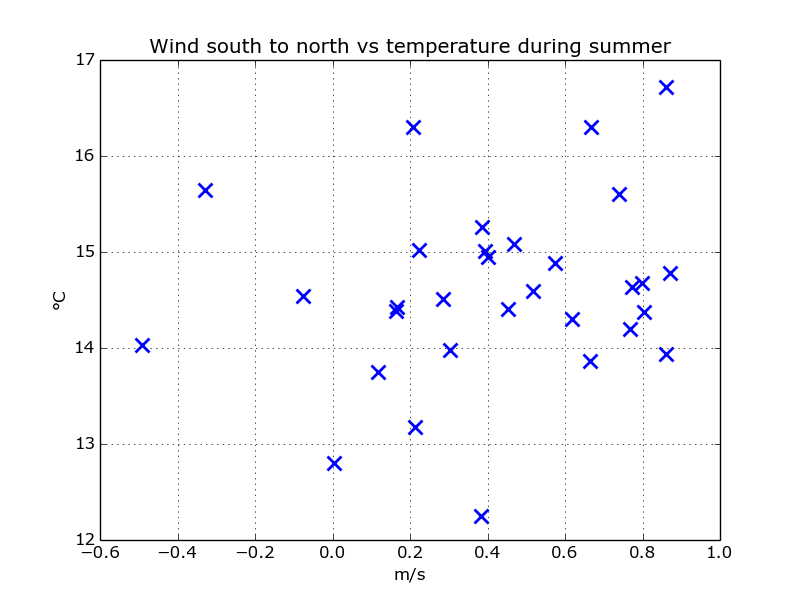
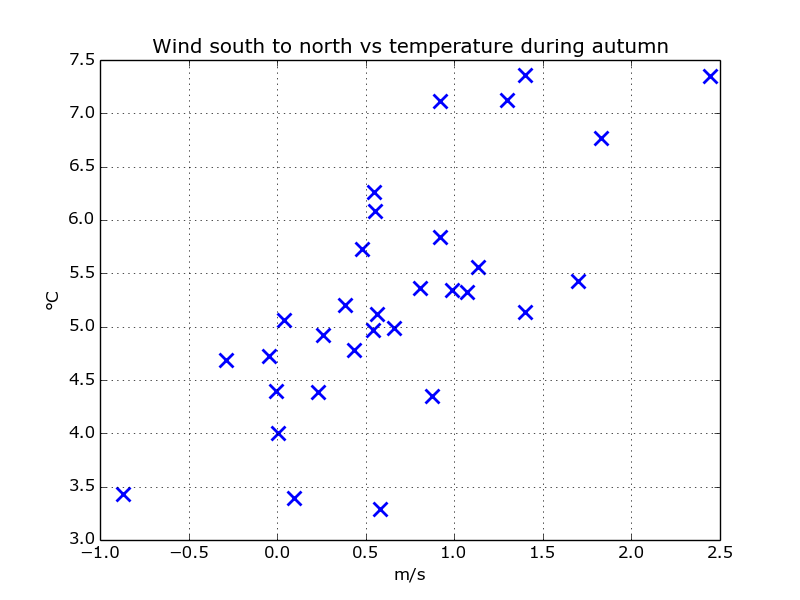
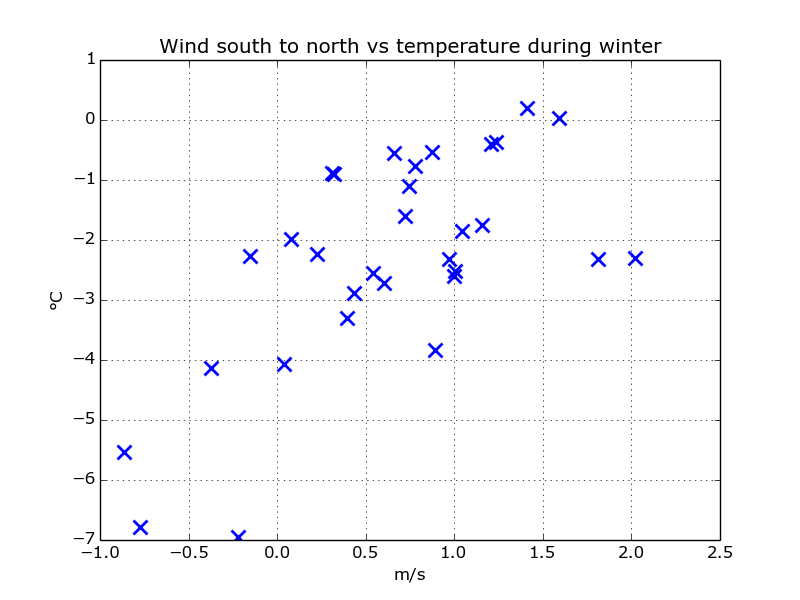
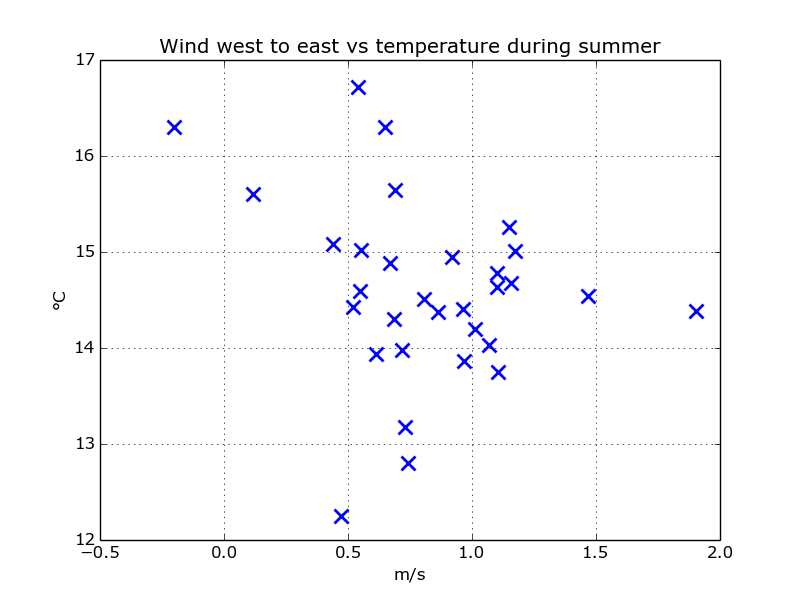
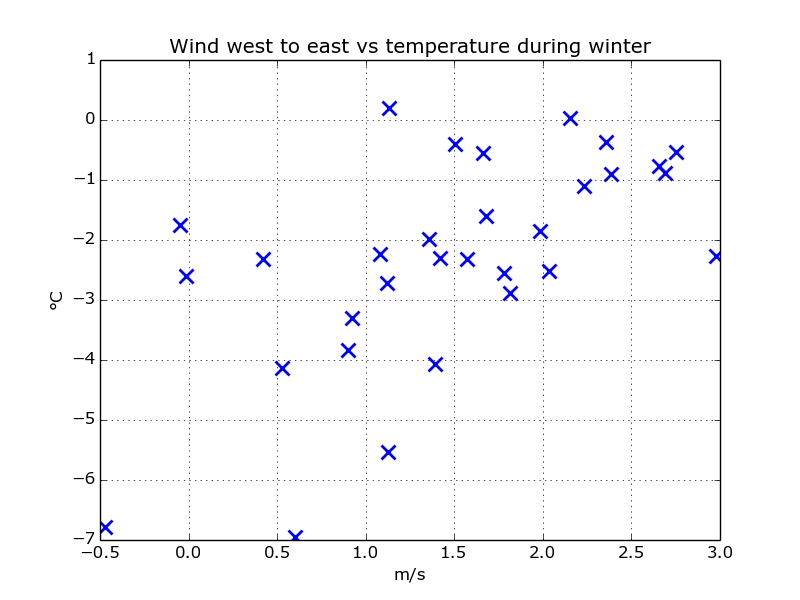
From ECMWF can also get values ​​for wind at 10 m height. Below are the temperature as a function of the southern and western wind:
scatter_wind_south_temp_summerscatter_wind_south_temp_autumn
scatter_wind_south_temp_winterscatter_wind_south_temp_spring
Figure 4 As temperature as a function of the southerly wind 1983-2013.
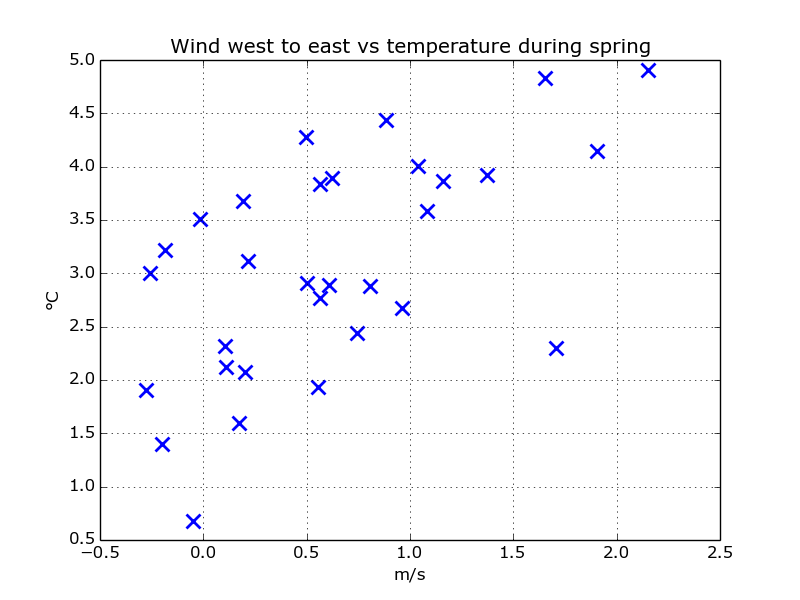
scatter_wind_west_temp_summerscatter_wind_west_temp_autumn
scatter_wind_west_temp_winterscatter_wind_west_temp_spring
Figure 5 As temperature as a function of the westerly wind 1983-2013.
Here there seems to be a link between southerly winds and temperatures for autumn and winter. There also seems to be a link between the western wind and spring temperature. But perhaps many factors that affect spring temperature being unable to find any strong determining factor.
An example of how the southerly wind has increased during the winter are shown below.
Winter temperatures and the southerly wind
Figure 6 - Winter temperatures and the southerly wind
It is thus not surprising that we get "bad" winters if the wind blows from the south and not from the north. And this is not something we can blame the carbon dioxide.

Conclusions

Solar radiation in Sweden has increased since the early 1980s. Maybe it has increased even earlier but I have no good measurements prior period. The increased solar radiation appears to be strongly linked to reduced cloud cover. It is thus needed no aerosol hypothesis to explain the increased solar radiation.
The increased summer temperatures in Sweden seems to be strongly linked to the increased solar radiation. Autumn and vårtemperaturerna other hand, is linked to the increased southerly wind. The picture is somewhat more complicated for spring, but the increased westerly wind seems to have a meaning.
We can thus explain most of the increased temperature in Sweden to changing weather patterns. If the carbon dioxide level has a bearing on the temperature this meaning is much smaller than the natural variation.
I have only shown a selection of all graphs I have developed. If you want to watch more graphs, there is a zip file here .
Update 2015-01-20 9:00:
On "Sunglasses" request show me this character how well the summer temperature and solar radiation are similar
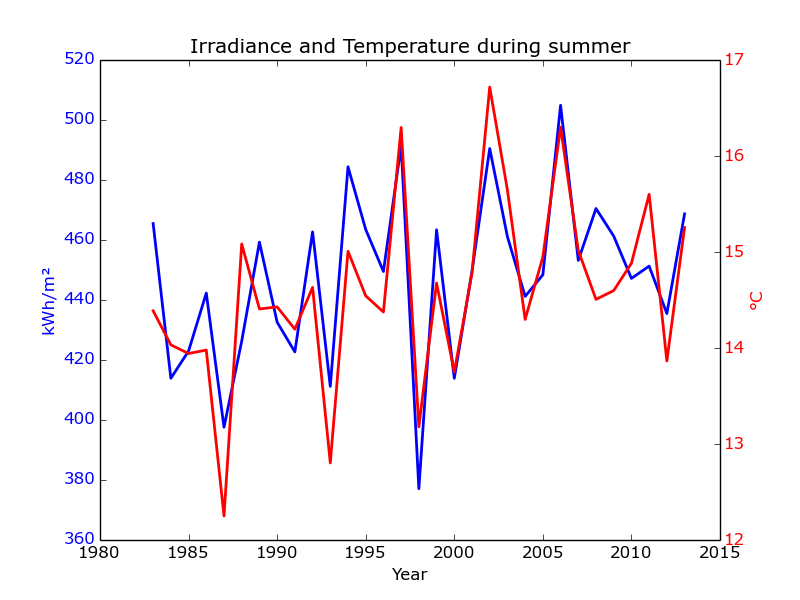
Summer temperatures and solar radiation as line graphs
Figure 7 - The summer temperature and solar radiation as line graphs

Friday, October 5, 2012

New paper finds significant, persistent influence of solar activity on regional cloud cover & climate

A new paper published in Environmental Research Letters finds that changes in solar activity have a significant and persistent effect upon cloud cover in some key climate-defining regions. As noted by the authors, "A consensus regarding the impact of solar variability on cloud cover is far from being reached. Moreover, the impact of cloud cover on climate is among the least understood of all climate components." Using data from 1984-2009, the authors studied variations in both solar UV [which can vary by over 20% within solar cycles] and cosmic rays [the Svensmark hypothesis], finding, "For some key geographical regions the response of clouds to [solar UV] and [cosmic ray modulation of clouds] is persistent over the entire time interval indicating a real link." The authors urge that "any analysis of solar effects on cloud cover (and, consequently, on climate) should be done at the regional level."

The full paper is available here

Persistent solar signatures in cloud cover: spatial and temporal analysis

OPEN ACCESS
M Voiculescu1 and I Usoskin2
Show affiliations


Letter

A consensus regarding the impact of solar variability on cloud cover is far from being reached. Moreover, the impact of cloud cover on climate is among the least understood of all climate components. This motivated us to analyze the persistence of solar signals in cloud cover for the time interval 1984–2009, covering two full solar cycles. A spatial and temporal investigation of the response of low, middle and high cloud data to cosmic ray induced ionization (CRII) and UV irradiance (UVI) is performed in terms of coherence analysis of the two signals. For some key geographical regions the response of clouds to UVI and CRII is persistent over the entire time interval indicating a real link. In other regions, however, the relation is not consistent, being intermittent or out of phase, suggesting that some correlations are spurious. The constant in phase or anti-phase relationship between clouds and solar proxies over some regions, especially for low clouds with UVI and CRII, middle clouds with UVI and high clouds with CRII, definitely requires more study. Our results show that solar signatures in cloud cover persist in some key climate-defining regions for the entire time period and supports the idea that, if existing, solar effects are not visible at the global level and any analysis of solar effects on cloud cover (and, consequently, on climate) should be done at the regional level.

Saturday, September 12, 2015

Strong evidence of negative-feedback from clouds


The Cloud feedback

by Cederlöf. Google translation from the Stockholm Initiative site 
In the comments to my last post, led the signature "Slabadang" me on an interesting track. He claimed that the clouds varied in tune with the solar radiation. If this would be the clouds would have a negative feedback and thus balance the climate. I downloaded the satellite data from CERES to check his data.
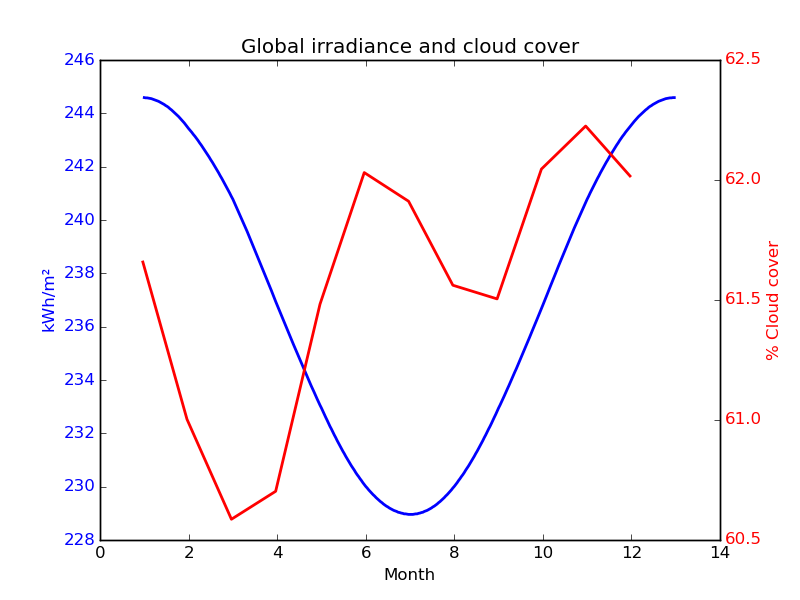
Below is how the global cloud cover varies with the global solar radiation. The reason that solar radiation varies over the year is that the Earth is in an elliptical orbit around the sun. When we in the northern hemisphere has winter, we are therefore closest to the sun. However, it is the angle to the sun which means we have winter.

The global cloud cover and solar radiation variation over the year. The cloud cover is an average of the years 2000 to 2014.
So it is a poor correlation between cloud cover and solar radiation if you look at the Earth as a whole. However piling a completely different picture up if you instead look at the two hemispheres:

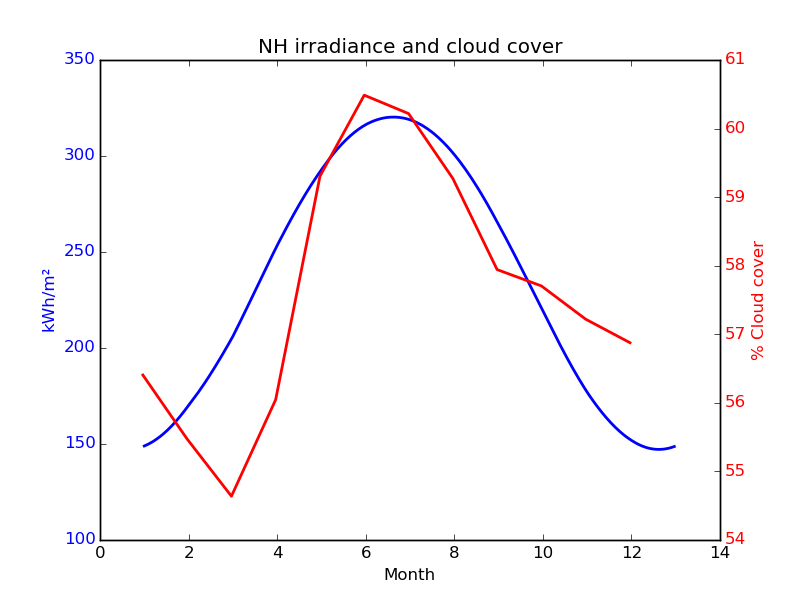
The cloud cover and solar radiation variation over the year in the northern hemisphere.

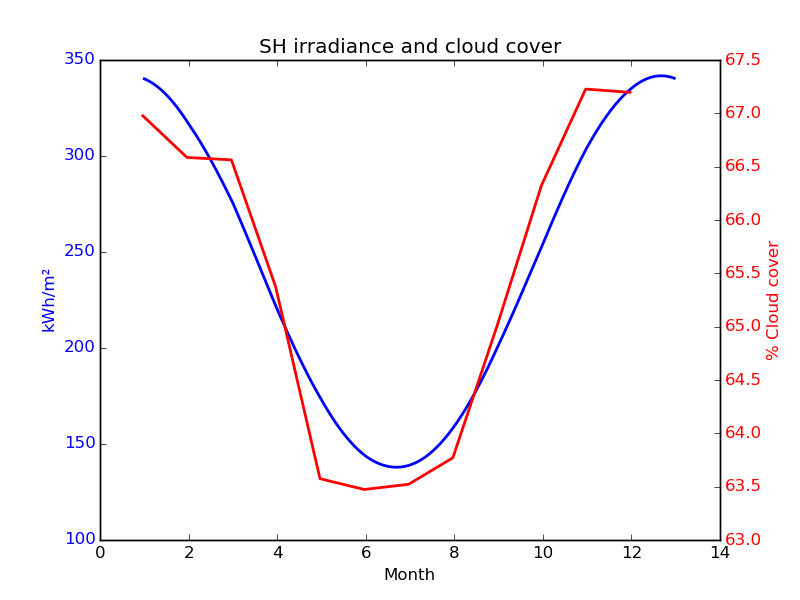
The cloud cover and solar radiation variation over the year in the northern hemisphere.
For the two hemispheres, there is thus a very good correlation between solar radiation and cloud cover. The reason that you can not see any correlation globally is likely that these variations are so much less that they drown out the noise of the large variations in the hemispheres.
It is thus clear that cloud cover increases when solar radiation increases. Then the sun's rays do not reach the earth's surface and then counteracts the clouds changes. The same must therefore apply to the carbon dioxide effect. When it increases, the clouds that counteract the temperature change. Here we have again an example that there is a negative feedback and not a positive feedback that the whole scare propaganda in climate science based.
Note also that the clouds are much larger in the southern hemisphere than it is in the northern hemisphere. The reason for this is that there are more clouds over the oceans, and there's a lot more sea in the southern hemisphere.
Climate sensitivity
It is thus more clouds in the southern hemisphere, and the temperature is also lower. Looking at 1000hPa level (near surface), the average temperature of the southern hemisphere 14.4C and for the northern hemisphere 16.5C. After millions of years of energy storage in the oceans of the southern hemisphere, then the temperature is still much lower. One can not interpret it otherwise than that the oceans hold temperature. A major reason for this must be that the clouds in the southern hemisphere allows the sun's rays do not reach the earth's surface.
In the southern hemisphere, the average cloud cover 65.5% and in the northern hemisphere 57.6%, according to CERES-date. If the average solar radiation is 237W / m2 can then southern hemisphere approximately 7.9% of 237W / m2 = 18.7W / m2 less sun than the Northern Hemisphere. Now this is probably a little high counted for even if the cloud cover is 100%, the clouds themselves to radiate towards the Earth's surface.
The difference in temperature between the southern and northern hemisphere is thus 2.1c and the difference in solar is about 18.7W / m2. It allows every Watt / m2, equivalent to about 0.11 degree. A doubling of carbon dioxide levels will provide approximately 3.7W / m2, it therefore corresponds to approximately 0.4 degrees (climate sensitivity). Now I have probably figured a little low, since the change in insolation probably figured a little high, and there may also be other reasons that the temperature between the hemispheres differ. But it is still very far from the many degrees of climate sensitivity horror forecasts suggest. I have previously calculated the climate sensitivity of about 0.3 degrees by looking at seasonal variations (here).

Share this post

Thursday, August 25, 2016

Bombshell: New study confirms 'solar activity has a direct impact on Earth's cloud cover' important to climate change

A new study confirms "solar variations affect the abundance of clouds in our atmosphere," a solar amplification mechanism which is the basis of Svensmark's theory of cosmo-climatology. 
The solar eruptions are known to shield Earth's atmosphere from cosmic rays. However the new study, published in Journal of Geophysical Research: Space Physics, shows that the global cloud cover is simultaneously reduced, supporting the idea that cosmic rays are important for cloud formation. The eruptions cause a reduction in cloud fraction of about 2 percent corresponding to roughly a billion tonnes of liquid water disappearing from the atmosphere.

As Dr. Roy Spencer notes,

"The most obvious way for warming to be caused naturally is for small, natural fluctuations in the circulation patterns of the atmosphere and ocean to result in a 1% or 2% decrease in global cloud cover. Clouds are the Earth’s sunshade, and if cloud cover changes for any reason, you have global warming — or global cooling."
The IPCC models fail to consider multiple solar amplification mechanisms, including cosmic rays and numerous other amplification mechanisms, thereby ignoring that solar activity can explain the 0.7C global warming since the end of the Little Ice Age in 1850. Solar activity reached a grand maximum in the latter half of the 20th century, and accumulated solar energy (the 'sunspot integral') explains global temperature change since 1900 with greater than 97% statistical significance.  This new paper confirms that solar activity variation can account for a 2% variation in global cloud cover, sufficient to explain the warming of the 20th century and without any consideration of CO2 "radiative forcing."


Solar activity has a direct impact on Earth's cloud cover


Date:
August 25, 2016
Source:
Technical University of Denmark
Summary:
Solar variations affect the abundance of clouds in our atmosphere, a new study suggests. Large eruptions on the surface of the Sun can temporarily shield Earth from so-called cosmic rays which now appear to affect cloud formation.
A team of scientists from the National Space Institute at the Technical University of Denmark (DTU Space) and the Racah Institute of Physics at the Hebrew University of Jerusalem has linked large solar eruptions to changes in Earth's cloud cover in a study based on over 25 years of satellite observations.
The solar eruptions are known to shield Earth's atmosphere from cosmic rays. However the new study, published in Journal of Geophysical Research: Space Physics, shows that the global cloud cover is simultaneously reduced, supporting the idea that cosmic rays are important for cloud formation. The eruptions cause a reduction in cloud fraction of about 2 percent corresponding to roughly a billion tonnes of liquid water disappearing from the atmosphere.
Since clouds are known to affect global temperatures on longer timescales, the present investigation represents an important step in the understanding of clouds and climate variability.
"Earth is under constant bombardment by particles from space called galactic cosmic rays. Violent eruptions at the Sun's surface can blow these cosmic rays away from Earth for about a week. Our study has shown that when the cosmic rays are reduced in this way there is a corresponding reduction in Earth's cloud cover. Since clouds are an important factor in controlling the temperature on Earth our results may have implications for climate change," explains lead author on the study Jacob Svensmark of DTU.
Very energetic particles
These particles generate electrically charged molecules -- ions -- in Earth's atmosphere. Ions have been shown in the laboratory to enhance the formation of aerosols, which can serve as seeds for the formation of the cloud drops that make up a cloud. Whether this actually happens in the atmosphere, or only in the laboratory is a topic that has been investigated and debated for years.
When the large solar eruptions blow away the galactic cosmic rays before they reach Earth they cause a reduction in atmospheric ions of up to about 20 to -30 percent over the course of a week. So if ions affect cloud formation it should be possible to observe a decrease in cloud cover during events when the Sun blows away cosmic rays, and this is precisely what is done in this study.
The so-called 'Forbush decreases' of the cosmic rays have previously been linked to week-long changes in Earth's cloud cover but the effect has been debated at length in the scientific literature. The new study concludes that "there is a real impact of Forbush decreases on cloud microphysics" and that the results support the suggestion that "ions play a significant role in the life-cycle of clouds."
Arriving at that conclusion was, however, a hard endeavor; Very few strong Forbush decreases occur and their effect on cloud formation is expected to be close to the limit of detection using global atmospheric observations measured by satellites and land based stations. Therefore it was of the greatest importance to select the strongest events for study since they had to have the most easily detected effect. Determining this strength required combining data from about 130 stations in combination with atmospheric modeling.
This new method resulted in a list of 26 events in the period of 1987-2007 ranked according to ionization. This ranked list was important for the detection of a signal, and may also shed some light on why previous studies have arrived at varied conclusions, since they have relied on events that were not necessarily ranked high on the list.
Possible long term effect
The effect from Forbush decreases on clouds is too brief to have any impact on long-term temperature changes.
However since clouds are affected by short term changes in galactic cosmic radiation, they may well also be affected by the slower change in Solar activity that happens on scales from tens to hundreds of years, and thus play a role in the radiation budget that determines the global temperature.
The Suns contribution to past and future climate change may thus be larger than merely the direct changes in radiation, concludes the scientists behind the new study.

Story Source:
The above post is reprinted from materials provided by Technical University of Denmark. The original item was written by Morten Garly Andersen. Note: Content may be edited for style and length.

Journal Reference:
  1. J. Svensmark, M. B. Enghoff, N. J. Shaviv, H. Svensmark. The response of clouds and aerosols to cosmic ray decreases. Journal of Geophysical Research: Space Physics, 2016; DOI:10.1002/2016JA022689

Monday, November 18, 2013

NCAR scientist admits IPCC may be wrong on clouds, may have a net cooling effect instead of warming

Cloud expert Dr. Greg Holland, senior scientist at the National Center for Atmospheric Research, says in a Huff Post article today, "The current consensus on this from the IPCC is that the clouds are in the net warming. Not real sure. There is a possibility that the other effects are dominating and they could be cooling. So this is one of those areas that we need to know a lot more." 

Indeed, many peer-reviewed studies find clouds have a net cooling negative-feedback effect, opposite of the claims of the IPCC of a net warming positive-feedback effect. This single erroneous programming assumption of the IPCC climate models, along with an inability to model cloud cover, can alone explain all warming of the 20th century without any influence of greenhouse gases.   

As Dr. Roy Spencer notes,


"The most obvious way for warming to be caused naturally is for small, natural fluctuations in the circulation patterns of the atmosphere and ocean to result in a 1% or 2% decrease in global cloud cover. Clouds are the Earth’s sunshade, and if cloud cover changes for any reason, you have global warming — or global cooling."


Clouds Float Front & Center In Climate Change Narrative (VIDEO)

Posted: 11/18/2013

Most of us learned all about clouds in grade school -- from the different types of clouds there are in the sky to how they form. But for climate scientists, there is much more to learn about clouds -- especially when it comes to the role clouds play in climate change.

Clouds can trap heat in Earth's atmosphere, causing warmer temperatures on the planet's surface. But they also reflect solar radiation, resulting in lower temperatures. This dual role has made it tricky to build reliable models of our changing climate -- and even led some scientists, who are far outside the mainstream, to push back against the large body of evidence showing that climate change is a real problem.

So, what exactly is the overall influence of clouds on climate change and our planet's future? To cut through the fog, I spoke with Dr. Greg Holland, senior scientist at the National Center for Atmospheric Research, for answers.


Watch the video above, and/or click the link below for a transcript. Don't forget to sound off in the comments section at the bottom of the page. Talk nerdy to me!

JACQUELINE HOWARD: Hey everyone. Jacqueline Howard here. All around the world, sophisticated supercomputers are crunching huge amounts of data to create climate models, or simulations, that help us understand how our world is changing. Now, this data includes global temperatures, extreme weather events, rainfall, sea levels, and even wind patterns. Sounds crazy cool, right? But there remains some doubt around one critical component: Clouds. And because of this, some people question the very validity of climate models. As a 2012 article in The New York Times puts it, “clouds’ effect on climate change is last bastion for dissenters.” So, what does that mean? What do mainstream scientists say about clouds and the role they play in climate change? Can we harness clouds to save the planet? For answers, I reached out to the prominent climate expert Dr. Greg Holland. He’s a senior scientist at the National Center for Atmospheric Research in Boulder, Colorado.

DR. GREG HOLLAND: The really important thing about clouds is understanding this very fine interaction between the warming part, and the cooling part, and how that may actually impact future climate. Right now, the scientific consensus is that the warming, in other words the net effect of redistribution of water vapor and the re-radiation of heat back down to the surface, dominates. And unfortunately that’s bad news because if that is true, that accelerates global change rather than helping us mitigate it.

JH: Did you get that? Clouds both heat and cool our planet. That's why some say it’s difficult to predict cloud behavior and the net effect they have on our global climate. But a recent report from the Intergovernmental Panel on Climate Change, or IPCC, hints at a more certain relationship between clouds and our climate.

GH: The current consensus on this from the IPCC is that the clouds are in the net warming. Not real sure. There is a possibility that the other effects are dominating and they could be cooling. So this is one of those areas that we need to know a lot more.

JH: The cooling component is what fuels some of the criticism current climate models receive. See, low-level thick clouds, like stratus clouds, keep us cool by reflecting solar radiation, or they may absorb heat emitted from our planet’s surface and then radiate that heat out into space. But high, thin clouds, like cirrus clouds, primarily keep us warm by absorbing heat emitted from our planet’s surface and then re-radiating that heat back down to us. Another way clouds may warm our planet is by distributing water vapor.

GH: That last one is a critical one because water vapor is the biggest greenhouse gas we have. It’s about 70 to 80 percent of all of the greenhouse warming on the Earth is due to water vapor. [Why the remaining alleged 20% of the greenhouse warming from CO2 indicates that climate sensitivity is only 0.33C to a doubling of CO2 levels]

JH: What if we actually controlled cloud behavior to mitigate global climate change ourselves? Think about it. If low-level clouds cool the planet, what if we artificially whip some up to keep human-induced warming in check?

GH: There are actually very good scientific studies that have looked at this using complex computer models and some fairly advanced theory. If we can increase the size of that bank of cloud, then we can cool the locality, but also, we can increase it enough, and the models have shown this and the theories have shown this, we could increase it enough to be able to have a net cooling effect on the world at large. So there’s one possibility where we could, what is called geoengineering, the climate to use clouds to our advantage.

JH: Clouds for the win! But geoengineering can be risky business. For instance, one proposal is to amp up production of these cooling clouds by what's called cloud brightening. Now, that's when you blast salty mist into the air to speed up formation of water droplets in clouds. But do you think we should be looking up at clouds to combat human-induced climate change here on Earth? Let me know in the comments. Leave your thoughts in the cloud. Talk nerdy to me!


Related:

New paper finds climate models grossly underestimate cooling from clouds