Showing posts sorted by relevance for query medieval period. Sort by date Show all posts

Thursday, August 22, 2013

Review finds the Medieval Warming Period in the Arctic was warmer than the present

A new review by Dr. Craig Idso of the peer-reviewed literature on the Medieval Warm Period in the Arctic concludes, "It is clear that the suite of measurements described in the studies reviewed above continues to indicate that the Arctic - which climate models suggest should be super-sensitive to greenhouse-gas-induced warming - is still not even as warm as it was several centuries ago during portions of the Medieval Warm Period, when there was much less CO2 and methane in the air than there is today, which facts further suggest that the planet's more modest current warmth need not be the result of historical increases in these two trace greenhouse gases."

Medieval Warm Period (Arctic) -- Summary


This review begins with the study of Dahl-Jensen et al. (1998), who used temperature measurements from two Greenland Ice Sheet boreholes to reconstruct the temperature history of this portion of the earth over the past 50,000 years. Their data indicated that after the termination of the glacial period, temperatures steadily rose to a maximum of 2.5°C warmer than at present during the Holocene Climatic Optimum (4,000 to 7,000 years ago). The Medieval Warm Period (MWP) and Little Ice Age (LIA) were also observed in the record, with temperatures 1°C warmer and 0.5-0.7°C cooler than at the time of their writing, respectively. After the Little Ice Age, they report that temperatures once again rose, but that they had "decreased during the last decades," thereby indicating that the MWP in this part of the Arctic was significantly warmer than it was just before the turn of the century.Wagner and Melles (2001) also worked on Greenland, where they extracted a 3.5-m-long sediment core from a lake (Raffels So) on an island (Raffles O) located just off Liverpool Land on the east coast of Greenland, which they analyzed for a number of properties related to the past presence of seabirds there, obtaining a 10,000-year record that tells much about the region's climatic history. Key to the study were biogeochemical data, which, in the words of the two researchers, reflect "variations in seabird breeding colonies in the catchment which influence nutrient and cadmium supply to the lake."

These data revealed sharp increases in the values of the parameters they represented between about 1100 and 700 years before present (BP), indicative of the summer presence of significant numbers of seabirds during that "medieval warm period," as Wagner and Melles described it, which had been preceded by a several-hundred-year period (the Dark Ages Cold Period) with little to no bird presence. And after that "medieval warm period," their data suggested another absence of birds during what they called "a subsequent Little Ice Age," which they said was "the coldest period since the early Holocene in East Greenland."

The Raffels So data also showed signs of a resettlement of seabirds during the last century, as indicated by an increase of organic matter in the lake sediment and confirmed by bird counts. However, values of the most recent measurements of seabird numbers were not as great as those inferred for the earlier Medieval Warm Period, which result indicates that higher temperatures prevailed during much of the period from 1100 to 700 years BP than those that had been observed over the most recent hundred years.
A third Greenland study was conducted by Kaplan et al. (2002), who derived a climatic history of the Holocene by analyzing the physical-chemical properties of sediments obtained from a small lake in the southern sector of Greenland. This work revealed that the interval from 6000 to 3000 years BP was marked by warmth and stability, but that the climate cooled thereafter until its culmination in the Little Ice Age. From 1300-900 years BP, however, there was a partial amelioration during the Medieval Warm Period, which was associated with an approximate 1.5°C rise in temperature.

In a non-Greenland Arctic study, Jiang et al. (2002) analyzed diatom assemblages from a high-resolution core extracted from the seabed of the north Icelandic shelf, which led to their reconstruction of a 4600-year history of summer sea surface temperature at that location. Starting from a maximum value of about 8.1°C at 4400 years BP, the climate was found to have cooled fitfully for about 1700 years and then more consistently over the final 2700 years of the record. The most dramatic departure from this long-term decline was centered on about 850 years BP, during the Medieval Warm Period, when the temperature rose by more than 1°C above the line describing the long-term downward trend to effect an almost complete recovery from the colder temperatures of the Dark Ages Cold Period, after which temperatures continued their descent into the Little Ice Age, ending with a final most recent value of approximately 6.3°C. Hence, their data clearly showed that the Medieval Warm Period in this part of the Arctic was significantly warmer than it is there now.

Moving on, Moore et al. (2001) analyzed sediment cores from Donard Lake, Baffin Island, Canada, producing a 1240-year record of average summer temperatures for this Arctic region. Over the entire period from AD 750-1990, temperatures averaged 2.9°C. However, anomalously warm decades with summer temperatures as high as 4°C occurred around AD 1000 and 1100, while at the beginning of the 13th century, Donard Lake witnessed "one of the largest climatic transitions in over a millennium," as "average summer temperatures rose rapidly by nearly 2°C from 1195-1220 AD, ending in the warmest decade in the record" with temperatures near 4.5°C.

This rapid warming of the 13th century was followed by a period of extended warmth that lasted until an abrupt cooling event occurred around 1375, which made the following decade one of the coldest in the record. This event signaled the onset of the Little Ice Age, which lasted for 400 years, until a gradual warming trend began around 1800, which was followed by a dramatic cooling event in 1900 that brought temperatures back to levels similar to those of the Little Ice Age. This cold regime lasted until about 1950, whereupon temperatures warmed for about two decades but then tended downwards again, all the way to the end of the record in 1990. Thus, in this part of the Arctic, the Medieval Warm Period was also warmer than it is there currently.

The following year, Grudd et al. (2002) assembled tree-ring widths from 880 living, dead, and subfossil northern Swedish pines into a continuous and precisely dated chronology covering the period 5407 BC to AD 1997. The strong association between these data and summer (June-August) mean temperatures of the last 129 years of the period then enabled them to produce a 7400-year history of summer mean temperature for northern Swedish Lapland. The most dependable portion of this record, based upon the number of trees that were sampled, consisted of the last two millennia, which Grudd et al. said "display features of century-timescale climatic variation known from other proxy and historical sources, including a warm 'Roman' period in the first centuries AD and a generally cold 'Dark Ages' climate from about AD 500 to about AD 900." They also noted that "the warm period around AD 1000 may correspond to a so-called 'Mediaeval Warm Period,' known from a variety of historical sources and other proxy records." Last of all, they stated that "the climatic deterioration in the twelfth century can be regarded as the starting point of a prolonged cold period that continued to the first decade of the twentieth century," which "Little Ice Age," in their words, is also "known from instrumental, historical and proxy records." Going back even further in time, the tree-ring record displays several more of these relatively warmer and colder periods. And in a telling commentary on current climate-alarmist claims, they report that "the relatively warm conditions of the late twentieth century do not exceed those reconstructed for several earlier time intervals." In fact, the warmth of many of the earlier warm intervals significantly exceeded the warmth of the late 20th century.

Seppa and Birks (2002) used a recently developed pollen-climate reconstruction model and a new pollen stratigraphy from Toskaljavri - a tree-line lake in the continental sector of northern Fenoscandia (located just above 69°N latitude) - to derive quantitative estimates of annual precipitation and July mean temperature. And as they described it, their reconstructions "agree with the traditional concept of a 'Medieval Warm Period' (MWP) and 'Little Ice Age' in the North Atlantic region (Dansgaard et al., 1975) and in northern Fennoscandia (Korhola et al., 2000)." In addition, they reported there was "a clear correlation between [their] MWP reconstruction and several records from Greenland ice cores," and that "comparisons of a smoothed July temperature record from Toskaljavri with measured borehole temperatures of the GRIP and Dye 3 ice cores (Dahl-Jensen et al., 1998) and the ð18O record from the Crete ice core (Dansgaard et al., 1975) show the strong similarity in timing of the MWP between the records." Last of all, they noted that "July temperature values during the Medieval Warm Period (ca. 1400-1000 cal yr B.P.) were ca. 0.8°C higher than at present," where present means the last six decades of the 20th century.

Noting that temperature changes in high latitudes are (1) sensitive indicators of global temperature changes, and that they can (2) serve as a basis for verifying climate model calculations, Naurzbaev et al. (2002) developed a 2,427-year proxy temperature history for the part of the Taimyr Peninsula of northern Russia that lies between 70°30' and 72°28' North latitude, based on a study of ring-widths of living and preserved larch trees, while further noting that "it has been established that the main driver of tree-ring variability at the polar timber-line [where they conducted their study] is temperature (Vaganov et al., 1996; Briffa et al., 1998; Schweingruber and Briffa, 1996)." And in doing so, they found that "the warmest periods over the last two millennia in this region were clearly in the third [Roman Warm Period], tenth to twelfth [Medieval Warm Period] and during the twentieth [Current Warm Period] centuries."

With respect to the second of these periods, they emphasize that "the warmth of the two centuries AD 1058-1157 and 950-1049 attests to the reality of relative mediaeval warmth in this region." Their data also reveal three other important pieces of information: (1) the Roman and Medieval Warm Periods were both warmer than the Current Warm Period has been to date, (2) the "beginning of the end" of the Little Ice Age was somewhere in the vicinity of 1830, and (3) the Current Warm Period peaked somewhere in the vicinity of 1940.

All of these observations are at odds with what is portrayed in the thousand-year Northern Hemispheric hockeystick temperature history of Mann et al. (1998, 1999) and its thousand-year global extension developed by Mann and Jones (2003), wherein (1) the Current Warm Period is depicted as the warmest such era of the past two millennia, (2) recovery from the Little Ice Age does not begin until after 1910, and (3) the Current Warm Period experiences it highest temperatures in the latter part of the 20th century's final decade.

Advancing two years closer to the present, Knudsen et al. (2004) documented climatic changes over the last 1200 years by means of high-resolution multi-proxy studies of benthic and planktonic foraminiferal assemblages, stable isotopes, and ice-rafted debris found in three sediment cores retrieved from the North Icelandic shelf. This work revealed that "the time period between 1200 and around 7-800 cal. (years) BP, including the Medieval Warm Period, was characterized by relatively high bottom and surface water temperatures," after which "a general temperature decrease in the area marks the transition to ... the Little Ice Age." They also note that "minimum sea-surface temperatures were reached at around 350 cal. BP, when very cold conditions were indicated by several proxies." Thereafter, they report that "a modern warming of surface waters ... is not registered in the proxy data," and that "there is no clear indication of warming of water masses in the area during the last decades," even in sea surface temperatures measured over the period 1948-2002.

Fast-forwarding another two years,Grinsted et al. (2006) developed "a model of chemical fractionation in ice based on differing elution rates for pairs of ions ... as a proxy for summer melt (1130-1990)," based on data obtained from a 121-meter-long ice core they extracted from the highest ice field in Svalbard (Lomonosovfonna: 78°51'53"N, 17°25'30"E), which was "validated against twentieth-century instrumental records and longer historical climate proxies." This history indicated that "in the oldest part of the core (1130-1200), the washout indices [were] more than 4 times as high as those seen during the last century, indicating a high degree of runoff." In addition, they said they had performed regular snow pit studies near the ice core site since 1997 (Virkkunen, 2004) and that "the very warm 2001 summer resulted in similar loss of ions and washout ratios as the earliest part of the core." They then stated that "this suggests that the Medieval Warm Period in Svalbard summer conditions [was] as warm (or warmer) as present-day, consistent with the Northern Hemisphere temperature reconstruction of Moberg et al. (2005)." In addition, they concluded that "the degree of summer melt was significantly larger during the period 1130-1300 than in the 1990s," which likewise suggests that a large portion of the Medieval Warm Period was significantly warmer than the peak warmth (1990s) of the Current Warm Period.

Moving ahead two more years, Besonen et al. (2008) derived thousand-year histories of varve thickness and sedimentation accumulation rate for Canada's Lower Murray Lake (81°20'N, 69°30'W), which is typically covered for about eleven months of each year by ice that reaches a thickness of 1.5 to 2 meters at the end of each winter. With respect to these parameters, they write - citing seven other studies - that "field-work on other High Arctic lakes clearly indicates that sediment transport and varve thickness are related to temperatures during the short summer season that prevails in this region, and we have no reason to think that this is not the case for Lower Murray Lake."

So what did they find? As the six scientists describe it, the story told by both the varve thickness and sediment accumulation rate histories of Lower Murray Lake is that "the twelfth and thirteenth centuries were relatively warm," and in this regard we note their data indicate that Lower Murray Lake and its environs were often much warmer during this time period (AD 1080-1320) than they were at any point in the 20th century, which has also been shown to be the case for Donard Lake (66.25°N, 62°W) by Moore et al. (2001).

Working concurrently on a floating platform in the middle of a small lake (Hjort So) on an 80-km-long by 10.5-km-wide island (Store Koldewey) just off the coast of Northeast Greenland, Wagner et al. (2008) recovered two sediment cores of 70 and 252 cm length, the incremental portions of which they analyzed for grain-size distribution, macrofossils, pollen, diatoms, total carbon, total organic carbon, and several other parameters, the sequences of which were dated by accelerator mass spectrometry, with radiocarbon ages translated into calendar years before present. This work revealed, as they describe it, an "increase of the productivity-indicating proxies around 1,500-1,000 cal year BP, corresponding with the medieval warming," while adding that "after the medieval warming, renewed cooling is reflected in decreasing amounts of total organic carbon, total diatom abundance, and other organisms, and a higher abundance of oligotrophic to meso-oligotrophic diatom taxa." And, as they continue, "this period, the Little Ice Age, was the culmination of cool conditions during the Holocene and is documented in many other records from East and Northeast Greenland, before the onset of the recent warming [that] started ca. 150 years ago."

In addition to the obvious importance of their finding evidence for the Medieval Warm Period, the six researchers' statement that the Little Ice Age was the culmination, or most extreme sub-set, of cool conditions during the Holocene, suggests that it would not be at all unusual for such a descent into extreme coolness to be followed by some extreme warming, which further suggests there is nothing unusual about the degree of subsequent warming experienced over the 20th century, especially in light of the fact that the earth has not yet achieved the degree of warmth that held sway over most of the planet throughout large portions of that prior high-temperature period.

One year later, based on the use of a novel biomarker (IP25), which they described as a mono-unsaturated highly-branched isoprenoid that is synthesized by sea ice diatoms that have been shown to be stable in sediments below Arctic sea ice, Vareet al. (2009) used this new climatic reconstruction tool - together with "proxy data obtained from analysis of other organic biomarkers, stable isotope composition of bulk organic matter, benthic foraminifera, particle size distributions and ratios of inorganic elements" - to develop a spring sea ice record for that part of the central Canadian Arctic Archipelago. And in doing so, they discovered evidence for a decrease in spring sea ice between approximately 1200 and 800 years before present (BP), which they associated with "the so-called Mediaeval Warm Period."

Contemporaneously, Norgaard-Pedersen and Mikkelsen (2009), working with a sediment core retrieved in August 2006 from the deepest basin of Narsaq Sound in southern Greenland, analyzed several properties of the materials thus obtained from which they were able to infer various "glacio-marine environmental and climatic changes" that had occurred over the prior 8,000 years. This work revealed the existence of two periods (2.3-1.5 ka and 1.2-0.8 ka) that appeared to coincide roughly with the Roman and Medieval Warm Periods, while they identified the colder period that followed the Medieval Warm Period as the Little Ice Age and the colder period that preceded it as the Dark Ages Cold Period. And citing the works of Dahl-Jensen et al. (1998), Andresen et al. (2004), Jensen et al. (2004) and Lassen et al. (2004), the two Danish scientists said that the cold and warm periods identified in those researchers' studies "appear to be more or less synchronous to the inferred cold and warm periods observed in the Narsaq Sound record," providing ever more evidence for the reality of thenaturally-occurring phenomenon that governs this millennial-scale oscillation of climate.

One year later, Vinther et al. (2010) analyzed 20 ice core records from 14 different sites, all of which stretched at least 200 years back in time, as well as near-surface air temperature data from 13 locations along the southern and western coasts of Greenland that covered approximately the same time interval (1784-2005), plus a similar temperature data set from northwest Iceland (said by the authors to be employed "in order to have some data indicative of climate east of the Greenland ice sheet"). This work demonstrated that winter ð18O was "the best proxy for Greenland temperatures." And based on that determination and working with three longer ice core ð18O records (DYE-3, Crete and GRIP), they developed a temperature history that extended more than 1400 years back in time.

This history revealed, in the words of the seven scientists, that "temperatures during the warmest intervals of the Medieval Warm Period" - which they defined as occurring some 900 to 1300 years ago - "were as warm as or slightly warmer than present day Greenland temperatures." As for what this result implies, they state that further warming of present day Greenland climate "will result in temperature conditions that are warmer than anything seen in the past 1400 years," which, of course, has not happened yet. Furthermore, Vinther et al. readily acknowledge that the independent "GRIP borehole temperature inversion suggests that central Greenland temperatures are still somewhat below the high temperatures that existed during the Medieval Warm Period."

About this same time, Kobashi et al. (2010) had a paper published in which they had written that "in Greenland, oxygen isotopes of ice (Stuiver et al., 1995) have been extensively used as a temperature proxy, but the data are noisy and do not clearly show multi-centennial trends for the last 1,000 years in contrast to borehole temperature records that show a clear 'Little Ice Age' and 'Medieval Warm Period' (Dahl-Jensen et al., 1998)." However, they went on to note that nitrogen (N) and argon (Ar) isotopic ratios - 15N/14N and 40Ar/36Ar, respectively - can be used to construct a temperature record that "is not seasonally biased, and does not require any calibration to instrumental records, and resolves decadal to centennial temperature fluctuations."

After describing the development of the new approach, they used it to construct a history of the last thousand years of central Greenland surface air temperature, based on values of the isotopic ratios of nitrogen and argon previously derived by Kobashi et al. (2008) from air bubbles trapped in the GISP2 ice core that had been extracted from central Greenland, obtaining the result depicted in the figure below.
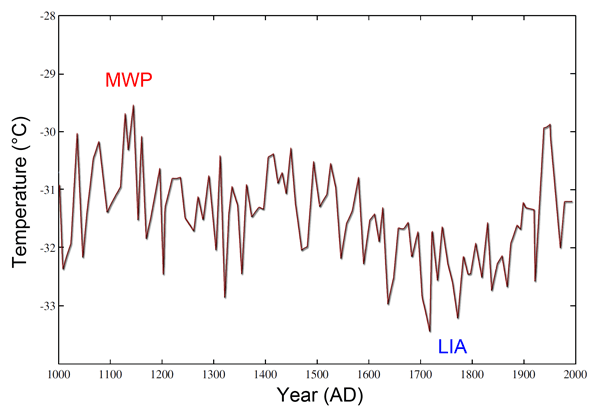


Central Greenland surface temperature reconstruction for the last millennium. Adapted from Kobashi et al. (2010).


This figure depicts the central Greenland surface temperature reconstruction produced by the six scientists; and as best as can be determined from this representation, the peak temperature of the latter part of the Medieval Warm Period - which actually began some time prior to the start of their record, as demonstrated by the work of Dansgaard et al. (1975), Jennings and Weiner (1996), Johnsen et al. (2001) and Vinther et al. (2010) - was approximately 0.33°C greater than the peak temperature of the Current Warm Period, and about 1.67°C greater than the temperature of the last decades of the 20th century.

One year closer to the present, and noting that the varve thicknesses of annually-laminated sediments laid down by Hvitarvatn, a proglacial lake in the central highlands of Iceland, is controlled by the rate of glacial erosion and efficiency of subglacial discharge from the adjacent Langjokull ice cap, Larsen et al. (2011) employed a suite of environmental proxies contained within those sediments to reconstruct the region's climate variability and glacial activity over the past 3000 years, which proxies included varve thickness, varve thickness variance, ice-rafted debris, total organic carbon (mass flux and bulk concentration), and the C:N ratio of sedimentary organic matter. And when all was said and done, this effort indicated that "all proxy data reflect a shift toward increased glacial erosion and landscape destabilization from ca 550 AD to ca 900 AD and from ca 1250 AD to ca 1950 AD, separated by an interval of relatively mild conditions," and they state that "the timing of these intervals coincides with the well-documented periods of climate change commonly known as the Dark Ages Cold Period, the Medieval Warm Period, and the Little Ice Age."
In the case of the Medieval Warm Period, they additionally note that "varve thickness decreases after 950 AD and remains consistently low through Medieval time with slightly thinner annual laminations than for any other multi-centennial period in the past 3000 years," which suggests that the MWP was the warmest period of the past three millennia, while they say that "the LIA was the most severe multi-centennial cold interval of the late Holocene" and "likely since regional deglaciation 10,000 years ago."

Finally, for those desiring additional brief reports on the Medieval Warm Period in the Arctic, go to www.co2science.org and search for Hill et al. (2001), Joynt and Wolfe (2001), Hantemirov and Shiyatov (2002), Andersson et al. (2003), Helama et al. (2005), Mazepa (2005), Weckstrom et al. (2006), Jiang et al. (2007), Zabenskie and Gajewski (2007), Grudd (2008), Justwan et al. (2008), Scire et al. (2008), Axford et al. (2009), Bjune et al. (2009), Cook et al. (2009), Fortin and Gajewski (2010), Büntgen et al. (2011), Divine et al. (2011), Ran et al. (2011), Velle et al. (2011), D'Andrea et al. (2012) and Esperet al. (2012), full references for which articles are included in the Reference section below.

In concluding this summary, it is clear that the suite of measurements described in the studies reviewed above continues to indicate that the Arctic - which climate models suggest should be super-sensitive to greenhouse-gas-induced warming - is still not even as warm as it was several centuries ago during portions of the Medieval Warm Period, when there was much less CO2 and methane in the air than there is today, which facts further suggest that the planet's more modest current warmth need not be the result of historical increases in these two trace greenhouse gases.

References
Andersson, C., Risebrobakken, B., Jansen, E. and Dahl, S.O. 2003. Late Holocene surface ocean conditions of the Norwegian Sea (Voring Plateau). Paleoceanography 18: 10.1029/2001PA000654.
Andresen, C.S., Bjorck, S., Bennike, O. and Bond, G. 2004. Holocene climate changes in southern Greenland: evidence from lake sediments. Journal of Quaternary Science 19: 783-793.
Axford, Y., Geirsdottir, A., Miller, G.H. and Langdon, P.G. 2009. Climate of the Little Ice Age and the past 2000 years in northeast Iceland inferred from chironomids and other lake sediment proxies. Journal of Paleolimnology 41: 7-24.
Besonen, M.R., Patridge, W., Bradley, R.S., Francus, P., Stoner, J.S. and Abbott, M.B. 2008. A record of climate over the last millennium based on varved lake sediments from the Canadian High Arctic. The Holocene 18: 169-180.
Bjune, A.E., Seppa, H. and Birks, H.J.B. 2009. Quantitative summer-temperature reconstructions for the last 2000 years based on pollen-stratigraphical data from northern Fennoscandia. Journal of Paleolimnology 41: 43-56.
Briffa, K.R., Schweingruber, F.H., Jones, P.D., Osborn, T.J., Shiyatov, S.G. and Vaganov, E.A. 1998. Reduced sensitivity of recent tree-growth to temperature at high northern latitudes. Nature 391: 678-682.
Büntgen, U., Raible, C.C., Frank, D., Helama, S., Cunningham, L., Hofer, D., Nievergelt, D., Verstege, A., Timonen, M., Stenseth, N.C. and Esper, J. 2011. Causes and consequences of past and projected Scandinavian summer temperatures, 500-2100 AD. PLoS ONE 6: 10.1371/journal.pone.0025133.
Cook, T.L., Bradley, R.S., Stoner, J.S. and Francus, P. 2009. Five thousand years of sediment transfer in a high arctic watershed recorded in annually laminated sediments from Lower Murray Lake, Ellesmere Island, Nunavut, Canada. Journal of Paleolimnology 41: 77-94.
Dahl-Jensen, D., Mosegaard, K., Gundestrup, N., Clow, G.D., Johnsen, S.J., Hansen, A.W. and Balling, N. 1998. Past temperatures directly from the Greenland Ice Sheet. Science 282: 268-271.
D'Andrea, W.J., Vaillencourt, D.A., Balascio, N.L., Werner, A., Roof, S.R., Retelle, M. and Bradley, R.S. 2012. Mild Little Ice Age and unprecedented recent warmth in an 1800 year lake sediment record from Svalbard. Geology 40: 1007-1010.
Dansgaard, W., Johnsen, S.J., Gundestrup, N., Clausen, H.B. and Hammer, C.U. 1975. Climatic changes, Norsemen and modern man. Nature 255: 24-28.
Divine, D., Isaksson, E., Martma, T., Meijer, H.A.J., Moore, J., Pohjola, V., van de Wal, R.S.W. and Godtliebsen, F. 2011. Thousand years of winter surface air temperature variations in Svalbard and northern Norway reconstructed from ice-core data. Polar Research 30: 10.3402/polar.v30i0.7379.
Esper, J., Büntgen, U., Timonen, M. and Frank, D.C. 2012. Variability and extremes of northern Scandinavian summer temperatures over the past two millennia. Global and Planetary Change 88-89: 1-9.
Fortin, M.-C. and Gajewski, K. 2010. Holocene climate change and its effect on lake ecosystem production on Northern Victoria island, Canadian Arctic. Journal of Paleolimnology 43: 219-234.
Grinsted, A., Moore, J.C., Pohjola, V., Martma, T. and Isaksson, E. 2006. Svalbard summer melting, continentality, and sea ice extent from the Lomonosovfonna ice core. Journal of Geophysical Research 111: 10.1029/2005JD006494.
Grudd, H. 2008. Tornetrask tree-ring width and density AD 500-2004: a test of climatic sensitivity and a new 1500-year reconstruction of north Fennoscandian summers. Climate Dynamics: 10.1007/s00382-0358-2.
Grudd, H., Briffa, K.R., Karlen, W., Bartholin, T.S., Jones, P.D. and Kromer, B. 2002. A 7400-year tree-ring chronology in northern Swedish Lapland: natural climatic variability expressed on annual to millennial timescales. The Holocene 12: 657-665.
Hantemirov, R.M. and Shiyatov, S.G. 2002. A continuous multimillennial ring-width chronology in Yamal, northwestern Siberia.The Holocene 12: 717-716.
Helama, S., Timonen, M., Holopainen, J., Ogurtsov, M.G., Mielikainen, K., Eronen, M., Lindholm, M. and Merilainen, J. 2009. Summer temperature variations in Lapland during the Medieval Warm Period and the Little Ice Age relative to natural instability of thermohaline circulation on multi-decadal and multi-centennial scales. Journal of Quaternary Science 24: 450-456.
Hiller, A., Boettger, T. and Kremenetski, C. 2001. Medieval climatic warming recorded by radiocarbon dated alpine tree-line shift on the Kola Peninsula, Russia. The Holocene 11: 491-497.
Jennings, A.E. and Weiner, N.J. 1996. Environmental change in eastern Greenland during the last 1300 years: evidence from foraminifera and lithofacies in Nansen Fjord, 68°N. The Holocene 6: 179-191.
Jensen, K.G., Kuijpers, A., Koc, N. and Heinemeier, J. 2004. Diatom evidence of hydrographic changes and ice conditions in Igaliku Fjord, South Greenland, during the past 1500 years. The Holocene 14: 152-164.
Jiang, H., Ren, J., Knudsen, K.L., Eiriksson, J. and Ran, L.-H. 2007. Summer sea-surface temperatures and climate events on the North Icelandic shelf through the last 3000 years. Chinese Science Bulletin 52: 789-796.
Jiang, H., Seidenkrantz, M-S., Knudsen, K.L. and Eiriksson, J. 2002. Late-Holocene summer sea-surface temperatures based on a diatom record from the north Icelandic shelf. The Holocene 12: 137-147.
Johnsen, S.J., Dahl-Jensen, D., Gundestrup, N., Steffensen, J.P., Clausen, H.B., Miller, H., Masson-Delmotte, V., Sveinbjörnsdottir, A.E. and White, J. 2001. Oxygen isotope and palaeotemperature records from six Greenland ice-core stations: Camp Century, Dye-3, GRIP, GISP2, Renland and NorthGRIP. Journal of Quaternary Science 16: 299-307.
Joynt III, E.H. and Wolfe, A.P. 2001. Paleoenvironmental inference models from sediment diatom assemblages in Baffin Island lakes (Nunavut, Canada) and reconstruction of summer water temperature. Canadian Journal of Fisheries and Aquatic Sciences 58: 1222-1243.
Justwan, A., Koc, N. and Jennings, A.E. 2008. Evolution of the Irminger and East Icelandic Current systems through the Holocene, revealed by diatom-based sea surface temperature reconstructions. Quaternary Science Reviews 27: 1571-1582.
Kaplan, M.R., Wolfe, A.P. and Miller, G.H. 2002. Holocene environmental variability in southern Greenland inferred from lake sediments. Quaternary Research 58: 149-159.
Kobashi, T., Severinghaus, J.P., Barnola, J.-M., Kawamura, K., Carter, T. and Nakaegawa, T. 2010. Persistent multi-decadal Greenland temperature fluctuation through the last millennium. Climatic Change 100: 733-756.
Kobashi, T., Severinghaus, J.P. and Kawamura, K. 2008. Argon and nitrogen isotopes of trapped air in the GISP2 ice core during the Holocene epoch (0-11,600 B.P.): methodology and implications for gas loss processes. Geochimica et Cosmochimica Acta 72: 4675-4686.
Knudsen, K.L., Eiriksson, J., Jansen, E., Jiang, H., Rytter, F. and Gudmundsdottir, E.R. 2004. Palaeoceanographic changes off North Iceland through the last 1200 years: foraminifera, stable isotopes, diatoms and ice rafted debris. Quaternary Science Reviews 23: 2231-2246.
Korhola, A., Weckstrom, J., Holmstrom, L. and Erasto, P. 2000. A quantitative Holocene climatic record from diatoms in northern Fennoscandia. Quaternary Research 54: 284-294.
Larsen, D.J., Miller, G.H., Geirsdottir, A. and Thordarson, T. 2011. A 3000-year varved record of glacier activity and climate change from the proglacial lake Hvitarvatn, Iceland. Quaternary Science Reviews 30: 2715-2731.
Lassen, S.J., Kuijpers, A., Kunzendorf, H., Hoffmann-Wieck, G., Mikkelsen, N. and Konradi, P. 2004. Late Holocene Atlantic bottom water variability in Igaliku Fjord, South Greenland, reconstructed from foraminifera faunas. The Holocene 14: 165-171.
Mann, M.E., Bradley, R.S. and Hughes, M.K. 1998. Global-scale temperature patterns and climate forcing over the past six centuries. Nature 392: 779-787.
Mann, M.E., Bradley, R.S. and Hughes, M.K. 1999. Northern Hemisphere temperatures during the past millennium: Inferences, uncertainties, and limitations. Geophysical Research Letters 26: 759-762.
Mann, M.E. and Jones, P.D. 2003. Global surface temperatures over the past two millennia. Geophysical Research Letters30: 10.1029/2003GL017814.
Mazepa, V.S. 2005. Stand density in the last millennium at the upper tree-line ecotone in the Polar Ural Mountains. Canadian Journal of Forest Research 35: 2082-2091.
Moberg, A., Sonechkin, D.M., Holmgren, K., Datsenko, N.M. and Karlenm, W. 2005. Highly variable Northern Hemisphere temperatures reconstructed from low- and high-resolution proxy data. Nature 433: 613-617.
Moore, J.J., Hughen, K.A., Miller, G.H. and Overpeck, J.T. 2001. Little Ice Age recorded in summer temperature reconstruction from varved sediments of Donard Lake, Baffin Island, Canada. Journal of Paleolimnology 25: 503-517.
Naurzbaev, M.M., Vaganov, E.A., Sidorova, O.V. and Schweingruber, F.H. 2002. Summer temperatures in eastern Taimyr inferred from a 2427-year late-Holocene tree-ring chronology and earlier floating series. The Holocene 12: 727-736.
Norgaard-Pedersen, N. and Mikkelsen, N. 2009. 8000 year marine record of climate variability and fjord dynamics from Southern Greenland. Marine Geology 264: 177-189.
Ran, L., Jiang, H., Knudsen, K.L. and Eiriksson, J. 2011. Diatom-based reconstruction of palaeoceanographic changes on the North Icelandic shelf during the last millennium. Palaeogeography, Palaeoclimatology, Palaeoecology 302: 109-119.
Schweingruber, F.H. and Briffa, K.R. 1996. Tree-ring density network and climate reconstruction. In: Jones, P.D., Bradley, R.S. and Jouzel, J. (Eds.), Climatic Variations and Forcing Mechanisms of the Last 2000 Years, NATO ASI Series 141. Springer-Verlag, Berlin, Germany, pp. 43-66.
Sicre, M.-A., Jacob, J., Ezat, U., Rousse, S., Kissel, C., Yiou, P., Eiriksson, J., Knudsen, K.L., Jansen, E. and Turon, J.-L. 2008. Decadal variability of sea surface temperatures off North Iceland over the last 2000 years. Earth and Planetary Science Letters 268: 137-142.
Seppa, H. and Birks, H.J.B. 2002. Holocene climate reconstructions from the Fennoscandian tree-line area based on pollen data from Toskaljavri. Quaternary Research 57: 191-199.
Stuiver, M., Grootes, P.M. and Brazunias, T.F. 1995. The GISP2 ð18O climate record of the past 16,500 years and the role of the sun, ocean, and volcanoes. Quaternary Research 44: 341-354.
Vaganov, E.A., Shiyatov, S.G. and Mazepa,V.S. 1996. Dendroclimatic Study in Ural-Siberian Subarctic. Nauka, Novosibirsk, Russia.
Vare, L.L., Masse, G., Gregory, T.R., Smart, C.W. and Belt, S.T. 2009. Sea ice variations in the central Canadian Arctic Archipelago during the Holocene. Quaternary Science Reviews 28: 1354-1366.
Velle, G., Kongshavn, K. and Birks, H.J.B. 2011. Minimizing the edge-effect in environmental reconstructions by trimming the calibration set: Chironomid-inferred temperatures from Spitsbergen. The Holocene 21: 417-430.
Vinther, B.M., Jones, P.D., Briffa, K.R., Clausen, H.B., Andersen, K.K., Dahl-Jensen, D. and Johnsen, S.J. 2010. Climatic signals in multiple highly resolved stable isotope records from Greenland. Quaternary Science Reviews 29: 522-538.
Virkkunen, K. 2004. Snowpit Studies in 2001-2002 in Lomonosovfonna, Svalbard. M.S. Thesis, University of Oulu, Oulu, Finland.
Wagner, B., Bennike, O., Bos, J.A.A., Cremer, H., Lotter, A.F. and Melles, M. 2008. A multidisciplinary study of Holocene sediment records from Hjort So on Store Koldewey, Northeast Greenland. Journal of Paleolimnology 39: 381-398.
Wagner, B. and Melles, M. 2001. A Holocene seabird record from Raffles So sediments, East Greenland, in response to climatic and oceanic changes. Boreas 30: 228-239.
Weckstrom, J., Korhola, A., Erasto, P. and Holmstrom, L. 2006. Temperature patterns over the past eight centuries in Northern Fennoscandia inferred from sedimentary diatoms. Quaternary Research 66: 78-86.
Zabenskie, S. and Gajewski, K. 2007. Post-glacial climatic change on Boothia Peninsula, Nunavut, Canada. Quaternary Research 68: 261-270.

Tuesday, February 18, 2014

How the climate fraudsters tried to get rid of the Medieval Warm Period

The Medieval Warm Period - A global Phenomenon

Reblogged from A Skeptical Mind:

Unprecedented?
As explained in the article “The rise and fall of the Hockey Stick” a central and critical plank of the alarmist global warming case is that the current phase of warming is unprecedented. The current phase of warming actually started around the beginning of the 20th century when the earth started to finally come out of the the Little Ice Age which had lasted from 1600 to 1850 when the temperature had fallen to the lowest point since the last ice age.

Since the the current warming started it has occurred in two distinct phases. The first period of warming that started around 1900 lasted up until around 1950, there was then a period of about 30 years when temperatures dropped back a bit and then around 1975 the most recent period of warming started. This latest period of warming may have come to an end as there has been no warming since around 1998 and some evidence of a temperature decline.

The CO2 hypothesis needs to show that the last period of warming since 1975 is somehow unusual or unprecedented, so unusual that a special mechanism must be at work, i.e. rising CO2 forcing up temperatures.

The claim that the latest phase of warming is unprecedented cannot rest on the rate of warming as a similar rate of warming happened in the early decades of the 20th century when CO2 levels were much lower and not much higher than the general natural background.

So in order to show that the last three or four decades have indeed been unprecedented it is very important to the CO2 hypothesis to be able to prove that the amount of warming is somehow very unusual. That the earth is warmer than is has been in the past.

This argument, that the earth is warmer than it has been and that in itself this is unusual, is weak because no one disputes that the earth was actually significantly warmer than now for most of the early and mid Holocene – the so called Climatic Optimum ( see the article “Happy Holocene“) between 5000 and 9000 years ago. This warmth of the early Holocene not only undermines the claims that the current climate is somehow unique but it also undermines the claim that any further warming will somehow trigger a disastrous runaway process because clearly this never happened in the past when temperatures pushed several degrees above the temperatures of today.

Nevertheless it is very important for the supporters of the CO2 hypothesis that something special about today’s climate can be identified and this search for something unprecedented has focussed on the claim that it is hotter now than at any time in the last 1000 years. This is a good campaigning position as for most people a 1000 years sounds a long time and you can say catchy things like this year or decade is “hottest of the millennium”.

The problem with focusing on the claim that today’s temperatures are the hottest for a 1000 years is that until the rise of the Hockey Stick model of recent climate (see the article “The rise and fall of the Hockey Stick“) it was universally understood that there had been a period called the Medieval Warm Period, which lasted roughly from AD 800 to AD 1300, when temperatures had actually been at least as warm as today and probably a bit warmer. To have such a warm period occurring so recently, a period when the climate seemed very like today’s climate, would utterly undermine the claim that today’s climate was some how special.

This meant that a central thrust of CO2 supporters has been to sideline, undermine and ultimately discredit any notion that there had been a Medieval Warm Period. The main tool for doing this has been the Hockey Stick analysis which is fully explored here.

This need to get rid of the Medieval Warm Period is occasionally made very explicit.

In 1995 David Deming a scientist from the University of Oklahoma published work he had done on reconstructing past temperatures temperatures based on bore hole studies in North America. Although he had found warming Deming remains unconvinced by the CO2 hypothesis. His article did however have the crucial word “warming” in it and he believes that because of this he was mistakenly identified as a CO2 hypothesis supporter and he was contacted Jay Overpeck, a senior scientific advisor to the IPCC who said in his email to Professor Deming, “We have to get rid of the Medieval Warm Period”.

In one of the Climategate emails sent by Michael Mann, the author of the original Hockey Stick study, he writes to Phil Jones the head of the Climate Research Unit at East Anglia, about the notion of expanding CRU charts to two millennia in an effort to “try to “contain” the putative “MWP.”

A recent controversy has arisen about the activities of William Connolley, an climate scientist and leading Green Party politician in the UK who has attempted to systematically censor Wikipedia in order to bring it into line with the CO2 alarmist position. Connelly is responsible for deleting and rewriting literally thousands of Wikipedia article relating to climate change in an extremely contentious fashion and has recently been blocked from making further changes. In February 2003 he began erasing all references to the Little Ice Age and in October 2003 he deleted all references to the Medieval Warm Period. Connelly wasn’t alone in this attempt to censor Wikipedia, a process that continues to this day, but he was super active. Wikipedia remains an intellectual battle ground.

So the CO2 alarmists must try to eliminate the Medieval Warm Period.

Except the real history wouldn’t go away and the pesky Medieval Warm Period keeps coming back to bite the CO2 crowd.

Below is a very long series of charts taken from a large number of scientific papers using a wide range of techniques to measure the past temperature in a lot of different regions from all around the globe. They all clearly show the Medieval Warm Period.

So say hello to an old friend, look at these charts and rediscover the Medieval Warm Period.

Click on each chart to see its source and read the original paper containing the data.

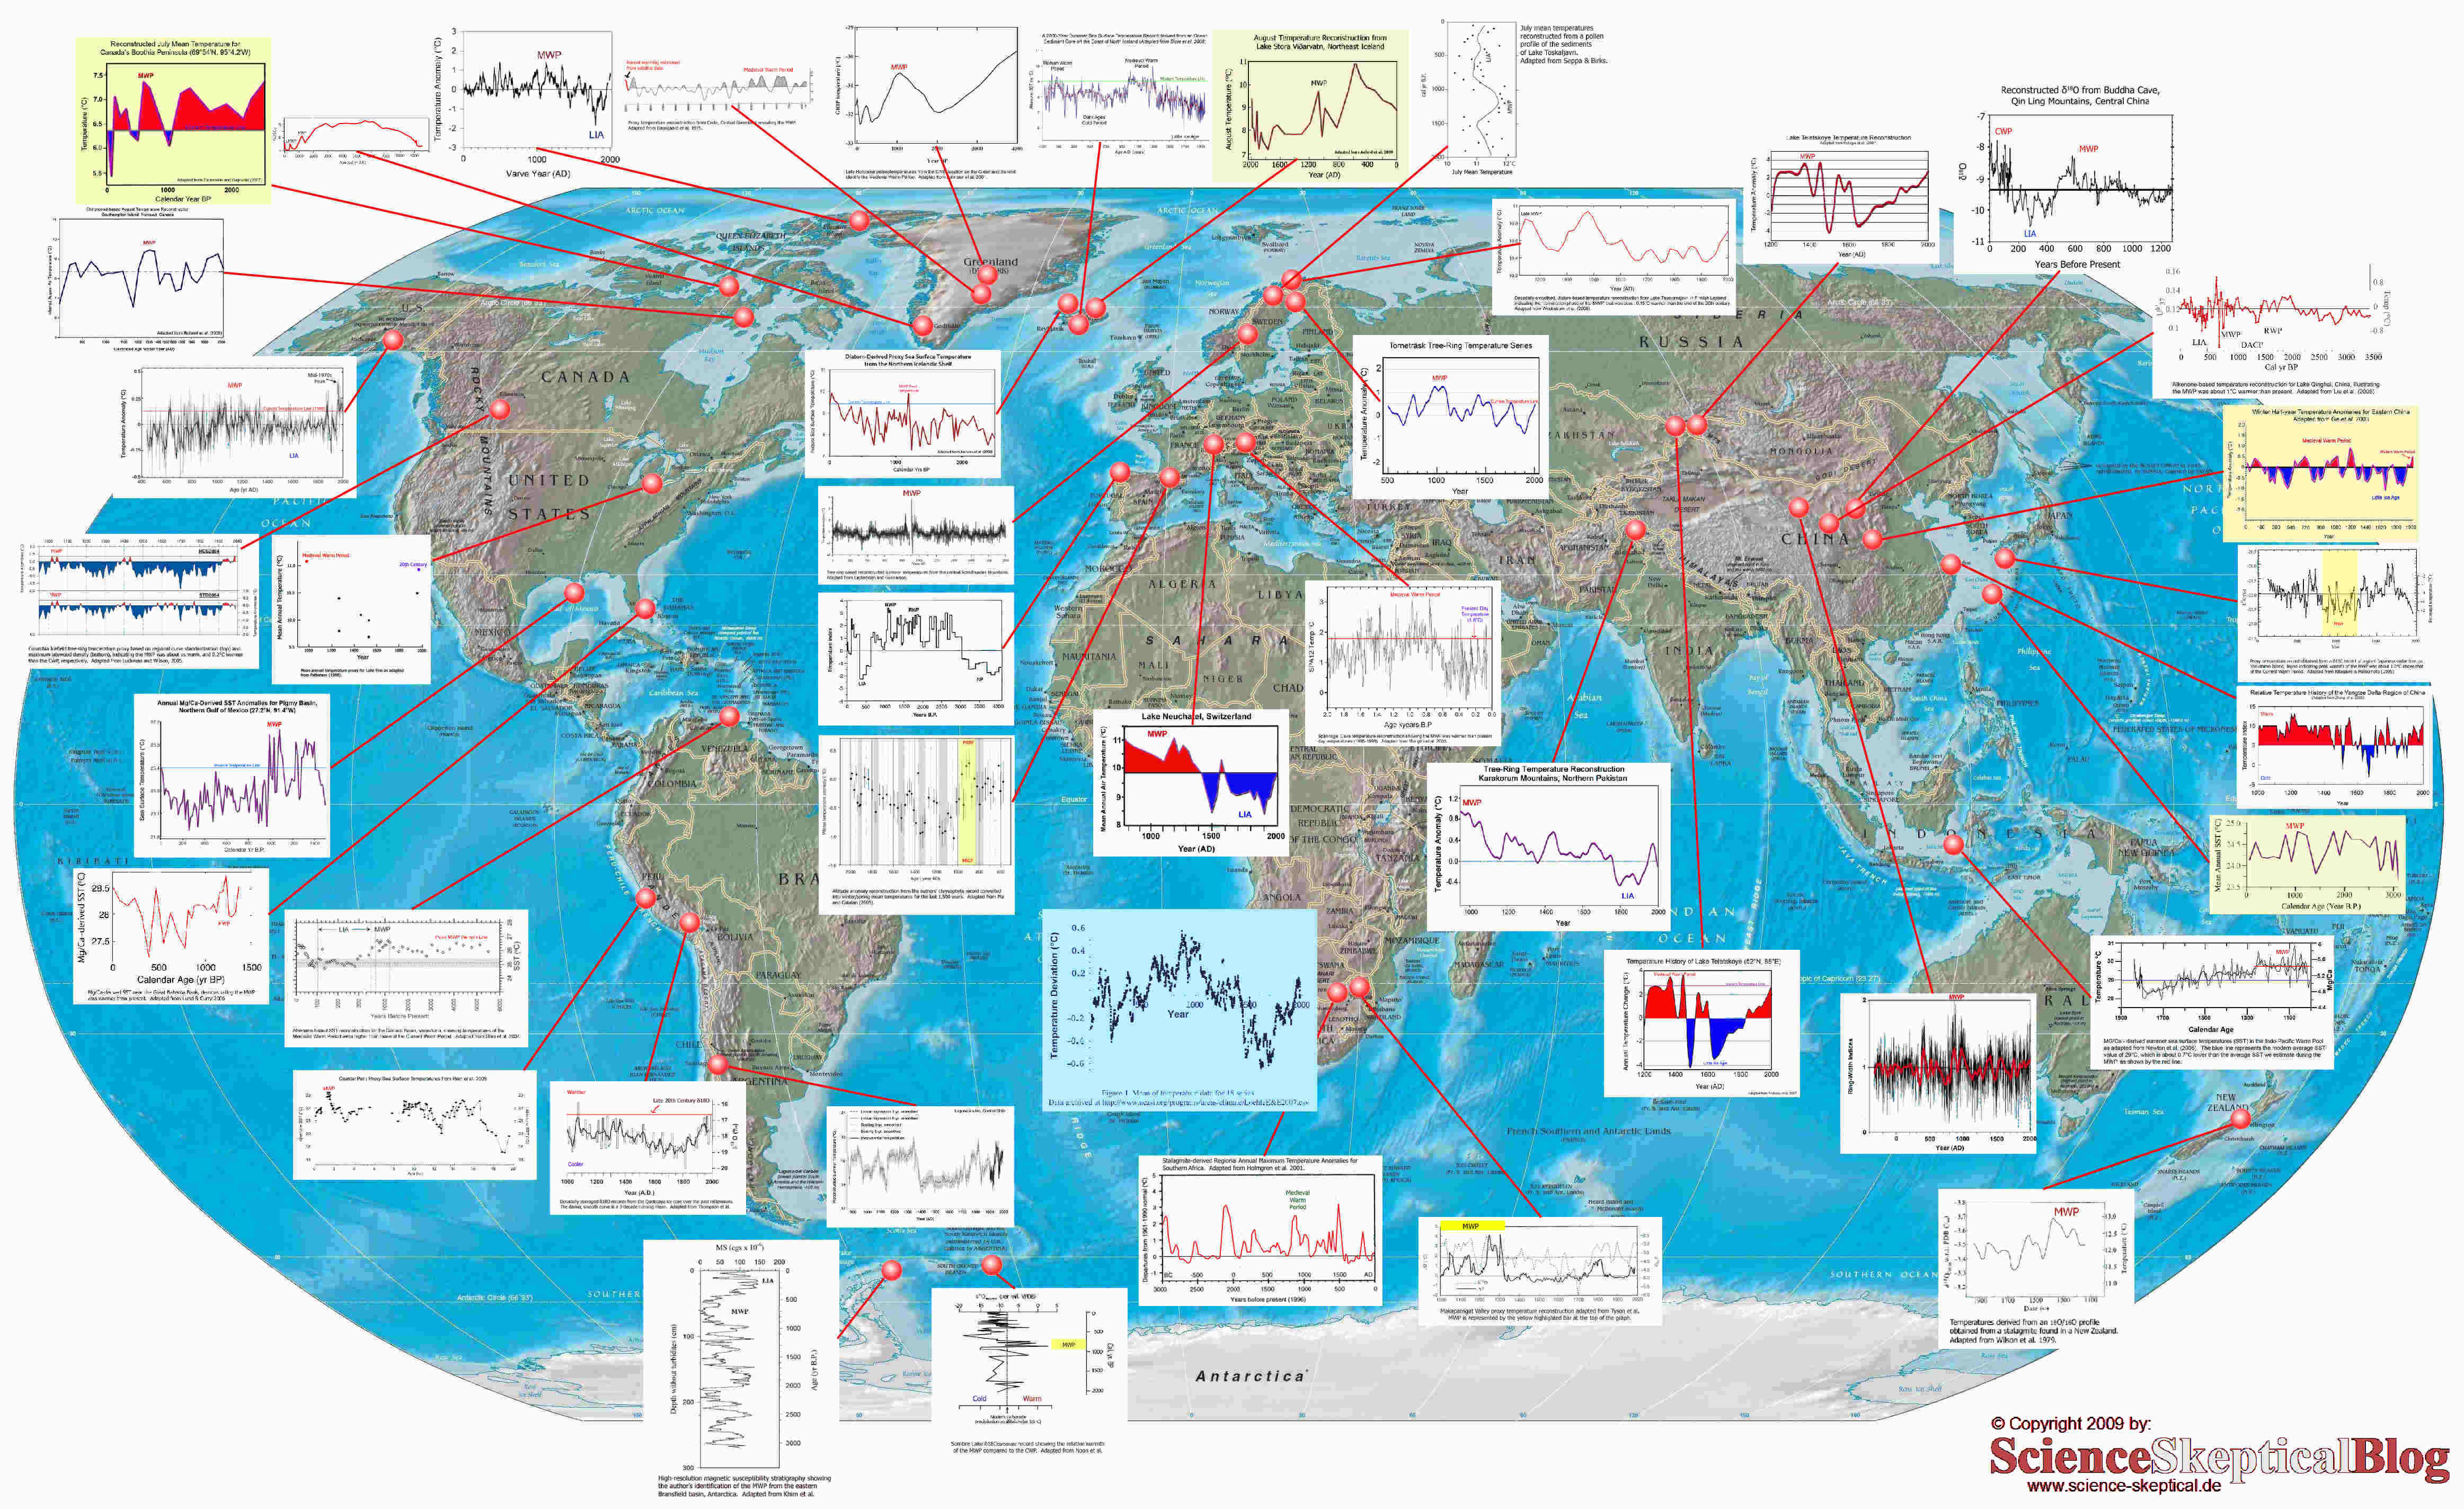
Click here to see a map showing the geographical location of each study and the web site with the original source material for this article.


Unprecedented? – Part 2

As explained in the article “The rise and fall of the Hockey Stick” a central and critical plank of the alarmist global warming case is that the current phase of warming is unprecedented. One aspect of proving that the warming of the last three decades has been unusual and unique, and therefore unnatural, has been to try to prove that recent temperatures have been higher than in the recent past and the article “Unprecedented?” explained how this required that the Medieval Warm Period be eliminated from the climate history.

The other argument that the the climate alarmist have put forward to try to show that the recent temperature record has been unusual has been to argue that the rate of change of temperature in recent decades has been anomalous.

Since the the current warming started it has occurred in two distinct phases. The first period of warming that started around 1900 lasted up until around 1950, there was then a period of about 30 years when temperatures dropped back a bit and then around 1975 the most recent period of warming started.

The bulk of CO2 added to the atmosphere by human activity has been added since the end of the World War 2. Those who support the claim that CO2 is responsible for all the recent warming do not argue that the warming in the first half of the 20th was caused by CO2.Therefore it should be possible to compare the rate of change of temperatures in the first half of the 20th Century, which everyone agrees was natural, with the rate of change in the second half of the 20th Century, which some claim is not natural, and see if there is a difference between the two.

Below are two graphs that both show temperature changes over a 51 year period. Both use exactly the same format for displaying the data. One chart shows the period 1885 to 1946 and the other chart shows the period 1957-2008. One, it is agreed by everyone, is caused by nature and one, it is claimed by some, is unnatural. Can you tell which is which?


The answer is that the chart on the left is for 1957 – 2008 and is considered by the climate alarmists to show unprecedented warming. What do you think?

Tuesday, July 15, 2014

Review finds Medieval Warm Period was global, not confined to Northern Europe as IPCC now claims

Review from CO2Science.org, last updated 16 July 2014:

Medieval Warm Period in Central Europe -- Summary

Was there really a global Medieval Warm Period? The IPCC used to acknowledge there was; but they have long since changed their view on the subject. Mounting evidence, however, suggests they were wrong to do so; and in this summary, new and important data from Central Europe that support their original belief are described and discussed.

Filippi et al. (1999) obtained stable isotope data (delta 18O and delta 13C) from bulk carbonate and ostracode calcite in a radiocarbon-dated sediment core removed from Lake Neuchatel in the western Swiss Lowlands at the foot of the Jura Mountains, which they used to reconstruct the climatic history of that region over the past 1500 years. And in doing so, they determined that mean annual air temperature dropped by about 1.5°C during the transition from the Medieval Warm Period (MWP) to the Little Ice Age (LIA). In addition, they state that "the warming during the 20th century does not seem to have fully compensated the cooling at the MWP-LIA transition" and that during the Medieval Warm Period, mean annual air temperatures were "on average higher than at present."

Working nearby in the Czech Republic, Bodri and Cermak (1999) derived individual ground surface temperature histories from the temperature-depth logs of 98 separate boreholes. This work revealed, in their words, "the existence of a medieval warm epoch lasting from 1100-1300 AD," which they describe as "one of the warmest postglacial times." They also noted that during the main phase of the Little Ice Age, from 1600-1700 AD, "all investigated territory was already subjected to massive cooling," and that "the observed recent warming may thus be easily a natural return of climate from the previous colder conditions back to a 'normal'."

After the passing of four additional years, Niggemann et al. (2003) saw the publication of the results of their study of petrographical and geochemical properties of three stalagmites found in the B7-Cave of Sauerland, Northwest Germany, from which they developed a climatic history that covered the prior 17,600 years. All three of these records, in their words, "resemble records from an Irish stalagmite (McDermott et al., 1999)," which has also been described by McDermott et al. (2001). With respect to their own records, for example, the four researchers explicitly note that they provide evidence for the existence of the Little Ice Age, the Medieval Warm Period and the Roman Warm Period, which also implies the existence of what McDermott et al. (2001) called the Dark Ages Cold Period that separated the Medieval and Roman Warm Periods, as well as the unnamed cold period that preceded the Roman Warm Period. And the wealth of corroborative information contained in these records (and many others) clearly suggests that there is nothing unusual, unprecedented or unexpected about the 20th-century warming that ushered in the Current Warm Period.

Moving ahead one additional year, Bartholy et al. (2004) noted, as background for their study of the issue at hand, that Antal Rethly (1879-1975) was a meteorologist, professor and director of the National Meteorological and Earth Magnetism Institute of Hungary, who spent the greater portion of his long professional life collecting over 14,000 historical records related to the climate of the Carpathian Basin and ultimately publishing a four-volume set of books about them in the Hungarian language that contain approximately 2500 pages (Rethly, 1962, 1970; Rethly and Simon, 1999). And building upon this immense foundation of pertinent materials, they meticulously codified and analyzed all of the historical records collected by Rethly, noting that "in order to provide regional climate scenarios for any particular area, past climate tendencies and climatological extremes must be analyzed." In this context, therefore, and with respect to temperature, the three Hungarian scientists reported that "the warm peaks of the Medieval Warm Epoch and colder climate of the Little Ice Age followed by the recovery warming period can be detected in the reconstructed temperature index time series." And so, once again, we find additional substantial evidence for the existence of the Medieval Warm Period, which many of the world's climate alarmists refuse to acknowledge as ever occurring.

One year later, in an important study of a precisely dated δ18O record with better than decadal resolution that they derived from a stalagmite recovered from Spannagel Cave in the Central Alps of Austria, Mangini et al. (2005) developed a highly-resolved record of temperature at high elevation (approximately 2500 meters above sea level) during the past 2000 years, based on a transfer function they derived from a comparison of their δ18O data with the reconstructed temperature history of post-1500 Europe that was developed by Luterbacher et al. (2004).

The lowest temperatures of the past two millennia, according to the new record, occurred during the Little Ice Age (AD 1400-1850), while the highest temperatures were found in the Medieval Warm Period (MWP: AD 800-1300). More specifically, Mangini et al. say that the highest temperatures of the MWP were "slightly higher than those of the top section of the stalagmite (1950 AD) and higher than the present-day temperature." In fact, at three different points during the MWP, their data indicate temperature spikes in excess of 1°C above present (1995-1998) temperatures.

Mangini et al. additionally reported that their temperature reconstruction compares well with reconstructions developed from Greenland ice cores (Muller and Gordon, 2000), Bermuda Rise ocean-bottom sediments (Keigwin, 1996), and glacier tongue advances and retreats in the Alps (Holzhauser, 1997; Wanner et al., 2000), as well as with the Northern Hemispheric temperature reconstruction of Moberg et al. (2005). Considered together, therefore, they say these several data sets "indicate that the MWP was a climatically distinct period in the Northern Hemisphere," emphasizing that "this conclusion is in strong contradiction to the temperature reconstruction by the IPCC, which only sees the last 100 years as a period of increased temperature during the last 2000 years."

In a second severe blow to IPCC dogma, Mangini et al. found "a high correlation between δ18O and δ14C, that reflects the amount of radiocarbon in the upper atmosphere," and they wrote that this correlation "suggests that solar variability was a major driver of climate in Central Europe during the past 2 millennia." In this regard, they further report that "the maxima of δ18O coincide with solar minima (Dalton, Maunder, Sporer, Wolf, as well as with minima at around AD 700, 500 and 300)," and that "the coldest period between 1688 and 1698 coincided with the Maunder Minimum." Also, in a linear-model analysis of the percent of variance of their full temperature reconstruction that is individually explained by solar and CO2 forcing, they found that the impact of the sun was fully 279 times greater than that of the air's CO2 concentration, noting that "the flat evolution of CO2 during the first 19 centuries yields almost vanishing correlation coefficients with the temperature reconstructions."

Clearly, the IPCC-endorsed hockeystick temperature history of Mann et al. (1998, 1999) does not reflect the true thermal history of the Northern Hemisphere over the past thousand years, nor does the hockeystick temperature history of Mann and Jones (2003) reflect the true thermal history of the world over the past two millennia. In addition, both sets of studies, as well as the IPCC itself, appear to be focusing on the wrong instigator of climate change over these periods, i.e., CO2 in lieu of solar activity.

Appearing in the same year as Mangini et al.'s paper was the paper of Büntgen et al. (2005), who - using the regional curve standardization technique applied to ring-width measurements from both living trees and relict wood - developed a 1052-year summer (June-August) temperature proxy from high-elevation Alpine environments in Switzerland and the western Austrian Alps (between 46°28' to 47°00'N and 7°49' to 11°30'E). This temperature history revealed the presence of warm conditions from the beginning of the record in AD 951 up to about AD 1350, which the five researchers associated with the Medieval Warm Period. Thereafter, temperatures declined and an extended cold period (the Little Ice Age) ensued, which persisted until approximately 1850 ... with one brief exception for a few short decades in the mid- to late-1500s, when there was an unusually warm period, the temperatures of which were only exceeded at the beginning and end of the 1052-year record, i.e., during the Medieval and Current Warm Periods.

Concomitantly, Holzhauser et al. (2005) "for the first time," in their words, presented high-resolution records of variations in glacier size in the Swiss Alps together with lake-level fluctuations in the Jura mountains, the northern French Pre-Alps and the Swiss Plateau in developing a 3500-year climate history of west-central Europe, beginning with an in-depth analysis of the Great Aletsch glacier, which is the largest of all glaciers located in the European Alps.

Near the beginning of the time period studied, the three researchers reported that "during the late Bronze Age Optimum from 1350 to 1250 BC, the Great Aletsch glacier was approximately 1000 m shorter than it is today," noting that "the period from 1450 to 1250 BC has been recognized as a warm-dry phase in other Alpine and Northern Hemisphere proxies (Tinner et al., 2003)." Then, after an intervening unnamed cold-wet phase, when the glacier grew in both mass and length, they say that "during the Iron/Roman Age Optimum between c. 200 BC and AD 50," which is perhaps better known as the Roman Warm Period, the glacier again retreated and "reached today's extent or was even somewhat shorter than today." Next came the Dark Ages Cold Period, which they say was followed by "the Medieval Warm Period, from around AD 800 to the onset of the Little Ice Age around AD 1300," which latter cold-wet phase was "characterized by three successive [glacier length] peaks: a first maximum after 1369 (in the late 1370s), a second between 1670 and 1680, and a third at 1859/60," following which the glacier began its latest and still-ongoing recession in 1865. In addition, they say that written documents from the fifteenth century AD indicate that at some time during that hundred-year interval "the glacier was of a size similar to that of the 1930s," which latter period in many parts of the world was as warm as, or even warmer than, it is today, in harmony with a growing body of evidence which suggests that a "Little" Medieval Warm Period manifested itself during the fifteenth century within the broader expanse of the Little Ice Age.

Data pertaining to the Gorner glacier (the second largest of the Swiss Alps) and the Lower Grindelwald glacier of the Bernese Alps tell much the same story, as Holzhauser et al. report that these glaciers and the Great Aletsch glacier "experienced nearly synchronous advances" throughout the study period.

With respect to what was responsible for the millennial-scale climatic oscillation that produced the alternating periods of cold-wet and warm-dry conditions that fostered the similarly-paced cycle of glacier growth and retreat, the Swiss and French scientists report that "glacier maximums coincided with radiocarbon peaks, i.e., periods of weaker solar activity," which in their estimation "suggests a possible solar origin of the climate oscillations punctuating the last 3500 years in west-central Europe, in agreement with previous studies (Denton and Karlen, 1973; Magny, 1993; van Geel et al., 1996; Bond et al., 2001)." And to underscore that point, they concluded their paper by stating that "a comparison between the fluctuations of the Great Aletsch glacier and the variations in the atmospheric residual 14C records supports the hypothesis that variations in solar activity were a major forcing factor of climate oscillations in west-central Europe during the late Holocene."

And because the current warmth of the study region has not yet resulted in a shrinkage of the Great Aletsch glacier equivalent to what it experienced during the Bronze Age Optimum of a little over three thousand years ago, or what it experienced during the Roman Warm Period of two thousand years ago, there is nothing unusual or "unprecedented," as climate alarmists often claim, about the region's current warmth. In addition, our modern warmth is occurring at just about the time one would expect it to occur, in light of the rather consistent time intervals that have separated prior warm nodes of the millennial-scale climatic oscillation that produced them, which further suggests that our current warmth, like that of prior Holocene warm periods, is likely solar-induced, which pretty much leaves CO2 "out in the cold," as far as being responsible for twentieth-century global warming is concerned.

Also with a paper published in the same year were Chapron et al. (2005), who - while noting that "millennial-scale Holocene climate fluctuations have been documented by lake level fluctuations, archaeological and palynological records for many small lakes in the Jura Mountains and several larger peri-alpine lakes" - sought to learn more about the pervasive climatic oscillation behind this phenomenon by documenting the Holocene evolution of Rhone River clastic sediment supply in Lake Le Bourget via sub-bottom seismic profiling and multidisciplinary analysis of well-dated sediment cores. And this work revealed, as they describe it, that "up to five 'Little Ice Age-like' Holocene cold periods developing enhanced Rhone River flooding activity in Lake Le Bourget [were] documented at c. 7200, 5200, 2800, 1600 and 200 cal. yr BP," and that "these abrupt climate changes were associated in the NW Alps with Mont Blanc glacier advances, enhanced glaciofluvial regimes and high lake levels." They also noted that "correlations with European lake level fluctuations and winter precipitation regimes inferred from glacier fluctuations in western Norway suggest that these five Holocene cooling events at 45°N were associated with enhanced westerlies, possibly resulting from a persistent negative mode of the North Atlantic Oscillation."

Situated between these Little Ice Age-like periods would have been Current Warm Period-like conditions. The most recent of these prior warm regimes (the Medieval Warm Period) would thus have been centered somewhere in the vicinity of AD 1100, while the next one back in time (the Roman Warm Period) would have been centered somewhere in the vicinity of 200 BC, which matches well with what is known about these warm regimes from many other studies. In addition, since something other than an increase in the atmosphere's CO2 concentration was obviously responsible for the establishment of these prior Current Warm Period-like regimes, it is reasonable to assume that another increase in that same "something" - and not the coincidental rise in the air's CO2 content - was likely responsible for ushering in the Current Warm Period.

One year later, Robert et al. (2006) analyzed assemblages of minerals and microfossils from a sediment core taken from the Berre coastal lagoon in southeast France (~ 43.44°N, 5.10°E) in an effort to reconstruct environmental changes in that region over the past 1500 years. The results of their analyses revealed three distinct climatic intervals: (1) a cold period that extended from about AD 400 to 900, (2) a warm interval between about AD 980 and 1370, and (3) a cold interval that peaked during the 16th and 17th centuries, which climatic intervals correspond, respectively, to the well-known Dark Ages Cold Period, Medieval Warm Period (MWP) and Little Ice Age.

Most significantly, the team of eight researchers also found evidence of a higher kaolinite content in the sediment core during the MWP, which suggests, in their words, "increased chemical weathering in relation to higher temperatures and/or precipitation." In addition, they discovered that the concentration of microfossils of the thermophilic taxon Spiniferites bentorii also peaked during the same time interval; and this finding provides additional evidence that the temperatures of that period were likely higher than those of the recent past.

About this same time, Joerin et al. (2006) wrote that "the exceptional trend of warming during the twentieth century in relation to the last 1000 years highlights the importance of assessing natural variability of climate change." Why? Because it is essential to be able to determine, by comparison, if there is anything unusual, unnatural, or unprecedented about the past century's increase in temperature, which is the way in which the world's climate alarmists typically describe 20th-century global warming. Thus, in their quest to accomplish this objective, the three Swiss researchers examined glacier recessions in the Swiss Alps over the past ten thousand years based on radiocarbon-derived ages of materials found in proglacial fluvial sediments of subglacial origin, focusing on subfossil remains of wood and peat. And combining their results with earlier data of a similar nature, they were able to construct a master chronology of Swiss glacier fluctuations over the course of the Holocene. So what did they find?

First of all, Joerin et al. reported discovering that "alpine glacier recessions occurred at least 12 times during the Holocene," once again demonstrating the reality of the millennial-scale oscillation of climate that has reverberated throughout glacial and interglacial periods alike as far back in time as scientists have searched for the phenomenon. And as a result of this finding, it is clear that 20th-century global warming was not unusual. It was merely the latest example of what has been the normthroughout hundreds of thousands of years.

Second, they determined that glacier recessions have been decreasing in frequency since approximately 7000 years ago, and especially since 3200 years ago, "culminating in the maximum glacier extent of the 'Little Ice Age'." Consequently, the significant warming of the 20th century cannot be considered strange, since it represents a climatic rebounding from thecoldest period of the current interglacial, which interglacial just happens to be the coldest of the last five interglacials, according to Petit et al. (1999). And when the earth has been that cold for a few centuries, it is not unnatural to expect that, once started, the scheduled warming would be quite significant.

Third, the last of the major glacier recessions in the Swiss Alps occurred between about 1400 and 1200 years ago, according to Joerin et al.'s data; but it took place between 1200 and 800 years ago, according to the data of Holzhauser et al. (2005) for the Great Aletsch Glacier. Of this discrepancy, Joerin et al. say that given the uncertainty of the radiocarbon dates, the two records need not be considered inconsistent with each other. What is more, their presentation of the Great Aletsch Glacier data indicates that the glacier's length at about AD 1000 - when there was fully 100 ppm less CO2 in the air than there is today - was just slightly less than its length in 2002, suggesting that the peak temperature of the Medieval Warm Period likely was slightly higher than the peak temperature of the 20th century. And, consequently, 20th-century warming has likely not been unprecedented over the past millennium; and there is thus no compelling reason to attribute it to anthropogenic CO2 emissions, for the temperature increase of the past hundred or so years has been simply a run-of-the-mill consequence of cyclically-recurring forces of nature that have manifested themselves again and again and again throughout earth's history at millennial-scale intervals.

Contemporaneously, Buntgen et al. (2006) developed an annually-resolved mean summer (June-September) temperature record for the European Alps, covering the period AD 755-2004 and based on 180 recent and historic larch (Larix deciduaMill.) maximum latewood density series, which were created via the regional curve standardization method that preserves interannual to multi-centennial temperature-related variations. Among a number of other things, notable features of this history were the high temperatures of the late tenth, early thirteenth, and twentieth centuries and the prolonged cooling from ~1350 to 1700, or as they described it: "warmth during medieval and recent times, and cold in between." Also of great interest, they reported that the coldest decade of the record was the 1810s, and that even though the record extended all the way through 2004, the warmest decade of the record was the 1940s. In addition, they observed that "warm summers seemed to coincide with periods of high solar activity, and cold summers vice versa." And, finally, they report that comparing their newest temperature record with other regional- and large-scale reconstructions "reveals similar decadal to longer-term variability," causing them to conclude - in the final sentence of their paper - that based upon their findings and the similar findings many others, "the twentieth-century contribution of anthropogenic greenhouse gases and aerosol remains insecure."

Hearkening back a year or so, and extending the work of Mangini et al. (2005), who had developed a 2000-year temperature history of the central European Alps based on an analysis of δ18O data obtained from stalagmite SPA 12 of Austria's Spannagel Cave, Vollweiler et al. (2006) used similarly-measured δ18O data obtained from two adjacent stalagmites (SPA 128 and SPA 70) within the same cave to create a master δ18O history covering the last 9000 years, which Mangini et al. (2007) compared with the Hematite-Stained-Grain (HSG) history of ice-rafted debris in North Atlantic Ocean sediments developed by Bond et al. (2001), who had reported that "over the last 12,000 years virtually every centennial time-scale increase in drift ice documented in our North Atlantic records was tied to a solar minimum."

In pursuing this course of action, Mangini et al. found an incredibly good correspondence between the peaks and valleys of their δ18O curve and the HSG curve of Bond et al., concluding that (1) "the excellent match between the curves obtained from these two independent data sets gives evidence that the δ18O signal recorded in Spannagel cave reflects the intensity of the warm North Atlantic drift, disproving the assumption that the Spannagel isotope record is merely a local phenomenon," and, therefore, that (2) their δ18O curve "can reasonably be assumed to reflect non-local conditions," implying it has wide regional applicability.

Having established this important point, Mangini et al. next focused on why their δ18O curve "displays larger variations for the last 2000 years than the multi-proxy record in Europe, which is mainly derived from tree-ring data" and "from low resolution archives (Mann et al., 1998, 1999; Mann and Jones, 2003)." The most probable answer, in their words, "is that tree-rings rather record the climate conditions during spring and summer," whereas both the HSG and δ18O curves "mirror winter-like conditions, which are only poorly recorded in tree-rings."

One important consequence of these differences is that whereas the Mann et al. and Mann and Jones data sets do not reflect the existence of the Medieval Warm Period and Little Ice Age, the Spannagel Cave data do. And applying the calibration curve derived for SPA 12 by Manginni et al. (2005) to the new δ18O curve, it can readily be determined that the peak temperature of the Medieval Warm Period was approximately 1.5°C higher than the peak temperature of the Current Warm Period. In addition, the new data set of Manginni et al. (2007) confirms the inference of Bond et al.'s finding that over the last 12,000 years virtually every centennial-scale cooling of the North Atlantic region "was tied to a solar minimum," demonstrating that the data sets of Mann et al. and Mann and Jones fail to capture the full range of temperature variability over the past two millennia. And as a result, the new data set clearly depicts the existence of both the Little Ice Age and Medieval Warm Period, the latter of which is seen to have been substantially warmer over periods of centuries than the warmest parts of the 20th century, almost certainly as a result of enhanced solar activity, and in spite of the fact that the air's CO2 concentration during the Medieval Warm Period was more than 100 ppm less than it is today. And so there is every reason to believe that the global warming of the past century was neither unprecedented nor CO2-induced. Rather, it appears to have been nothing special and solar-induced.

Hard at work in the same year, Schmidt et al. (2007) combined spring and autumn temperature anomaly reconstructions based on siliceous algae and pollen tracers found in a sediment core extracted from an Alpine lake (Oberer Landschitzsee; 47°14'52" N, 13°51'40" E) located at the southern slopes of the Austrian Central Alps just slightly above the present tree-line, with the goal of developing a 4000-year climatic reconstruction that they subsequently compared with (1) a similar time-scale reconstruction from another lake in the drainage area, (2) local historical records, and (3) other climate proxies on Alpine and Northern Hemispheric scales. And in pursuing their goal, they found that "spring-temperature anomalies during Roman and Medieval times equaled or slightly exceeded the modern values and paralleled tree-line and glacier fluctuations," indicative of their broad range of applicability. As for the timing of the Medieval Warm Period, they identified "warm phases similar to present between ca. 850-1000 AD and 1200-1300 AD," which they say were "followed by climate deterioration at ca 1300 AD, which culminated during the Little Ice Age." Hence, their data placed the possibly-slightly-warmer-than-present Medieval Warm Period as occurring between AD 850 and 1300.

One year later, Schmidt et al. (2008) analyzed sediment grain size, as well as the concentrations of major and trace elements and minerals found in a sediment core recovered from an Austrian alpine lake, Oberer Landschitzsee (47°14'52" N, 13°51'40" E), which covered the past 4,000 years, together with autumn and spring temperature anomalies and ice-cover estimated from selected pollen markers and a diatom and chrysophyte cyst thermistor-based regional calibration dataset, in order to recreate the surrounding region's late-Holocene climate and land-use history. This work identified the Roman Warm Period (300 BC to AD 400) and the Medieval Warm Period (AD 1000 to AD 1600), as well as the fact that "spring temperature anomalies during Roman and Medieval times equaled or slightly exceeded the modern values." Also of significance was their detection of two other warm periods - 1800 to 1300 BC and 1000 to 500 BC - as well as the cooler periods that were sandwiched between them, including the Little Ice Age that occurred between the Medieval Warm Period and the Current Warm Period. In addition, they were able to ascertain that "four waves of alpine land use were coupled mainly with warm periods."

Based on these findings and those of many others, it is clear that there is a well-established millennial-scale oscillation of climate that has reverberated throughout glacial and interglacial times alike, which has alternately brought the planet relatively warmer and colder climatic conditions, independent of any changes in the air's CO2 content; and the results of this study bear further witness to this fact. They also indicate that in the vicinity of Oberer Landschitzsee, the two warm periods that preceded the Current Warm Period (when the atmosphere's CO2 concentration was fully 100 ppm less than it is today) were at least as warm as - or even slightly warmer than - it is at present. Hence, it is likely that earth's current run-of-the-millwarmth is totally unrelated to its much higher atmospheric CO2 concentration and is instead but a manifestation of this natural climatic cycle.

Inching another year closer to the present, Millet et al. (2009) wrote that "among biological proxies from lake sediments, chironomid [non-biting midge] assemblages are viewed as one of the most promising climatic indicators," and that "the accuracy of chironomid assemblages for the reconstruction of Lateglacial temperatures is now broadly demonstrated." Thus, they developed a new chironomid-based temperature record from Lake Anterne (northern French Alps) that covered the past two millennia, compared that reconstruction with other late-Holocene temperature records from Central Europe, and addressed the question of whether previously described centennial-scale climate events such as the Medieval Warm Period or the Little Ice Age can be detected in this new summer temperature record, noting that "at a hemispheric or global scale the existence of the LIA and MWP have been questioned."

The six scientists reported that evidence was indeed found "of a cold phase at Lake Anterne between AD 400 and 680, a warm episode between AD 680 and 1350, and another cold phase between AD 1350 and 1900," and they said that these events were "correlated to the so-called 'Dark Age Cold Period' (DACP), the 'Medieval Warm Period' and the 'Little Ice Age'." In addition, they noted that "many other climate reconstructions across western Europe confirm the existence of several significant climatic changes during the last 1800 years in Central Europe and more specifically the DACP, the MWP and the LIA." Last of all, they reported that the reconstructed temperatures of the 20th century failed to show a return to MWP levels of warmth, which failure, however, they attributed to a breakdown of the chironomid-temperature relationship over the final century of their 1800-year history.

One year later, Gasiorowski and Sienkiewicz (2010) inferred the thermal conditions of Smreczynski Staw Lake (49°12'N, 19°51'E) in the Tatra Mountains of southern Poland via analyses of the distributions of various cladocera, chironomid and diatom species they identified and quantified in a sediment core they had extracted from the center of the lake in the spring of 2003, which contained sediments that had accumulated there over the prior 1500 years. This work revealed the presence of "a diverse ecosystem at the beginning of [the] record, ca. AD 360-570," which period of time has typically been assigned to the Dark Ages Cold Period. Thereafter, however, they found that from AD 570 to 1220 "environmental conditions were better," and that various cold-water taxa were "totally absent." And they write that the younger section of this zone - approximately its upper third (AD 850-1150), which contained the highest concentration of warm-waterChironomus species - "can be correlated with the Medieval Warm Period."

Next came the Little Ice Age, which was the focal point of their study, extending all the way to the start of the 20th century, after which relative warmth once again returned, persisting to the present. And based on the Chironomusconcentrations of this portion of their record (the Current Warm Period or CWP), their data suggested that the peak warmth of the CWP and the earlier MWP were about the same. Once again, therefore, we have another paleoclimate record that displays the millennial-scale oscillation of climate that reverberates throughout the Holocene and about as far back in time as researchers have looked for it. And once again we have another demonstration of the fact that the peak warmth of the late 20th-century and the early 21st-century has not been as unprecedented as the world's climate alarmists have typically claimed it to be.

Near simultaneously, Larocque-Tobler et al. (2010) wrote that to better describe the amplitude of temperature change during the last millennium, "new records to increase the geographic coverage of paleoclimatic information are needed," and that "only by obtaining numerous high-resolution temperature records will it be possible to determine if the 20th century climate change exceeded the natural pre-industrial variability of European climate." Thus, to help achieve this important goal, they proceeded to obtain another such temperature record spanning the last millennium via an analysis of fossil chironomids (non-biting midges), which they identified and quantified in four sediment cores extracted from the bed of Lake Silvaplana (46°26'56"N, 9°47'33"E) in the Upper Engadine (a high-elevation valley in the eastern Swiss Alps).

This work revealed, as they described it, that "at the beginning of the record, corresponding to the last part of the 'Medieval Climate Anomaly' (here the period between ca. AD 1032 and 1262), the chironomid-inferred mean July air temperatures were 1°C warmer than the climate reference period (1961-1990)," which would also make them warmer than most subsequent temperatures as well. And in looking at their graphs of 20- and 50-year running means, it can be seen that the peak mean warmth of the Medieval Warm Period exceeded that of the Current Warm Period by about 0.5°C in the case of 20-year averages and 1.2°C in the case of 50-year averages. And thus it was that the five researchers concluded that "based on the chironomid-inferred temperatures, there is no evidence that mean-July air temperature exceeded the natural variability recorded during the Medieval Climate Anomaly in the 20th century at Lake Silvaplana," while noting that similar results "were also obtained in northern Sweden (Grudd, 2008), in Western Europe (Guiot et al., 2005), in a composite of Northern Hemisphere tree-ring reconstructions (Esper et al., 2002) and a composite of tree rings and other archives (Moberg et al., 2005)."

Moving ahead one more year, Magny et al. (2011) wrote that "present-day global warming has provoked an increasing interest in the reconstruction of climate changes over the last millennium (Guiot et al., 2005; Jones et al., 2009)," which time interval, as they describe it, is "characterized by a succession of distinct climatic phases, i.e. a Medieval Warm Period (MWP) followed by a long cooler Little Ice Age (LIA) and finally by a post-industrial rapid increase in temperature," which is generally referred to as the initial phase of the Current Warm Period (CWP). And in a study designed to compare the temperatures of these two periods, the six scientists, working at Lake Joux (46°36'N, 6°15'E) at an altitude of 1006 meters above sea level (a.s.l.) in the Swiss Jura Mountains, employed a multi-proxy approach with pollen and lake-level data to develop a 1000-year history of the mean temperature of the warmest month of the year (MTWA, which was July at Lake Joux), based on the Modern Analogue Technique, which procedure is described by them as "a commonly used and accepted method for the reconstruction of Lateglacial and Holocene climate oscillations from continental and marine sequences," citing the confirming works of Guiot et al. (1993), Cheddadi et al., (1997), Davis et al. (2003), Peyron et al. (2005), Kotthoff et al. (2008) and Pross et al. (2009).

At the conclusion of their analyses, Magny et al. wrote that their data "give evidence of the successive climate periods generally recognized within the last 1000 years," which they described as "a MWP between ca. AD 1100 and 1320, (2) a LIA which, in the Joux Valley, initiated as early as ca. AD 1350 and ended at ca. AD 1870, and (3) a last warmer and drier period," which is generally referred to as the beginning of the Current Warm Period (CWP).

"Considering the question of present-day global warming on a regional scale," in the words of Magny et al., "the increase in MTWA by ca. 1.6°C observed at Laoura (1100 m a.s.l., near the Joux basin) for the period 1991-2008, when compared to the reference period 1961-1990, still appears to be in the range of the positive temperature anomaly reconstructed at Lake Joux ca. AD 1300 during the late MWP." And they note that "meteorological data observed at La Brevine (1043 m a.s.l., also near the Joux basin) suggest a similar pattern with an increase in MTWA by 1°C over the period 1991-2008" relative to 1961-1990. Yet both of these late-20th/early-21st century temperature increases fall significantly short of that reached during the MWP, when the temperature at Joux Lake exceeded that of the 1961-1990 reference period by fully 2.0°C.

In light of these findings, it would thus appear that the peak warmth of the MWP at Lake Joux exceeded that of the CWP at that location by something on the order of 0.4-1.0°C, in harmony with similar findings obtained at numerous other locations around the world. And these observations clearly indicate that temperatures even warmer than those of the present can occur with much less CO2 in the air than there is today, suggesting that there is no compelling reason to attribute earth's current level of warmth to the atmosphere's current higher CO2 concentration.

Appearing in print during the same year as Magny et al.'s paper was the report of Moschen et al. (2011), who wrote that "currently, there is specific interest in climate change during our historical past and in the human impact on past and future climate and ecosystem dynamics," and they said that "in this context, the reconstruction of decadal to centennial scale natural climate variability is of importance to estimate to what extent human activities contribute to the recent warming trend observable at a regional and global scale." And so they went on to present "a high resolution reconstruction of local growing season temperature anomalies at Durres Maar, Germany [50°52'N, 6°53'E], spanning the last two millennia," which was "derived from a stable carbon isotope time series of cellulose chemically extracted from Sphagnum leaves (δ13Ccellulose) separated from a kettle-hole peat deposit of several meters thickness," where the temperature reconstruction was based on the temperature dependency of Sphagnum δ13CCcellulose observed in calibration studies.

Lasting from the 4th to the 7th century AD, the five researchers identified a cold phase with below-average temperature, "in accordance with the so-called European Migration Period," which has also come to be known as the Dark Ages Cold Period. Thereafter, they state that "during High Medieval Times above-average temperatures are obvious." In fact, the peak warmth of this Medieval Warm Period, which looks from the graph of their data to run from about AD 830 to AD 1150, was approximately 2.8°C greater than the peak warmth of the Current Warm Period in terms of individual anomaly points, while it was approximately 2.7°C greater in terms of 60-year running means. And between these two warm periods, the Little Ice Age could be seen to hold sway.

In terms of Moschen et al.'s stated purpose of hoping to illustrate "to what extent human activities contribute to the recent warming trend observable at a regional and global scale," based on what types of natural climate changes have occurred over the past two millennia, it would have to be concluded that human activities have contributed absolutely nothing in the way of warming, as it was much warmer at Durres Maar, Germany, back in the good old (High Medieval) days, when there was far less CO2 in the air than there is today.

Expanding upon the work of some of their group two years earlier (Larocque-Tobler et al., 2010), Larocque-Tobler et al. (2012) note that "the climate of the last millennium is still controversial because too few high-resolution paleo-climate reconstructions exist to answer two key research questions," namely, (1) "Were the 'Medieval Climate Anomaly' (MCA) and the 'Little Ice Age' (LIA) of similar spatial extent and timing in Europe and in the Northern Hemisphere?" and (2) "Does the amplitude of climate change of the last century exceed the natural variability?"

Working with a lake sediment core extracted from the deepest point of Seebergsee (46°37'N, 7°28'E) in the northern Swiss Alps in AD 2005, the second Larocque-Tobler team employed chironomid head capsules preserved in the sediments to reconstruct mean July air temperatures for the past 1000 years, after which they compared their results to those of Larocque-Tobler et al. (2010) for another Swiss lake (Silvaplana in the eastern Alps), then to regional and European records of early instrumental data (Luterbacher et al., 2004; Auer et al., 2007; Bohm et al., 2010), as well as a composite of paleoclimate reconstructions from the Greater Alpine Region and to millennial scale climate reconstructions of the entire Northern Hemisphere (Mangini et al., 2005; Moberg et al., 2005; Osborn and Briffa, 2006), in order to address the two research questions that inspired their study and "to improve understanding of the climatic variability of the last millennium."

The six scientists' work revealed that the peak warmth of the MCA just prior to AD 1200 was approximately 0.9°C greaterthan the peak warmth near the end of their record, as best as can be determined from the graph of their data. And, therefore, as more and more palaeo-temperature data are acquired, the IPCC-endorsed "hockeystick" temperature record of Mann et al. (1999) - which gives little indication of the existence of the MCA and shows recent temperatures towering over those of that earlier time period - continues to fade slowly into oblivion, as it is repudiated by ever more real-world data. And it's not just the most recent data of Larocque-Tobler et al. that refute the IPCC's view of this matter; for the group of six says that their newest temperature history is "mirrored by the chironomid reconstruction from Silvaplana and the Greater Alpine Region composite of reconstructions." And they add that "several other reconstructions from the Northern Hemisphere also show [recent] warm inferred temperatures that were not as warm as the MCA."

Last of all comes the study of Niemann et al. (2012), who introduced the report of their most recent work, as so many before them had done, by noting that "the assessment of climate variations in Earth's history is of paramount importance for our comprehension of recent and future climate variability." And they stated that for this important purpose "geological archives containing climate-sensitive proxy indicators are used to reconstruct paleoclimate."

In taking this approach to the problem, Niemann et al. employed what they described as "a novel proxy for continentalmean annual air temperature (MAAT) and soil pH" that is "based on the temperature (T) and pH-dependent distribution of specific bacterial membrane lipids (branched glycerol dialkyl glycerol tetraethers - GDGTs) in soil organic matter," which technique derives from the fact that "microorganisms can modify the composition of their cellular membrane lipids to adapt membrane functionality to specific environmental parameters such as T and pH," as described by Hazel and Williams (1990) and Weijers et al. (2007), the latter of whom devised "transfer functions that relate the degree of the GDGT methylation (expressed in the Methylation index - MBT) and cyclisation (expressed in the cyclisation ratio - CBT) to mean annual air temperature." And this they did, using sediment cores that were collected in September 2009 and May 2010 from a small alpine lake (Cadagno) in the Piora Valley of south-central Switzerland, as well as soil samples taken from the surrounding catchment area.

As a result of these efforts, the nine Dutch and Swiss researchers reported that "major climate anomalies recorded by the MBT/CBT-paleothermometer" were "the Little Ice Age (~14th to 19th century) and the Medieval Warm Period (MWP, ~9th to 14th century)," which they say experienced "temperatures similar to the present-day values." And "in addition to the MWP," they state that their "lacustrine paleo T record indicates Holocene warm phases at about 3, 5, 7 and 11 kyr before present, which agrees in timing with other records from both the Alps and the sub-polar North-East Atlantic Ocean."

Thus it was that Niemann et al.'s study once again indicated that there is nothing unusual, unnatural or unprecedented about earth's current climate. And their findings of still other - and sometimes even warmer - such periods, going even further back in time, when the atmosphere's CO2 content was way less than it is currently, almost mandates that there is no rational reason or need to invoke anthropogenic-induced increases in the air's CO2 concentration as the cause of the planet's current level of non-unique run-of-the-mill warmth. The burning of fossil fuels has had nothing to do with it.

References
Auer, I., Bohm, R., Jurkovic, A., Lipa, W., Orlik, A., Potzmann, R., Schoner, W., Ungersbok, M., Matulla, C., Briffa, K., Jones, P., Efthymiadis, D., Brunetti, M., Nanni, T., Maugeri, M., Mercalli, L., Mestre, O., Moisselin, J.-M., Begert, M., Muller-Westermeier, G., Kveton, V., Bochnicek, O., Stastny, P., Lapin, M., Szalai, S., Szentimrey, T., Cegnar, T., Dolinar, M., Gajic-Capka, M., Zaninovic, K., Majstorovic, M. and Nieplova, M. 2007. HISTALP: historical instrumental climatological surface time series of the Greater Alpine Region. International Journal of Climatology 27: 17-46.

Bartholy, J., Pongracz, R. and Molnar, Z. 2004. Classification and analysis of past climate information based on historical documentary sources for the Carpathian Basin. International Journal of Climatology 24: 1759-1776.

Bodri, L. and Cermak, V. 1999. Climate change of the last millennium inferred from borehole temperatures: Regional patterns of climatic changes in the Czech Republic - Part III. Global and Planetary Change 21: 225-235.

Bohm, R., Jones, P.D., Hiebl, J., Brunetti, M., Frank, D. and Maugeri, M. 2010. The early instrumental warm bias: a solution for long central European temperatures series 1760-2007. Climatic Change 101: 41-67.

Bond, G., Kromer, B., Beer, J., Muscheler, R., Evans, M.N., Showers, W., Hoffmann, S., Lotti-Bond, R., Hajdas, I. and Bonani, G. 2001. Persistent solar influence on North Atlantic climate during the Holocene. Science 294: 2130-2136.

Büntgen, U., Esper, J., Frank, D.C., Nicolussi, K. and Schmidhalter, M. 2005. A 1052-year tree-ring proxy for Alpine summer temperatures. Climate Dynamics 25: 141-153.

Buntgen, U., Frank, D.C., Nievergelt, D. and Esper, J. 2006. Summer temperature variations in the European Alps, A.D. 755-2004. Journal of Climate 19: 5606-5623.

Chapron, E., Arnaud, F., Noel, H., Revel, M., Desmet, M. and Perdereau, L. 2005. Rohne River flood deposits in Lake Le Bourget: a proxy for Holocene environmental changes in the NW Alps, France. Boreas 34: 404-416.

Cheddadi, R., Yu, G., Guiot, J., Harrison, S.P. and Prentice, I.C. 1997. The climate of Europe 6000 years ago. Climate Dynamics 13: 1-9.

Davis, B.A.S., Brewer, S., Stevenson, A.C. and Guiot,J. 2003. The temperature of Europe during the Holocene reconstructed from pollen data. Quaternary Science Reviews 22: 1701-1716.

Denton, G.H. and Karlen, W. 1973. Holocene climate variations - their pattern and possible cause. Quaternary Research 3: 155-205.

Esper, J., Cook, E.R. and Schweingruber, F.H. 2002. Low-frequency signals in long tree-ring chronologies for reconstructing past temperature variability. Science 295: 2250-2253.

Filippi, M.L., Lambert, P., Hunziker, J., Kubler, B. and Bernasconi, S. 1999. Climatic and anthropogenic influence on the stable isotope record from bulk carbonates and ostracodes in Lake Neuchatel, Switzerland, during the last two millennia. Journal of Paleolimnology 21: 19-34.

Gasiorowski, M. and Sienkiewicz, E. 2010. The Little Ice Age recorded in sediments of a small dystrophic mountain lake in southern Poland. Journal of Paleolimnology 43: 475-487.

Grudd, H. 2008. Tornetrask tree-ring width and density AD 500-2004: a test of climatic sensitivity and a new 1500-year reconstruction of north Fennoscandian summers. Climate Dynamics 31: 843-857.

Guiot, J., Harrison, S.P. and Prentice, I.C. 1993. Reconstruction of Holocene pattern of moisture in Europe using pollen and lake-level data. Quaternary Research 40: 139-149.

Guiot, J., Nicault, A., Rathgeber, C., Edouard, J.L., Guibal, F., Pichard, G. and Till, C. 2005. Last-Millennium summer-temperature variations in Western Europe based on proxy data. The Holocene 15: 489-500.

Hazel, J.R. and Williams, E.E. 1990. The role of alterations in membrane lipid composition in enabling physiological adaptation of organisms to their physical environment. Progress in Lipid Research 29: 167-227.

Holzhauser, H. 1997. Fluctuations of the Grosser Aletsch Glacier and the Gorner Glacier during the last 3200 years: new results. In: Frenzel, B. (Ed.) Glacier Fluctuations During the Holocene. Fischer, Stuttgart, Germany, pp. 35-58.

Holzhauser, H., Magny, M. and Zumbuhl, H.J. 2005. Glacier and lake-level variations in west-central Europe over the last 3500 years. The Holocene 15: 789-801.

Joerin, U.E., Stocker, T.F. and Schluchter, C. 2006. Multicentury glacier fluctuations in the Swiss Alps during the Holocene.The Holocene 16: 697-704.

Jones, P.D., Briffa, K.R., Osborn, T.J., Lough, J.M., van Ommen, T.D., Vinther, B.M., Luterbacher,J., Wahl, E.R., Zwiers, F.W., Mann, M.E., Schmidt, G.A., Ammann, C.M., Buckley, B.M., Cobb, K.M., Esper, J., Goosse, H., Graham, N., Jansen, E., Kiefer, T., Kull, C., Kuttel, M., Mosley-Thompson, E., Overpeck, J.T., Riedwyl, N., Schulz, M., Tudhope, A.W., Villalba, R., Wanner, H., Wolff, E. and Xoplaki, E. 2009. High-resolution palaeoclimatology of the last millennium: a review of current status and future prospects. The Holocene 19: 3-49.

Keigwin, L.D. 1996. The Little Ice Age and Medieval Warm Period in the Sargasso Sea. Science 274: 1503-1508.

Kotthoff, U., Pross, J., Muller, U.C., Peyron, O., Schmiedle, G., Schulz, H. and Bordon, A. 2008. Climate dynamics in the borderlands of the Aegean Sea during formation of sapropel 1 deduced from a marine pollen record. Quaternary Science Reviews 27: 832-845.

Larocque-Tobler, I., Grosjean, M., Heiri, O., Trachsel, M. and Kamenik, C. 2010. Thousand years of climate change reconstructed from chironomid subfossils preserved in varved lake Silvaplana, Engadine, Switzerland. Quaternary Science Reviews 29: 1940-1949.

Larocque-Tobler, I., Stewart, M.M., Quinlan, R., Traschel, M., Kamenik, C. and Grosjean, M. 2012. A last millennium temperature reconstruction using chironomids preserved in sediments of anoxic Seebergsee (Switzerland): consensus at local, regional and Central European scales. Quaternary Science Reviews 41: 49-56.

Luterbacher, J., Dietrich, D., Xoplaki, E., Grosjean, M. and Wanner, H. 2004. European seasonal and annual temperature variability trends, and extremes since 1500. Science 303: 1499-1503.

Magny, M. 1993. Solar influences on Holocene climatic changes illustrated by correlations between past lake-level fluctuations and the atmospheric 14C record. Quaternary Research 40: 1-9.

Magny, M., Peyron, O., Gauthier, E., Vanniere, B., Millet, L. and Vermot-Desroches, B. 2011. Quantitative estimates of temperature and precipitation changes over the last millennium from pollen and lake-level data at Lake Joux, Swiss Jura Mountains. Quaternary Research 75: 45-54.

Mangini, A., Spotl, C. and Verdes, P. 2005. Reconstruction of temperature in the Central Alps during the past 2000 yr from a δ18O stalagmite record. Earth and Planetary Science Letters 235: 741-751.

Mangini, A., Verdes, P., Spotl, C., Scholz, D., Vollweiler, N. and Kromer, B. 2007. Persistent influence of the North Atlantic hydrography on central European winter temperature during the last 9000 years. Geophysical Research Letters 34: 10.1029/2006GL028600.

Mann, M.E., Bradley, R.S. and Hughes, M.K. 1998. Global-scale temperature patterns and climate forcing over the past six centuries. Nature 392: 779-787.

Mann, M.E., Bradley, R.S. and Hughes, M.K. 1999. Northern Hemisphere temperatures during the past millennium: Inferences, uncertainties, and limitations. Geophysical Research Letters 26: 759-762.

Mann, M.E. and Jones, P.D. 2003. Global surface temperatures over the past two millennia. Geophysical Research Letters30: 10.1029/2003GL017814.

McDermott, F., Frisia, S., Huang, Y., Longinelli, A., Spiro, S., Heaton, T.H.E., Hawkesworth, C., Borsato, A., Keppens, E., Fairchild, I., van Borgh, C., Verheyden, S. and Selmo, E. 1999. Holocene climate variability in Europe: evidence from delta18O, textural and extension-rate variations in speleothems. Quaternary Science Reviews 18: 1021-1038.

McDermott, F., Mattey, D.P. and Hawkesworth, C. 2001. Centennial-scale Holocene climate variability revealed by a high-resolution speleothem ð18O record from SW Ireland. Science 294: 1328-1331.

Millet, L., Arnaud, F., Heiri, O., Magny, M., Verneaux, V. and Desmet, M. 2009. Late-Holocene summer temperature reconstruction from chironomid assemblages of Lake Anterne, northern French Alps. The Holocene 19: 317-328.

Moberg, A., Sonechkin, D.M., Holmgren, K., Datsenko, N.M. and Karlen, W. 2005. Highly variable Northern Hemisphere temperatures reconstructed from low- and high-resolution proxy data. Nature 433: 613-617.

Moschen, R., Kuhl, N., Peters, S., Vos, H. and Lucke, A. 2011. Temperature variability at Durres Maar, Germany during the Migration Period and at High Medieval Times, inferred from stable carbon isotopes of Sphagnum cellulose. Climate of the Past7: 1011-1026.

Muller, R.A. and Gordon, J.M. 2000. Ice Ages and Astronomical Causes. Springer-Verlag, Berlin, Germany.

Niemann, H., Stadnitskaia, A., Wirth, S.B., Gilli, A., Anselmetti, F.S., Damste, J.S.S., Schouten, S., Hopmans, E.C. and Lehmann, M.F. 2012. Bacterial GDGTs in Holocene sediments and catchment soils of a high Alpine lake: application of the MBT/CBT-paleothermometer. Climate of the Past 8: 889-906.

Niggemann, S., Mangini, A., Richter, D.K. and Wurth, G. 2003. A paleoclimate record of the last 17,600 years in stalagmites from the B7 cave, Sauerland, Germany. Quaternary Science Reviews 22: 555-567.

Osborn, T.J. and Briffa, K.R. 2006. The spatial extent of 20th-century warmth in the context of the past 1200 years.Science 311: 831-834.

Petit, J.R., Jouzel, J., Raynaud, D., Barkov, N.I., Barnola, J.-M., Basile, I., Bender, M., Chappellaz, J., Davis, M.., Delaygue, G., Delmotte, M., Kotlyakov, V.M., Legrand, M., Lipenkov, V.Y., Lorius, C., Pepin, L., Ritz, C., Saltzman, E. and Stievenard, M. 1999. Climate and atmospheric history of the past 420,000 years from the Vostok ice core, Antarctica. Nature 399: 429-436.

Peyron, O., Begeot, C., Brewer, S., Heiri, O., Millet, L., Ruffaldi, P., Van Campo, E. and Yu, G. 2005. Late-Glacial climatic changes in Eastern France (Lake Lautrey) from pollen, lake-levels, and chironomids. Quaternary Research 64: 197-211.

Pross, J., Kotthoff, U., Muler, U.C., Peyron, O., Dormoy, I., Schmiedle, G., Kalaitzidis, S. and Smith, A.M. 2009. Massive perturbation in terrestrial ecosystems of the Eastern Mediterranean region associated with the 8.2 kyr climatic event.Geology 37: 887-890.

Rethly, A. 1962. Meteorological Events and Natural Disasters in Hungary until 1700. Academic Press, Budapest, Hungary.

Rethly, A. 1970. Meteorological Events and Natural Disasters in Hungary between 1701-1800. Academic Press, Budapest, Hungary.

Rethly, A. and Simon, A. 1999. Meteorological Events and Natural disasters in Hungary between 1801-1900. Vol.. I-II. Hungarian Meteorological Service, Budapest, Hungary.

Robert, C., Degiovanni, C., Jaubert, R., Leroy, V., Reyss, J.L., Saliège, J.F., Thouveny, N. and de Vernal, A. 2006. Variability of sedimentation and environment in the Berre coastal lagoon (SE France) since the first millennium: Natural and anthropogenic forcings. Journal of Geochemical Exploration 88: 440-444.

Schmidt, R., Kamenik, C. and Roth, M. 2007. Siliceous algae-based seasonal temperature inference and indicator pollen tracking ca. 4,000 years of climate/land use dependency in the southern Austrian Alps. Journal of Paleolimnology 38: 541-554.

Schmidt, R., Roth, M., Tessadri, R. and Weckstrom, K. 2008. Disentangling late-Holocene climate and land use impacts on an Austrian alpine lake using seasonal temperature anomalies, ice-cover, sedimentology, and pollen tracers. Journal of Paleolimnology 40: 453-469.

Tinner, W., Lotter, A.F., Ammann, B., Condera, M., Hubschmied, P., van Leeuwan, J.F.N. and Wehrli, M. 2003. Climatic change and contemporaneous land-use phases north and south of the Alps 2300 BC to AD 800. Quaternary Science Reviews 22: 1447-1460.

van Geel, B., Buurman, J. and Waterbolk, H.T. 1996. Archaeological and palaeoecological indications of an abrupt climate change in the Netherlands and evidence for climatological teleconnections around 2650 BP. Journal of Quaternary Science11: 451-460.

Vollweiler, N., Scholz, D., Muhlinghaus, C., Mangini, A. and Spotl, C. 2006. A precisely dated climate record for the last 9 kyr from three high alpine stalagmites, Spannagel Cave, Austria. Geophysical Research Letters 33: 10.1029/2006GL027662.

Wanner, H., Dimitrios, G., Luterbacher, J., Rickli, R., Salvisberg, E. and Schmutz, C. 2000. Klimawandel im Schweizer Alpenraum. VDF Hochschulverlag, Zurich, Switzerland.

Weijers, J.W.H., Schouten, S., van den Donker, J.C., Hopmans, E.C. and Damste, J.S.S. 2007. Environmental controls on bacterial tetraether membrane lipid distribution in soils. Geochimica et Cosmochimica Acta 71: 703-713.

Last updated 16 July 2014