 |
The Medieval Warm Period - A global Phenomenon |
Unprecedented?
As explained in the article “The rise and fall of the Hockey Stick” a central and critical plank of the alarmist global warming case is that the current phase of warming is unprecedented. The current phase of warming actually started around the beginning of the 20th century when the earth started to finally come out of the the Little Ice Age which had lasted from 1600 to 1850 when the temperature had fallen to the lowest point since the last ice age.
Since the the current warming started it has occurred in two distinct phases. The first period of warming that started around 1900 lasted up until around 1950, there was then a period of about 30 years when temperatures dropped back a bit and then around 1975 the most recent period of warming started. This latest period of warming may have come to an end as there has been no warming since around 1998 and some evidence of a temperature decline.
The CO2 hypothesis needs to show that the last period of warming since 1975 is somehow unusual or unprecedented, so unusual that a special mechanism must be at work, i.e. rising CO2 forcing up temperatures.
The claim that the latest phase of warming is unprecedented cannot rest on the rate of warming as a similar rate of warming happened in the early decades of the 20th century when CO2 levels were much lower and not much higher than the general natural background.
So in order to show that the last three or four decades have indeed been unprecedented it is very important to the CO2 hypothesis to be able to prove that the amount of warming is somehow very unusual. That the earth is warmer than is has been in the past.
This argument, that the earth is warmer than it has been and that in itself this is unusual, is weak because no one disputes that the earth was actually significantly warmer than now for most of the early and mid Holocene – the so called Climatic Optimum ( see the article “Happy Holocene“) between 5000 and 9000 years ago. This warmth of the early Holocene not only undermines the claims that the current climate is somehow unique but it also undermines the claim that any further warming will somehow trigger a disastrous runaway process because clearly this never happened in the past when temperatures pushed several degrees above the temperatures of today.
Nevertheless it is very important for the supporters of the CO2 hypothesis that something special about today’s climate can be identified and this search for something unprecedented has focussed on the claim that it is hotter now than at any time in the last 1000 years. This is a good campaigning position as for most people a 1000 years sounds a long time and you can say catchy things like this year or decade is “hottest of the millennium”.
The problem with focusing on the claim that today’s temperatures are the hottest for a 1000 years is that until the rise of the Hockey Stick model of recent climate (see the article “The rise and fall of the Hockey Stick“) it was universally understood that there had been a period called the Medieval Warm Period, which lasted roughly from AD 800 to AD 1300, when temperatures had actually been at least as warm as today and probably a bit warmer. To have such a warm period occurring so recently, a period when the climate seemed very like today’s climate, would utterly undermine the claim that today’s climate was some how special.
This meant that a central thrust of CO2 supporters has been to sideline, undermine and ultimately discredit any notion that there had been a Medieval Warm Period. The main tool for doing this has been the Hockey Stick analysis which is fully explored here.
This need to get rid of the Medieval Warm Period is occasionally made very explicit.
In 1995 David Deming a scientist from the University of Oklahoma published work he had done on reconstructing past temperatures temperatures based on bore hole studies in North America. Although he had found warming Deming remains unconvinced by the CO2 hypothesis. His article did however have the crucial word “warming” in it and he believes that because of this he was mistakenly identified as a CO2 hypothesis supporter and he was contacted Jay Overpeck, a senior scientific advisor to the IPCC who said in his email to Professor Deming, “We have to get rid of the Medieval Warm Period”.
In one of the Climategate emails sent by Michael Mann, the author of the original Hockey Stick study, he writes to Phil Jones the head of the Climate Research Unit at East Anglia, about the notion of expanding CRU charts to two millennia in an effort to “try to “contain” the putative “MWP.””
A recent controversy has arisen about the activities of William Connolley, an climate scientist and leading Green Party politician in the UK who has attempted to systematically censor Wikipedia in order to bring it into line with the CO2 alarmist position. Connelly is responsible for deleting and rewriting literally thousands of Wikipedia article relating to climate change in an extremely contentious fashion and has recently been blocked from making further changes. In February 2003 he began erasing all references to the Little Ice Age and in October 2003 he deleted all references to the Medieval Warm Period. Connelly wasn’t alone in this attempt to censor Wikipedia, a process that continues to this day, but he was super active. Wikipedia remains an intellectual battle ground.
So the CO2 alarmists must try to eliminate the Medieval Warm Period.
Except the real history wouldn’t go away and the pesky Medieval Warm Period keeps coming back to bite the CO2 crowd.
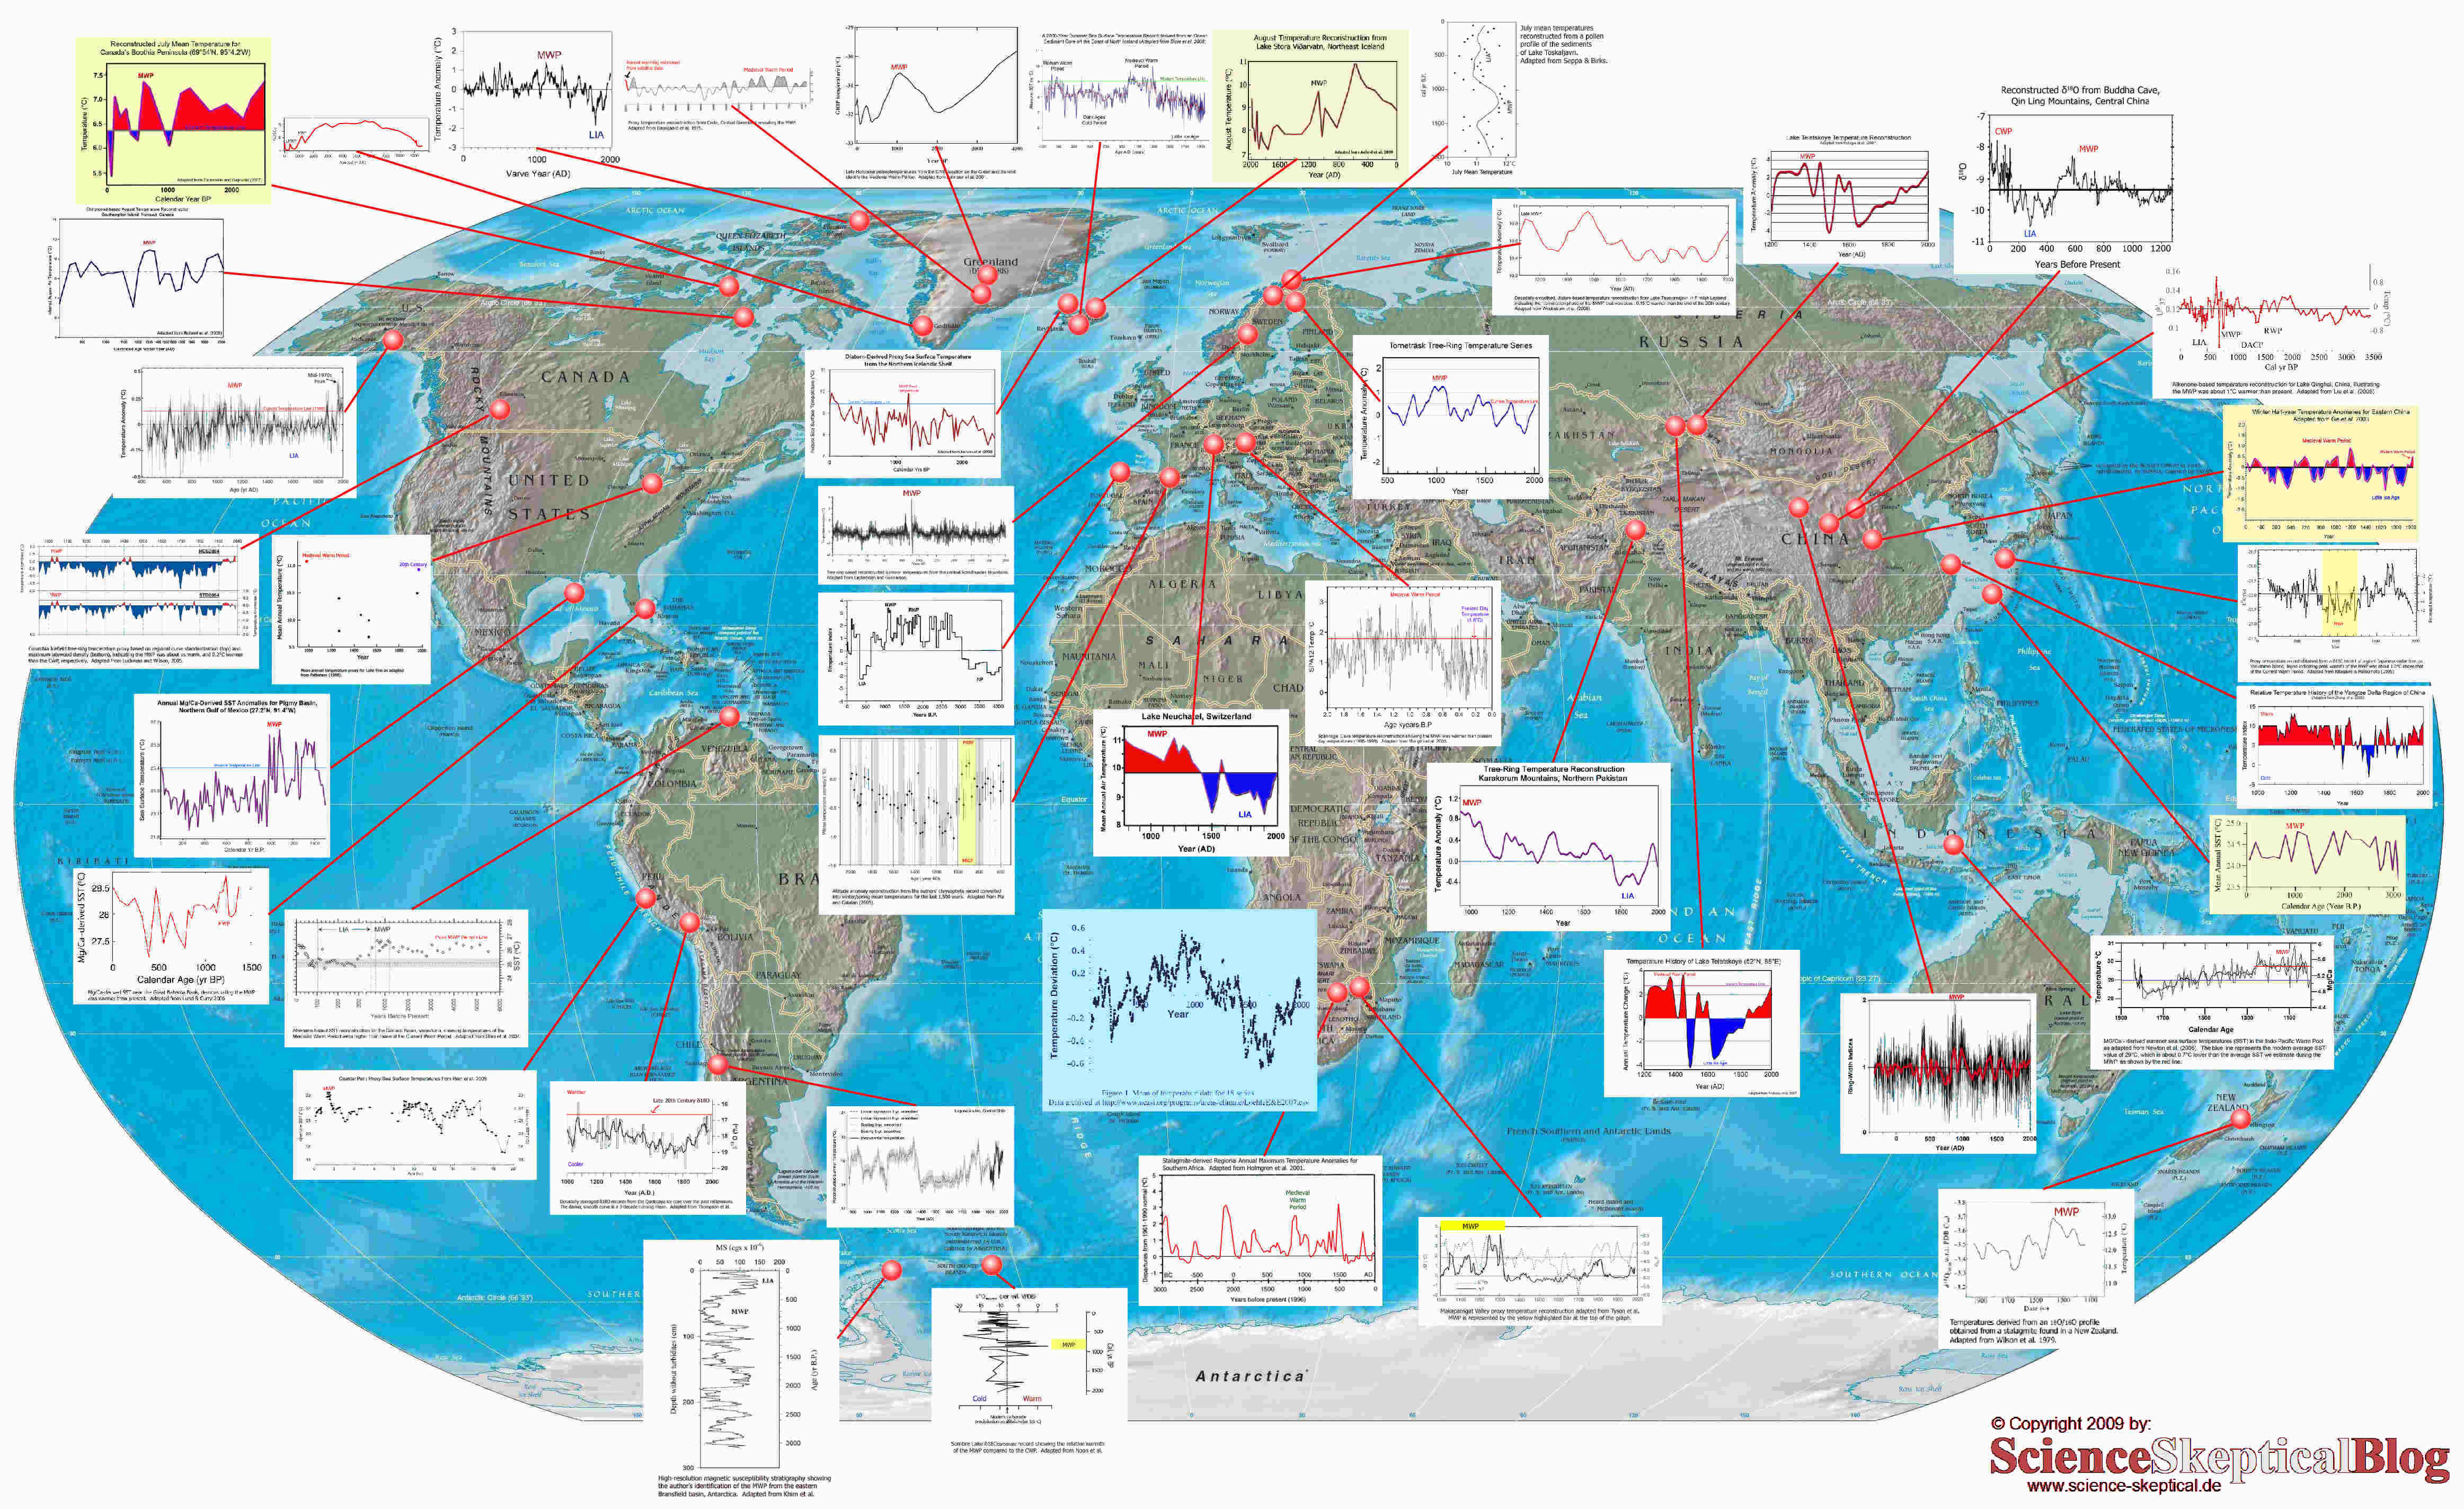
Below is a very long series of charts taken from a large number of scientific papers using a wide range of techniques to measure the past temperature in a lot of different regions from all around the globe. They all clearly show the Medieval Warm Period.
So say hello to an old friend, look at these charts and rediscover the Medieval Warm Period.
Click on each chart to see its source and read the original paper containing the data.
Click here to see a map showing the geographical location of each study and the web site with the original source material for this article.


Unprecedented? – Part 2
As explained in the article “The rise and fall of the Hockey Stick” a central and critical plank of the alarmist global warming case is that the current phase of warming is unprecedented. One aspect of proving that the warming of the last three decades has been unusual and unique, and therefore unnatural, has been to try to prove that recent temperatures have been higher than in the recent past and the article “Unprecedented?” explained how this required that the Medieval Warm Period be eliminated from the climate history.
The other argument that the the climate alarmist have put forward to try to show that the recent temperature record has been unusual has been to argue that the rate of change of temperature in recent decades has been anomalous.
Since the the current warming started it has occurred in two distinct phases. The first period of warming that started around 1900 lasted up until around 1950, there was then a period of about 30 years when temperatures dropped back a bit and then around 1975 the most recent period of warming started.
The bulk of CO2 added to the atmosphere by human activity has been added since the end of the World War 2. Those who support the claim that CO2 is responsible for all the recent warming do not argue that the warming in the first half of the 20th was caused by CO2.Therefore it should be possible to compare the rate of change of temperatures in the first half of the 20th Century, which everyone agrees was natural, with the rate of change in the second half of the 20th Century, which some claim is not natural, and see if there is a difference between the two.
Below are two graphs that both show temperature changes over a 51 year period. Both use exactly the same format for displaying the data. One chart shows the period 1885 to 1946 and the other chart shows the period 1957-2008. One, it is agreed by everyone, is caused by nature and one, it is claimed by some, is unnatural. Can you tell which is which?

The answer is that the chart on the left is for 1957 – 2008 and is considered by the climate alarmists to show unprecedented warming. What do you think?
http://www.multi-science.co.uk/mcintyre-mckitrick.pdf
ReplyDelete