Joe's Blog Reblogged from ICECAP
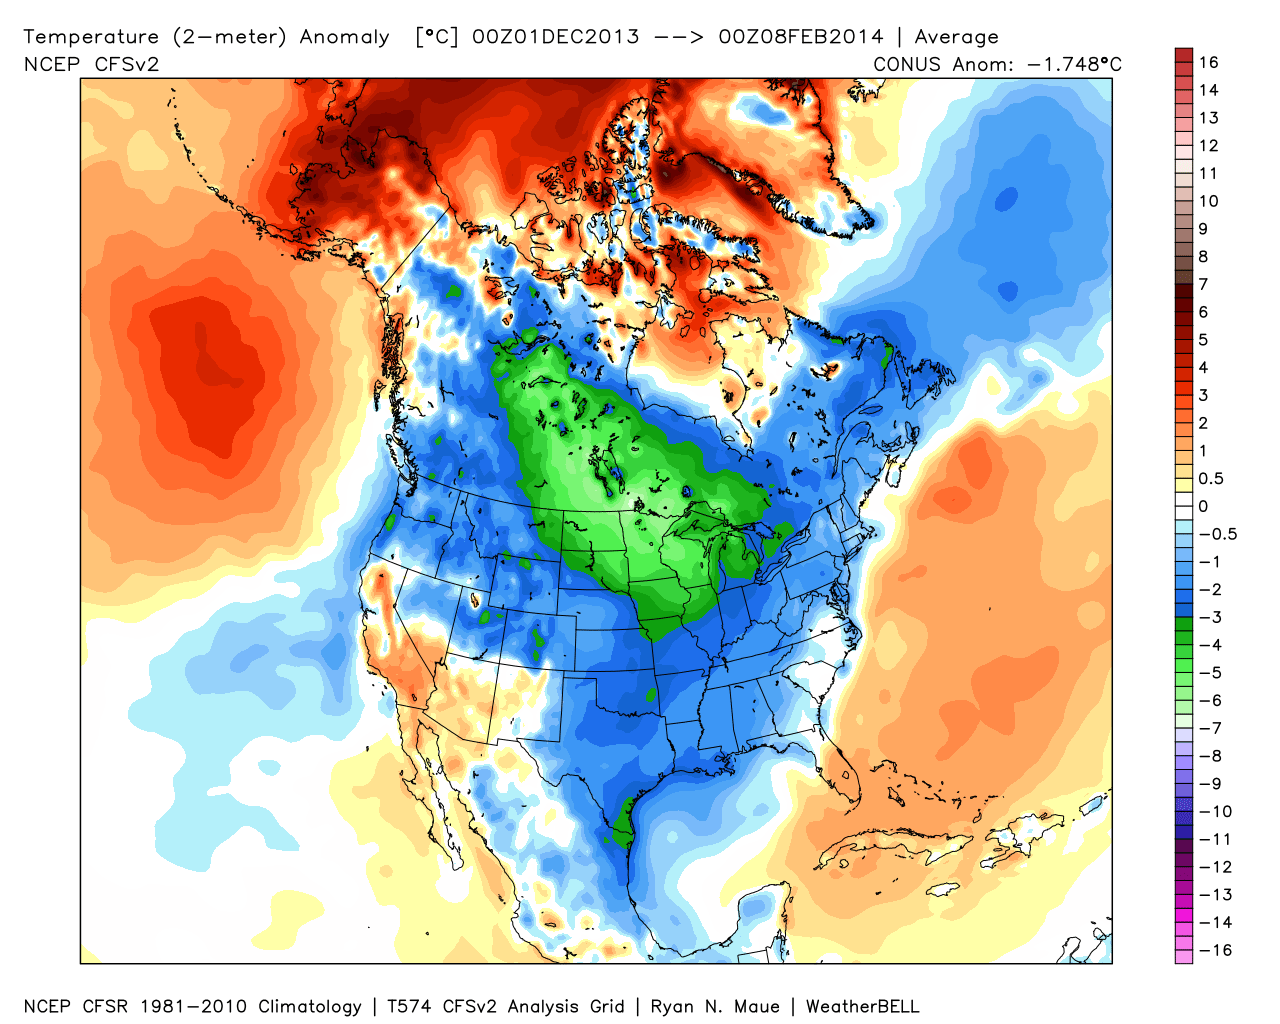
It has been a brutal winter - ranking near the coldest ever in the north central including the northwest Great Lakes region, where it has AVERAGED over 10F below normal. Tom Skilling, Chicago’s long time TV meteorologist notes
It’s been 3 decades since we’ve experienced a winter like this--and more snow’s on the way this weekend followed by another slug of arctic air Sunday night into the opening days of next week. The 2013-14 snow season has moved to 3rd snowiest of the past 129 years while meteorological winter 2013-14 ranks 8th coldest of the past 143 years.
Enlarged
The ice has increased to cover 88.4% of the Great Lakes (73,790 square miles of ice!).
_thumb.gif)
Enlarged
According o the Canadian Ice Service this past week, we trailed only 1995/96 and 1993/94 for coverage for the date. they began records in 1980. It should be noted, the modern record may have been set in 1978/79.
Enlarged
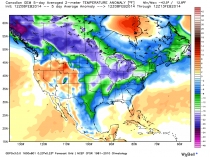
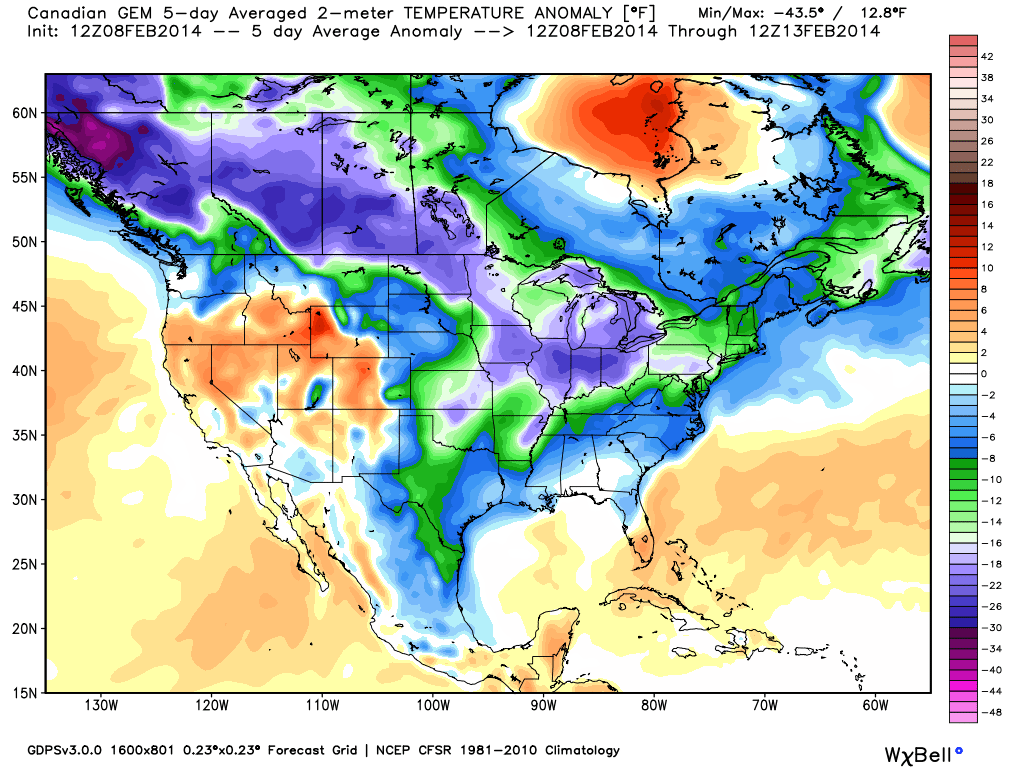
With more arctic air due the next 5 days with anomalies of minus 10 to 20F, we may surpass one or both days.
Enlarged
It should be noted most of the region has also been very snowy with 200-300% of normal snowfall. As one commenter said “if this global warming gets any worse, we are going to all freeze to death”.
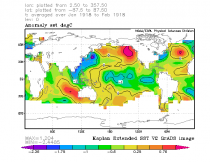
Before someone accuses me of not knowing the difference between weather and climate, I will note there is no difference. Climate is a description of weather - averages, ranges, means, and variances. I know no one who denies climate change is real. We just dispute the cause(s). And oh by the way we predicted a very cold winter and Joe Bastardi and I even speculated on Weatherbell similarity to 1917/18 and 1993/94. See how similar 1917/18 and 2013/14 were in the Pacific anomalies. Focus on the big warm pool near Alaska and warm water near Indonesia which anchored convection there.
1918 january and February mean sea surface temperature anomalies.
Enlarged
2014 january sea surface temperature anomalies
Enlarged
The oceans just as they drive the seasonal patterns drive the climate regimes over longer periods including the cooling of the 1940s to 19070s, warming from 1979 to 1998 then the pause and soon the decline.. The sun drives the ocean cycles. CO2 goes along for the ride.
No comments:
Post a Comment