The papers corroborate prior work by Joe D'Aleo and Anthony Watts, as well as other peer-reviewed publications finding most to all of the alleged global warming over the 20th century may be entirely artificial and inadequately removed by homogenization procedures.
The same authors have also submitted for open peer review 3 other papers challenging the conventional view of the physics of the atmosphere and the "greenhouse effect."
Summary: “Urbanization bias” – Papers 1-3
December 5, 2013 Our papers, Temperature records
It has been known since at least the 19th century that urban areas are warmer than rural areas. This is known as the “urban heat island” effect.
This is a serious problem for estimating global temperature trends because many weather stations are now showing warming from an urban heat island, which wouldn’t have been there 100 years ago. That is, gradual urbanization has introduced an artificial warming bias into their weather records. This bias is called “urbanization bias”.
Since the 19th century, and particularly in the last few decades, the world has become increasingly urbanized. Urban areas still only comprise about 1%. So, this doesn’t really have much impact on actual global temperature trends. But, about half of the weather stations used for analysing global temperatures are in urban areas. As a result, the estimated global temperature trends are seriously affected by this bias.
These estimated global temperature trends are the main basis for the claims that there has been “unusual global warming” since the Industrial Revolution. This means that much of the “global warming” that people are worried about is probably just urbanization bias!
Despite that, several studies have claimed that urbanization bias isn’t a problem. So, in Paper 1, we carefully analysed these studies to see if their claims were justified. In all cases, we found that they weren’t! It turns out that the authors of those studies had each made basic errors and/or hadn’t looked at their data carefully enough.
One of the groups using weather records to calculate global temperature trends has developed a computer program which they believe has removed the urbanization biases from their data. However, in Paper 2, we analysed this program in detail and found that it didn’t work. It actually introduced as many biases as it removed!
In Paper 3, we studied the main weather station archives used for calculating global temperature trends, i.e., the Historical Climatology Network datasets.
The U.S. component of the datasets was the most reliable component and most of the U.S. stations were fairly rural. However, we found that urbanization bias had introduced an artificial warming trend of about 0.7°C/century into the urban stations. To put this in context, the “unusual global warming” that has allegedly occurred since the Industrial Revolution is supposedly about 0.8°C/century.
For the rest of the world, the Historical Climatology Network datasets didn’t actually have enough rural stations with sufficiently long records to estimate global temperature trends. Only EIGHT of the rural stations had data for at least 95 of the last 100 years!
This means that the claims that there has been “unusual global warming since the Industrial Revolution” are mostly based on data from urban stations, and much of it is probably an artefact of urbanization bias.
1. Introduction
2. What is the urban heat island problem?
3. Isn’t there other evidence for global warming?
4. Paper 1. Is urbanization bias a negligible problem?
5. Paper 2. An assessment of the NASA GISS urbanization adjustment method
6. Paper 3. How heavily urbanized are the stations used in the global temperature estimates?
7. Conclusions
1. Introduction
The main basis for the claim that there has been “unusual” global warming since the Industrial Revolution arises from the various global temperature estimates constructed from weather station records. Currently there are 5 groups publishing such estimates:
NASA Goddard Institute for Space Studies (New York City, USA)
Climate Research Unit, University of East Anglia (East Anglia, UK).
NOAA National Climatic Data Center (North Carolina, USA)
Tokyo Climate Center, Japan Meteorological Agency (Tokyo, Japan)
Berkeley Earth (California, USA)
A sixth group (originally based in Russia, but now based in USA) also updated their analysis in 2006 – see Lugina et al., 2006, Carbon Dioxide Information Analysis Center (Tennessee, USA).

Figure 1. Comparison between the various weather station-based global temperature estimates, relative to 1961-1990. The solid black line represents the smoothed mean of all estimates.
All estimates imply that there has been an almost continuous 'global warming' since 1880. Many people have blamed this on the increase in CO2 concentrations since the Industrial Revolution. However, this period has also seen a dramatic increase in urban population (bottom panel). So, much of theapparent 'global warming' might just be urbanization bias. Click on image to enlarge.As can be seen from Figure 1, all of these global temperature estimates give pretty much the same result. Since the start of each estimate (usually 1880), they all suggest that global temperatures have been fairly steadily increasing by about 0.8°C/century.
Atmospheric carbon dioxide (CO2) concentrations have also been steadily rising since the late 19th century, and man-made global warming theory predicts that increasing carbon dioxide should cause “man-made global warming”. For this reason, many supporters of the theory assume that this apparent “global warming” is the “man-made global warming” their theory had predicted.
This has convinced many people that:
The man-made global warming theory must be correct
The weather station-based global warming estimates must be accurate
However, as we will discuss in this essay, many of the weather station records used for these estimates of global warming contain artificial warming biases, which are not representative of actual global temperatures.
The problem is that most weather station records are not kept for monitoring long term temperature trends. Instead, they are usually used for making more accurate weather forecasts, making farming decisions, helping air traffic control, and other similar short-term decisions.
A consequence of this is that the long-term records contain a lot of “non-climatic biases”. These are temperature changes which are not climatic, but are due to local changes in the station and its environment over the decades and centuries.
For example, if a station is re-located, a new type of thermometer is introduced, or new buildings are built to accommodate the staff, this could alter the temperature of the air in the immediate vicinity of the thermometer. If these local changes are not taken into account when the long-term temperature record is being analysed, this would mistakenly leave the impression that the climate itself had changed. In reality, it is only a change in themeasured temperature, not a change in the actual climatic temperature.
This means that the temperature trends in any weather station record are a combination of:
Actual climatic trends for the region
Non-climatic biases
One of the biggest problems in accurately calculating “global temperature” trends from weather records is in separating the two, and only including the actual climatic trends.
This is not easy. In fact, it is very challenging, e.g., see Mitchell, 1953 (Open access).
Our analysis shows that the 6 groups we mentioned above that have being calculating the “global warming” trends didn’t do a good enough job in accounting for these biases. They seem to have severely underestimated just how tricky a job it actually is.
Chief amongst these non-climatic biases is urbanization bias, and this is the focus of this essay.
On this website, we usually use the U.K. spelling for most words instead of the U.S. spelling, but most of the literature on urban heat islands uses the U.S. spelling, e.g., “urbanization” instead of “urbanisation”. So, in our papers and in this essay, we use the U.S. spelling for urbanization.
In general, urban areas tend to be warmer than rural areas. If you are a car owner and have a thermometer in your car, you may have noticed this, i.e., the temperature generally rises when you drive into an urban area and decreases when you leave an urban area.
As a result of this extra urban warmth, if a weather station becomes urbanized, this introduces an artificial warming bias into the station’s record, i.e., urbanization bias.
If a substantial fraction of all the weather stations from around the world have been affected by urbanization bias, then this could have introduced an artificial warming trend into the “global temperature trend” estimates. That would mean that some (or even all!) of the alleged “unusual global warming” since the Industrial Revolution is just an artefact of urbanization bias!
With this in mind, we decided it was to important to carefully investigate the urbanization bias problem, and check if it had been adequately dealt with. We have written a series of three companion papers describing the results of our investigation, and have submitted them for peer review on the Open Peer Review Journal forum we founded:
Urbanization bias I. Is it a negligible problem for global temperature estimates? – Ronan Connolly & Michael Connolly, 2014a
Urbanization bias II. An assessment of the NASA GISS urbanization adjustment method– Ronan Connolly & Michael Connolly, 2014b
Urbanization bias III. Estimating the extent of bias in the Historical Climatology Network datasets – Ronan Connolly & Michael Connolly, 2014c
Interested readers are welcome to read our three papers for a detailed assessment of the urbanization bias problem. However, each of the papers is quite long and technical, and so we have written this essay to provide a general overview of our main findings and conclusions.
In a nutshell, we found that urbanization bias has seriously affected the various global temperature trend estimates. It seems that most of the “unusual global warming” that we have heard so much about had absolutely nothing to do with our carbon footprint, but was just a consequence of urbanization bias!
The various attempts that have so far been made to deal with the urbanization bias problem have been woefully inadequate. In many cases, they actually seem to have made the problem even worse. The popular belief that the problem has been “dealt with” (e.g.,here, here, here, here, here, or here) just seems to be down to wishful thinking…
However, before we can discuss our findings, let us first consider in a bit more detail exactly what the urbanization bias problem is…
Summary: “Urbanization bias” – Papers 1-3
December 5, 2013 Our papers, Temperature records
 |
| Many areas around the world have become highly urbanized over the last century or so. Records of weather stations which are located in urbanized areas may show artifical warming trends due to urbanization bias. In this essay, we summarise the main points of our three “Urbanization bias” papers, which we have submitted for peer review at the Open Peer Review Journal. |
This is a serious problem for estimating global temperature trends because many weather stations are now showing warming from an urban heat island, which wouldn’t have been there 100 years ago. That is, gradual urbanization has introduced an artificial warming bias into their weather records. This bias is called “urbanization bias”.
Since the 19th century, and particularly in the last few decades, the world has become increasingly urbanized. Urban areas still only comprise about 1%. So, this doesn’t really have much impact on actual global temperature trends. But, about half of the weather stations used for analysing global temperatures are in urban areas. As a result, the estimated global temperature trends are seriously affected by this bias.
These estimated global temperature trends are the main basis for the claims that there has been “unusual global warming” since the Industrial Revolution. This means that much of the “global warming” that people are worried about is probably just urbanization bias!
Despite that, several studies have claimed that urbanization bias isn’t a problem. So, in Paper 1, we carefully analysed these studies to see if their claims were justified. In all cases, we found that they weren’t! It turns out that the authors of those studies had each made basic errors and/or hadn’t looked at their data carefully enough.
One of the groups using weather records to calculate global temperature trends has developed a computer program which they believe has removed the urbanization biases from their data. However, in Paper 2, we analysed this program in detail and found that it didn’t work. It actually introduced as many biases as it removed!
In Paper 3, we studied the main weather station archives used for calculating global temperature trends, i.e., the Historical Climatology Network datasets.
The U.S. component of the datasets was the most reliable component and most of the U.S. stations were fairly rural. However, we found that urbanization bias had introduced an artificial warming trend of about 0.7°C/century into the urban stations. To put this in context, the “unusual global warming” that has allegedly occurred since the Industrial Revolution is supposedly about 0.8°C/century.
For the rest of the world, the Historical Climatology Network datasets didn’t actually have enough rural stations with sufficiently long records to estimate global temperature trends. Only EIGHT of the rural stations had data for at least 95 of the last 100 years!
This means that the claims that there has been “unusual global warming since the Industrial Revolution” are mostly based on data from urban stations, and much of it is probably an artefact of urbanization bias.
1. Introduction
2. What is the urban heat island problem?
3. Isn’t there other evidence for global warming?
4. Paper 1. Is urbanization bias a negligible problem?
5. Paper 2. An assessment of the NASA GISS urbanization adjustment method
6. Paper 3. How heavily urbanized are the stations used in the global temperature estimates?
7. Conclusions
1. Introduction
The main basis for the claim that there has been “unusual” global warming since the Industrial Revolution arises from the various global temperature estimates constructed from weather station records. Currently there are 5 groups publishing such estimates:
NASA Goddard Institute for Space Studies (New York City, USA)
Climate Research Unit, University of East Anglia (East Anglia, UK).
NOAA National Climatic Data Center (North Carolina, USA)
Tokyo Climate Center, Japan Meteorological Agency (Tokyo, Japan)
Berkeley Earth (California, USA)
A sixth group (originally based in Russia, but now based in USA) also updated their analysis in 2006 – see Lugina et al., 2006, Carbon Dioxide Information Analysis Center (Tennessee, USA).
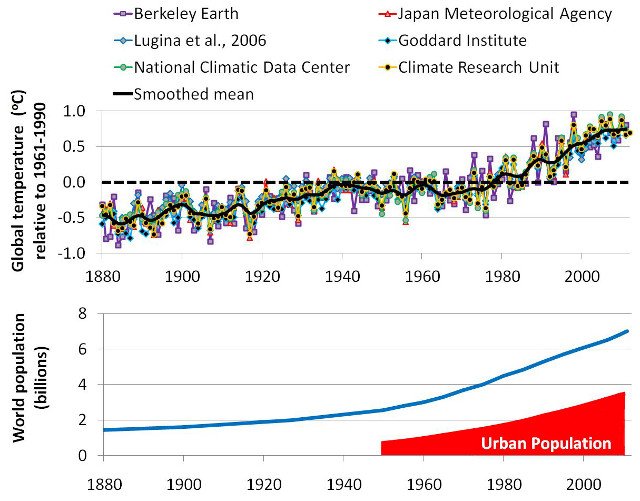
Figure 1. Comparison between the various weather station-based global temperature estimates, relative to 1961-1990. The solid black line represents the smoothed mean of all estimates.
All estimates imply that there has been an almost continuous 'global warming' since 1880. Many people have blamed this on the increase in CO2 concentrations since the Industrial Revolution. However, this period has also seen a dramatic increase in urban population (bottom panel). So, much of theapparent 'global warming' might just be urbanization bias. Click on image to enlarge.As can be seen from Figure 1, all of these global temperature estimates give pretty much the same result. Since the start of each estimate (usually 1880), they all suggest that global temperatures have been fairly steadily increasing by about 0.8°C/century.
Atmospheric carbon dioxide (CO2) concentrations have also been steadily rising since the late 19th century, and man-made global warming theory predicts that increasing carbon dioxide should cause “man-made global warming”. For this reason, many supporters of the theory assume that this apparent “global warming” is the “man-made global warming” their theory had predicted.
This has convinced many people that:
The man-made global warming theory must be correct
The weather station-based global warming estimates must be accurate
However, as we will discuss in this essay, many of the weather station records used for these estimates of global warming contain artificial warming biases, which are not representative of actual global temperatures.
The problem is that most weather station records are not kept for monitoring long term temperature trends. Instead, they are usually used for making more accurate weather forecasts, making farming decisions, helping air traffic control, and other similar short-term decisions.
A consequence of this is that the long-term records contain a lot of “non-climatic biases”. These are temperature changes which are not climatic, but are due to local changes in the station and its environment over the decades and centuries.
For example, if a station is re-located, a new type of thermometer is introduced, or new buildings are built to accommodate the staff, this could alter the temperature of the air in the immediate vicinity of the thermometer. If these local changes are not taken into account when the long-term temperature record is being analysed, this would mistakenly leave the impression that the climate itself had changed. In reality, it is only a change in themeasured temperature, not a change in the actual climatic temperature.
This means that the temperature trends in any weather station record are a combination of:
Actual climatic trends for the region
Non-climatic biases
One of the biggest problems in accurately calculating “global temperature” trends from weather records is in separating the two, and only including the actual climatic trends.
This is not easy. In fact, it is very challenging, e.g., see Mitchell, 1953 (Open access).
Our analysis shows that the 6 groups we mentioned above that have being calculating the “global warming” trends didn’t do a good enough job in accounting for these biases. They seem to have severely underestimated just how tricky a job it actually is.
Chief amongst these non-climatic biases is urbanization bias, and this is the focus of this essay.
On this website, we usually use the U.K. spelling for most words instead of the U.S. spelling, but most of the literature on urban heat islands uses the U.S. spelling, e.g., “urbanization” instead of “urbanisation”. So, in our papers and in this essay, we use the U.S. spelling for urbanization.
In general, urban areas tend to be warmer than rural areas. If you are a car owner and have a thermometer in your car, you may have noticed this, i.e., the temperature generally rises when you drive into an urban area and decreases when you leave an urban area.
As a result of this extra urban warmth, if a weather station becomes urbanized, this introduces an artificial warming bias into the station’s record, i.e., urbanization bias.
If a substantial fraction of all the weather stations from around the world have been affected by urbanization bias, then this could have introduced an artificial warming trend into the “global temperature trend” estimates. That would mean that some (or even all!) of the alleged “unusual global warming” since the Industrial Revolution is just an artefact of urbanization bias!
With this in mind, we decided it was to important to carefully investigate the urbanization bias problem, and check if it had been adequately dealt with. We have written a series of three companion papers describing the results of our investigation, and have submitted them for peer review on the Open Peer Review Journal forum we founded:
Urbanization bias I. Is it a negligible problem for global temperature estimates? – Ronan Connolly & Michael Connolly, 2014a
Urbanization bias II. An assessment of the NASA GISS urbanization adjustment method– Ronan Connolly & Michael Connolly, 2014b
Urbanization bias III. Estimating the extent of bias in the Historical Climatology Network datasets – Ronan Connolly & Michael Connolly, 2014c
Interested readers are welcome to read our three papers for a detailed assessment of the urbanization bias problem. However, each of the papers is quite long and technical, and so we have written this essay to provide a general overview of our main findings and conclusions.
In a nutshell, we found that urbanization bias has seriously affected the various global temperature trend estimates. It seems that most of the “unusual global warming” that we have heard so much about had absolutely nothing to do with our carbon footprint, but was just a consequence of urbanization bias!
The various attempts that have so far been made to deal with the urbanization bias problem have been woefully inadequate. In many cases, they actually seem to have made the problem even worse. The popular belief that the problem has been “dealt with” (e.g.,here, here, here, here, here, or here) just seems to be down to wishful thinking…
However, before we can discuss our findings, let us first consider in a bit more detail exactly what the urbanization bias problem is…
Just wondering, when US temperature data is homogenized, does the Urban Heat Island effect cause a whole sub-region to be homogenized upwards and thus propagate the bias to rural areas in the hinterland of the urban stations?
ReplyDeletegood question, could be
DeleteIt's not necessary to use surface (2m) temperature observations to reproduce the surface warming due to an enhanced greenhouse effect. For example, along with physics, the CFS Reanalysis model data set picks up this trend while assimilating a large array of sensor system data, including satellite radiance and measured green house gases.
ReplyDelete