Written Statement of John R. Christy The University of Alabama in Huntsville
Subcommittee on Energy and Power Committee on Energy and Commerce
8 March 2011
I am John R. Christy, Distinguished Professor of Atmospheric Science, Alabama’s State Climatologist and Director of the Earth System Science Center at The University of Alabama in Huntsville. I have served as a Lead Author and Contributing Author of IPCC assessments. It is a privilege for me to offer my view of climate change based on my experience as a climate scientist. My research area might be best described as building climate datasets from scratch to advance our understanding of what the climate is doing and why. This often involves weeks and months of tedious examination of paper records and digitization of data for use computational analysis. I have used traditional surface observations as well as measurements from balloons and satellites to document the climate story. Many of my datasets are used to test hypotheses of climate variability and change. In the following I will address six issues that are part of the discussion of climate change today, some of which will be assisted by the datasets I have built and published.
EXTREME EVENTS
Recently it has become popular to try and attribute certain extreme events to human causation. The Earth, however, is very large, the weather is very dynamic, especially at local scales, so that extreme events of one type or another will occur somewhere on the planet in every year. Since there are innumerable ways to define an extreme event (i.e. record high/low temperatures, number of days of a certain quantity, precipitation over 1, 2, 10 … days, snowfall amounts, etc.) this essentially requires there to be numerous “extreme events” in every year. The following assess some of the recent “extreme events” and explanations that have been offered as to their cause.
Australia
The tragic flooding in the second half of 2010 in NE Australia was examined in two ways, (1) in terms of financial costs and (2) in terms of climate history. First, when one normalizes the flood costs year by year, meaning if one could imagine that the infrastructure now in place was unchanging during the entire study period, the analysis shows there are no long-term trends in damages. In an update of Crompton and McAneney (2008) of normalized disaster losses in Australia which includes an estimate for 2010, they show absolutely no trend since 1966. Secondly, regarding the recent Australian flooding as a physical event in the context climate history (with the estimated 2010 maximum river height added to the chart below) one sees a relative lull in flooding events after 1900. Only four events reached the moderate category in the past 110 years, while 14 such events were recorded in the 60 years before 1900. Indeed, the recent flood magnitude had been exceeded six times in the last 170 years, twice by almost double the level of flooding as observed in 2010. Such history charts indicate that severe flooding is an extreme event that has occurred from natural, unforced variability. There is also a suggestion that emergency releases of water from the Wivenhoe Dam upstream of Brisbane caused “more than 80 per cent of the flood in the Brisbane River. … Without this unprecedented and massive release ... the flooding in Brisbane would have been minimal.” (The Australian 18 Jan 2011.) (See http://rogerpielkejr.blogspot.com/2011/02/flood-disasters-and-human-caused.html where Roger Pielke Jr. discusses extreme events and supplies some of the information used here.)
England Floods
Svensson et al. 2006 discuss the possibility of detecting trends in river floods, noting that much of the findings relate to “changes in atmospheric circulation patterns” such as the North Atlantic Oscillation (i.e. natural, unforced variability) which affects England. For the Thames River, there has been no trend in floods since records began in 1880 (their Fig. 5), though multi-decadal variability indicates a lull in flooding events from 1965 to 1990. The authors caution that analyzing flooding events that start during this lull will create a false positive trend with respect to the full climate record. Flooding events on the Thames since 1990 are similar to, but generally slightly less than those experienced prior to 1940. One wonders that if there are no long-term increases in flood events in England, how could a single event (Fall 2000) be pinned on human causation as in Pall et al. 2011, while previous, similar events obviously could not? Indeed, on a remarkable point of fact, Pall et al. 2011 did not even examine the actual history of flood data in England to understand where the 2000 event might have fit. As best I can tell, this study compared models with models. Indeed, studies that use climate models to make claims about precipitation events might benefit from the study by Stephens et al. 2010 whose title sums up the issue, “The dreary state of precipitation in global models.” In mainland Europe as well, there is a similar lack of increased flooding (Barredo 2009). Looking at a large, global sample, Svensson et al. found the following.
A recent study of trends in long time series of annual maximum river flows at 195 gauging stations worldwide suggests that the majority of these flow records (70%) do not exhibit any statistically significant trends. Trends in the remaining records are almost evenly split between having a positive and a negative direction.
Russia and Pakistan
An unusual weather situation developed in the summer of 2010 in which Russia experienced a very long stretch of high temperatures while a basin in Pakistan was inundated with flooding rains. NOAA examined the weather pattern and issued this statement indicating this extreme event was a part of the natural cycle of variability (i.e. natural, unforced variability) and unrelated to greenhouse gas forcing. "...greenhouse gas forcing fails to explain the 2010 heat wave over western Russia. The natural process of atmospheric blocking, and the climate impacts induced by such blocking, are the principal cause for this heat wave. It is not known whether, or to what extent, greenhouse gas emissions may affect the frequency or intensity of blocking during summer. It is important to note that observations reveal no trend in a daily frequency of July blocking over the period since 1948, nor is there an appreciable trend in the absolute values of upper tropospheric summertime heights over western Russia for the period since 1900. The indications are that the current blocking event is intrinsic to the natural variability of summer climate in this region, a region which has a climatological vulnerability to blocking and associated heat waves (e.g., 1960, 1972, 1988)."
Snowfall in the United States
Snowfall in the eastern US reached record levels in 2009-10 and 2010-11 in some locations. NOAA’s Climate Scene Investigators committee issued the following statement regarding this, indicating again that natural, unforced variability explains the events. Specifically, they wanted to know if human-induced global warming could have caused the snowstorms due to the fact that a warmer atmosphere holds more water vapor. The CSI Team’s analysis indicates that’s not likely. They found no evidence — no human “fingerprints” — to implicate our involvement in the snowstorms. If global warming was the culprit, the team would have expected to find a gradual increase in heavy snowstorms in the mid-Atlantic region as temperatures rose during the past century. But historical analysis revealed no such increase in snowfall.
In some of my own studies I have looked closely at the snowfall records of the Sierra Nevada mountains, which includes data not part of the national archive. Long- term trends in snowfall (and thus water resources) in this part of California are essentially zero, indicating no change in this valuable resource to the state (Christy and Hnilo, 2010.)
Looking at a long record of weather patterns
A project which seeks to generate consistent and systematic weather maps back to
1871 (20th Century Reanalyisis Project, http://www.esrl.noaa.gov/psd/data/20thC_Rean/) has taken a look at the three major indices which are often related to extreme events. As Dr. Gill Campo of the University of Colorado, leader of the study, noted to the Wall Street Journal (10 Feb 2011) that “… we were surprised that none of the three major indices of climate variability that we used show a trend of increased circulation going back to 1871.” (The three indices were the Pacific Walker Circulation, the North Atlantic Oscillation and the Pacific-North America Oscillation, Compo et al. 2011.) In other words, there appears to be no supporting evidence over this period that human factors have influenced the major circulation patterns which drive the larger-scale extreme events. Again we point to natural, unforced variability as the dominant feature of events that have transpired in the past 140 years. What this means today should be considered a warning – that the climate system has always had within itself the capability of causing devastating events and these will certainly continue with or without human influence. Thus, societies should plan for their infrastructure projects to be able to withstand the worst that we already know has occurred, and to recognize, in such a dynamical system, that even worse events should be expected. In other words, the set of the measured extreme events of the small climate history we have, since about 1880, does not represent the full range of extreme events that the climate system can actually generate. The most recent 130 years is simply our current era’s small sample of the long history of climate. There will certainly be events in this coming century that exceed the magnitude of extremes measured in the past 130 years in many locations. To put it another way, a large percentage of the worst extremes over the period 1880 to 2100 will occur after 2011 simply by statistical probability without any appeal to human forcing at all. Going further, one would assume that about
10 percent of the record extremes that occur over a thousand-year period ending in 2100 should occur in the 21st century. Are we prepared to deal with events even worse than we’ve seen so far? Spending resources on creating resiliency to these sure-to-come extremes, particularly drought/flood extremes, seems rather prudent to me.
A sample study of why extreme events are poor metrics for global changes
In the examples above, we don’t see alarming increases in extreme events, but we
must certainly be ready for more to come as part of nature’s variability. I want to
illustrate how one might use extreme events to conclude (improperly I believe) that the weather in the USA is becoming less extreme and/or colder. For each of the 50 states, there are records kept for the extreme high and low temperatures back to the late 19th century. In examining the years in which these extremes occurred (and depending on how one deals with “repeats” of events) we find about 80 percent of the states recorded their hottest temperature prior to 1955. And, about 60 percent of the states experienced their record cold temperatures prior to that date too. One could conclude, if they were so inclined, that the climate of the US is becoming less extreme because the occurrence of state extremes of hot and cold has diminished dramatically since 1955. Since 100 of anything is a fairly large sample (2 values for each of 50 states), this on the surface seems a reasonable conclusion. Then, one might look at the more recent record of extremes and learn that no state has achieved a record high temperature in the last 15 years (though one state has tied theirs.) However, five states have observed their all-time record low temperature in these past 15 years (plus one tie.) This includes last month’s record low of 31°F below zero in Oklahoma, breaking their previous record by a rather remarkable 4°F. If one were so inclined, one could conclude that the weather that people worry about (extreme cold) is getting worse in the US. (Note: this lowering of absolute cold temperature records is nowhere forecast in climate model projections, nor is a significant drop in the occurrence of extreme high temperature records.) I am not using these statistics to prove the weather in the US is becoming less extreme and/or colder. My point is that extreme events are poor metrics to use for detecting climate change. Indeed, because of their rarity (by definition) using extreme events to bolster a claim about any type of climate change (warming or cooling) runs the risk of setting up the classic “non-falsifiable hypothesis.” For example, we were told by the IPCC that “milder winter temperatures will decrease heavy snowstorms” (TAR WG2, 15.2.4.1.2.4). After the winters of 2009-10 and 2010-11, we are told the opposite by advocates of the IPCC position, “Climate Change Makes Major Snowstorms More Likely” (http://www.ucsusa.org/news/press_release/climate-change-makes-snowstorms-more-likely-0506.html).
The non-falsifiable hypotheses works this way, “whatever happens is consistent with my hypothesis.” In other words, there is no event that would “falsify” the hypothesis. As such, these assertions cannot be considered science or in anyway informative since the hypothesis’ fundamental prediction is “anything may happen.” In the example above if winters become milder or they become snowier, the hypothesis stands. This is not science. As noted above, there are innumerable types of events that can be defined as extreme events – so for the enterprising individual (unencumbered by the scientific method), weather statistics can supply an almost unlimited set of targets in which to discover a “useful” extreme event. Thus, when such an individual observes an unusual event, it may be tempting to define it as a once-for-all extreme metric to “prove” a point about climate change. This works both ways with extremes. If one were prescient enough to have predicted in 1996 that over the next 15 years, five states would break record cold temperatures while zero states would break record high temperatures as evidence for cooling, would that prove CO2 emissions have no impact on climate? No. Extreme events happen, and their causes are intricately tied to semi-unstable dynamical situations that can occur out of an environment of natural, unforced variability. Science checks hypotheses (assertions) by testing specific, falsifiable predictions implied by those hypotheses. The predictions are to be made in a manner that, as much as possible, is blind to the data against which the prediction is evaluated. It is the testable predictions from hypotheses, derived from climate model output, that run into trouble. Before going on, the main point here is that extreme events do not lend themselves as being rigorous metrics for convicting human emissions of being guilty of causing them.
THE UNDERLYING TEMPERATURE TREND
As noted earlier, my main research projects deal with building climate datasets from scratch to document what the climate has done and to test assertions and hypotheses about climate change.
In 1994, Nature magazine published a study of mine in which we estimated the underlying rate at which the world was warming by removing the impacts of volcanoes and El Niños (Christy and McNider 1994.) This was important to do because in that particular 15-year period (1979-1993) there were some significant volcanic cooling episodes and strong El Niños that convoluted what would have been the underlying trend. The result of that study indicated the underlying trend for 1979-1993 was +0.09 °C/decade which at the time was one third the rate of warming that should have been occurring according to estimates by climate model simulations.
Above: update of Christy and McNider 1994: Top curve: Monthly global atmospheric temperature anomalies 1979-2010 (TLT). 2nd: (SST) the influence of tropical sea surface temperature variations on the global temperature. 3rd: (TLT-SST) global temperature anomalies without the SST influence. 4th (VOL) The effect of volcanic cooling on global temperatures (El Chichon 1982 and Mt. Pinatubo 1991). Bottom: (TLT-SST-VOL) underlying trend once SST and VOL effects are removed. The average underlying trend of TLT-SST-VOL generated from several parametric variations of the criteria used in these experiments was +0.09 °C/decade. Lines are separated by 1°C. I have repeated that study for this testimony with data which now cover 32 years as shown above (1979-2010.) In an interesting result, the new underlying trend remains a modest +0.09 C/decade for the global tropospheric temperature, which is still only one third of the average rate the climate models project for the current era (+0.26°C/decade.)
There is no evidence of acceleration in this trend. This evidence strongly suggests that climate model simulations on average are simply too sensitive to increasing greenhouse gases and thus overstate the warming of the climate system (see below under climate sensitivity.) This is an example of a model simulation (i.e. hypothesis) which can provide a “prediction” to test: that “prediction” being the rate at which the Earth’s atmosphere should be warming in the current era. In this case, the model-average rate of warming fails the test (see next.)
PATTERNS OF WARMING
Through the years there have been a number of publications which have specifically targeted two aspects of temperature change in which observations and models can be compared. The results of both comparisons suggest there are significant problems with the way climate models represent the processes which govern the atmospheric temperature. In the first aspect of temperature change, we have shown that the pattern of change at the surface does indeed show warming over land. However, in very detailed analyses of localized areas in the US and Africa we found that this warming is dominated by increases in nighttime temperatures, with little change in daytime temperatures. This pattern of warming is a classic signature of surface development (land cover and land use change) by human activities. The facts that (a) the daytime temperatures do not show significant warming in these studies and (b) the daytime temperature is much more representative of the deep atmospheric temperature where the warming due to the enhanced greenhouse effect should be evident, lead us to conclude that much of the surface temperature warming is related to surface development around the thermometer sites. This type of surface development interacts with complexities of the nighttime boundary layer which leads to warming not related to greenhouse warming (Christy et al. 2006, 2009, see also Walters et al. 2007, Pielke, Sr. 2008.)
The second set of studies investigates one of the clearest signatures or fingerprints of greenhouse gas warming as depicted in climate models. This signature consists of a region of the tropical upper atmosphere which in models is shown to warm at least twice as fast as the surface rate of warming. We, and others, have tested this specific signature, i.e. this hypothesis, against several observational datasets and conclude that this pervasive result from climate models has not been detected in the real atmosphere. In addition, the global upper atmosphere is also depicted in models to warm at a rate faster than the surface. Again, we did not find this to be true in observations (Klotzbach et al. 2010.)
The following are quotes from three of the recent papers which come to essentially the same conclusion as earlier work published in Christy et al. 2007 and Douglass et al. 2007. Table 2 displays the new per decade linear trend calculations [of difference between global surface and troposphere using model amplification factor] … over land and ocean. All trends are significant[ly different] at the 95% level. Klotzbach et al. 2010. [Our] result is inconsistent with model projections which show that significant amplification of the modeled surface trends occurs in the modeled tropospheric trends. Christy et al. 2010. Over the interval 1979-2009, model-projected temperature trends are two to four times larger than observed trends in both the lower and mid-troposphere and the differences are statistically significant at the 99% level. McKitrick et al 2010.
Again we note that these (and other) studies have taken “predictions” from climate model simulations (model outputs are simply hypotheses), have tested these predictions against observations, and found significant differences.
CLIMATE SENSITIVITY AND FEEDBACKS
One of the most misunderstood and contentious issues in climate science surrounds the notion of climate sensitivity. Climate sensitivity is a basic variable that seeks to quantify the temperature response of the Earth to a particular forcing, for example answering the question, how much warming can be expected if the warming effect of doubling CO2 acts on the planet? The temperature used in this formulation is nearly always the surface temperature, which is a rather poor metric to serve as a proxy for the total heat content of the climate system, but that is the convention in use today. In any case, it is fairly well agreed that the surface temperature will rise about 1°C as a modest response to a doubling of atmospheric CO2 if the rest of the component processes of the climate system remain independent of this response. This is where the issue becomes uncertain: the complexity and interrelatedness of the various components of the climate system (e.g. clouds) mean they will not sit by independently while CO2 warms the planet a little, but will get into the act too. The fundamental issue in this debate is whether the net response of these interrelated actors will add to the basic CO2 warming (i.e. positive feedbacks) or subtract from the basic CO2 warming (i.e. negative feedbacks.)
Since climate models project a temperature rise on the order of 3 °C for a doubling of CO2, it is clear that in the models, positive feedbacks come into play to increase the temperature over and above the warming effect of CO2 alone, which is only about 1°C. However, given such observational results as noted earlier (i.e. warming rates of models being about three times that of observations) one can hypothesize that there must be negative feedbacks in the real world that counteract the positive feedbacks which dominate model processes.
My colleague at UAHuntsville, Dr. Roy Spencer, has searched tediously for a way to calculate climate sensitivity from satellite observations which at the same time would reveal the net response of the feedbacks which is so uncertain today. NASA and NOAA have placed in orbit some terrific assets to answer questions like this. Unfortunately, the best observations to address this issue are only about 10 years in length, which prevents us from directly calculating the sensitivity to 100 years of increasing CO2. However, the climate sensitivity over shorter periods to natural, unforced variability can be assessed, and this is what Dr. Spencer has done. To put it simply, Spencer tracks large global temperature changes over periods of several weeks. It turns out the global temperature rises and falls by many tenths of a degree over such periods. Spencer is able to measure the amount of heat that accumulates in (departs from) the climate system as the temperature rises (falls) with temperature changes. When all of the math is done, he finds the real climate system is dominated by negative feedbacks (probably related to cloud variations) that work against changes in temperature once that temperature change has occurred. When this same analysis is applied to climate model output (i.e. apples to apples comparisons), the result is very different, with all models showing positive feedbacks, i.e. helping a warming impulse to warm the atmosphere even more (see figure below.) Thus, the observations and models are again inconsistent. On this time scale in which feedbacks can be assessed, Spencer sees a significant difference between the way the real Earth processes heat and the way models do. This difference is very likely found in the way models treat cloudiness, precipitation and/or heat deposition into the ocean. This appears to offer a strong clue as to why climate models tend to overstate the warming rate of the global atmosphere.
Below: Climate feedback parameter from observations (blue, top line) and IPCC AR4 model simulations (other lines, derived from results in Spencer and Braswell 2010.) Model parameters cluster in a grouping that indicates considerably more sensitivity to forcing than indicated by observations.
The bottom line of this on-going research is that over time periods for which we are able to determine climate sensitivity, the evidence suggests that all models are characterized by feedback processes that are more positive than feedback processes measured in nature.
CONSENSUS SCIENCE
The term “consensus science” will often be appealed to in arguments about climate change. This is a form of “argument from authority.” Consensus, however, is a political notion, not a scientific notion. As I testified to the Inter-Academy Council last June, the IPCC and other similar Assessments do not represent for me a consensus of much more than the consensus of those who already agree with a particular consensus. The content of these reports is actually under the control of a relatively small number of individuals - I often refer to them as the “climate establishment” – who through the years, in my opinion, came to act as gatekeepers of scientific opinion and information, rather than brokers. The voices of those of us who object to various statements and emphases
in these assessments are by-in-large dismissed rather than acknowledged.
I’ve often stated that climate science is a “murky science.” We do not have laboratory methods of testing our hypotheses as many other sciences do. As a result, opinion, arguments from authority, dramatic press releases, and notions of consensus tend to pass for science in our field when they should not.
I noticed the House has passed an amendment to de-fund the Intergovernmental Panel on Climate Change (IPCC.) I have a proposal here. If the IPCC activity is ultimately funded by US taxpayers, then I propose that ten percent of the funds be allocated to a group of well-credentialed scientists with help from individuals
experienced in creating verifiable reports, to produce an assessment that expresses alternative hypotheses that have been (in their view) marginalized, misrepresented or minimized in previous IPCC reports. We know from climategate emails and many other sources of information that the IPCC has had problems with those who take different positions on climate change. Topics to be addresses in this assessment, for example, would include (a) evidence for a low climate sensitivity to increasing greenhouse gases, (b) the role and importance of natural, unforced variability, (c) a rigorous evaluation of climate model output, (d) a thorough discussion of uncertainty, (e) a focus on metrics that most directly relate to the rate of accumulation of heat in the climate system (which, for example, the problematic surface temperature record does not represent), (f) analysis of the many consequences, including benefits, that result from CO2 increases, and (g) the importance that accessible energy has to human health and welfare. What this proposal seeks to accomplish is to provide to the congress and other policymakers a parallel, scientifically-based assessment regarding the state of climate science which addresses issues which here-to-for have been un- or under-represented by previous tax-payer funded, government-directed climate reports.
IMPACT OF EMISSION CONTROL MEASURES
The evidence above suggests that climate models overestimate the response of temperature to greenhouse gas increases. Even so, using these climate model simulations we calculate that the impact of legislative actions being considered on the global temperature is essentially imperceptible. These actions will not result in a measurable climate effect that can be attributable or predictable with any level of confidence, especially at the regional level.
When I testified before the Energy and Commerce Oversight and Investigations subcommittee in 2006 I provided information on an imaginary world in which 1,000 1.4 gW nuclear power plants would be built and operated by 2020. This, of course, will not happen. Even so, this Herculean effort would result in at most a 10 percent reduction in global CO2 emissions, and thus exert a tiny impact on whatever the climate is going to do. Indeed, with these most recent estimates of climate sensitivity, the impact of these emission control measures will be even tinier since the climate system doesn’t seem to be very sensitive to CO2 emissions. (Note: we have not considered the many positive benefits of higher concentrations of CO2 in the atmosphere, especially for the biological world, nor the tremendous boost to human health, welfare, and security provided by affordable, carbon-based energy. As someone who has lived in a developing country, I can assure the subcommittee that without energy, life is brutal and short.) Coal use, which generates a major portion of CO2 emissions, will continue to rise as indicated by the Energy Information Administration’s chart below. Developing countries in Asia already burn more than twice the coal that North America does, and that discrepancy will continue to expand. The fact our legislative actions will be inconsequential in the grand scheme of things can be seen by noting that these actions attempt to bend the blue, North American curve, which is already fairly flat, down a little. So, downward adjustments to North American coal use will have virtually no effect on global CO2 emissions (or the climate), no matter how sensitive one thinks the climate system might be to the extra CO2 we are putting back into the atmosphere.
Thus, if the country deems it necessary to de-carbonize civilization’s main energy sources, sound and indeed compelling reasons beyond human-induced climate change need to be offered. Climate change alone is a weak leg on which to stand for such a massive undertaking. (I’ll not address the fact there is really no demonstrated technology except nuclear that can replace large portions of the carbon-based energy production.)
Thank you for this opportunity to offer my views on climate change.
References
Barredo, J.I., 2009: Normalized flood losses in Europe: 1970-2006. Nat. Hazards Earth
Syst. Sci., 9, 97-104.
Christy, J.R. and J.J. Hnilo, 2010: Changes in snowfall in the southern Sierra Nevada of
California since 1916. Energy & Env., 21, 223-234.
Christy, J.R., W.B. Norris and R.T. McNider, 2009: Surface temperature variations in
East Africa and possible causes. J. Clim. 22, DOI: 10.1175/2008JCLI2726.1.
Christy, J. R., W. B. Norris, R. W. Spencer, and J. J. Hnilo, 2007: Tropospheric temperature change since 1979 from tropical radiosonde and satellite measurements, J. Geophys. Res., 112, D06102, doi:10.1029/2005JD006881.
Christy, J.R., W.B. Norris, K. Redmond and K. Gallo, 2006: Methodology and results of
calculating central California surface temperature trends: Evidence of human- induced climate change? J. Climate, 19, 548-563.
Christy, J.R. and R.T. McNider, 1994: Satellite greenhouse signal? Nature, 367, 325. Compo, G.P. et al. 2011. Review Article: The Twentieth Century Reanalysis Project. Q.
J. R. Meteorol. Soc., 137, 1-28.
Crompton, R. and J. McAneney, 2008: The cost of natural disasters in Australia: the case
for disaster risk reduction. Australian J. Emerg. Manag., 23, 43-46. Douglass, D.H., J.R. Christy, B.D. Pearson and S.F. Singer, 2007: A comparison of
tropical temperature trends with model predictions. International J. Climatology, DOI: 10.1002/joc.1651.
Klotzbach, P. J., R. A. Pielke Sr., R. A. Pielke Jr., J. R. Christy, and R. T. McNider
(2009), An alternative explanation for differential temperature trends at the
surface and in the lower troposphere, J. Geophys. Res., 114, D21102, doi:10.1029/2009JD011841.
Pall, P., T. Aina, D. A. Stone, P. A. Stott, T. Nozawa, A. G. J. Hilberts, D. Lohmann and
M. R. Allen, 2011: , Nature.
Spencer, R.W. and W.D. Braswell, 2010:
Stephens, G. et al. 2010: The dreary state of precipitation in global models. J. Geophys.
Res., 115, doi:101029/1010JD014532.
Svensson, C., J. Hannaford, Z. Kundzewicz and T. Marsh, 2006: Trends in river floods,
why is there no clear signal in the observations? Frontiers in flood research. Tchiguirinskaia, I., Thein, K., Hubert, P. International Association of Hydrological Sciences, International Hydrological Programme, Publ 305, 1-18.
Walters, J.T., R.T. McNider, X. Shi, W.B. Norris and J.R. Christy, 2007: Positive
surface temperature feedback in the stable nocturnal boundary layer. Geophys. Res. Lett. doi:10.1029/2007GL029505.
Showing posts sorted by relevance for query there is no place for consensus in science. Sort by date Show all posts
Showing posts sorted by relevance for query there is no place for consensus in science. Sort by date Show all posts
Tuesday, March 8, 2011


Tuesday, February 23, 2010
Great Reply to a Fan of AGW
From The Viscount Monckton of Brenchley
- I try to answer as many enquiries as I can from people who want to discuss “global warming”. I wrote this letter in reply to a “global warming” fanatic who, it is not unfair to say, had never actually thought about the superstition to which he subscribes. Perhaps this letter will make him think a little more and believe a little less.
Dear Enquirer, – Thank you for taking the trouble to write to me. If I may, I shall highlight various passages from your letter in bold face, and then respond to them seriatim in Roman face.
“I am not a climate scientist, and so I can only go by the overwhelming consensus amongst scientists that man-made climate change is occurring and that it poses a grave threat to humanity.”
First, science is not – repeat not – done by consensus. Aristotle, in codifying the dozen worst fallacies to which mankind is prone, described this one as the “head-count fallacy”, or, as the mediaeval schoolmen called it, the argumentum ad populum. Merely because many people say they believe a thing to be true, they do not necessarily believe it to be true and, even if they do, it need not necessarily be true. Abu Ali Ibn al-Haytham, the astronomer, mathematician and philosopher of science in 11th-century Iraq who is credited as the father of the scientific method, said this –
“The seeker after truth does not put his faith in any mere consensus, however broad and however venerable. Instead, he subjects what he has learned from it to scrutiny using his hard-won scientific knowledge, and he verifies for himself whether it is true. The road to the truth is long and hard, but that is the road we must follow.”
Tuesday, December 15, 2009
100 Reasons why climate change is Natural, not Man-Made
HERE are the top 100 reasons, released in a dossier issued by the European Foundation, why climate change is natural and not man-made:
1) There is “no real scientific proof” that the current warming is caused by the rise of greenhouse gases from man’s activity.
2) Man-made carbon dioxide emissions throughout human history constitute less than 0.00022 percent of the total naturally emitted from the mantle of the earth during geological history.
3) Warmer periods of the Earth’s history came around 800 years before rises in CO2 levels.
HERE are the top 100 reasons, released in a dossier issued by the European Foundation, why climate change is natural and not man-made:
1) There is “no real scientific proof” that the current warming is caused by the rise of greenhouse gases from man’s activity.
2) Man-made carbon dioxide emissions throughout human history constitute less than 0.00022 percent of the total naturally emitted from the mantle of the earth during geological history.
3) Warmer periods of the Earth’s history came around 800 years before rises in CO2 levels.
2) Man-made carbon dioxide emissions throughout human history constitute less than 0.00022 percent of the total naturally emitted from the mantle of the earth during geological history.
3) Warmer periods of the Earth’s history came around 800 years before rises in CO2 levels.
Saturday, June 28, 2014
What some climate scientists are really ticked-off about
Warmist Graham Readfearn of The Guardian has a piece today titled, "What really annoys scientists about the state of the climate change debate?," in which he interviews the usual alarmist suspects such as Michael Mann and Stefan Rahmstorf about "what is it that really gets them annoyed?"
Mann is ticked off that
Mann is ticked off that
"model projections have underestimated the rate and magnitude of the climate changes resulting from our burning of fossil fuels"
such as the zero global warming over the past 18 years. He's also most pissed off that "Rather than being cause for inaction, uncertainty is a reason to act all the sooner."
Rahmstorf says
Michael Raupach says

Roger Jones is pissed off about a lot of things including
Sophie Lewis thinks
Illuminating that these scientists are most upset about politics and one-sided scientific arguments with scant scientific evidence to back them up, and for which ample conflicting evidence exists.
Readfearn's article, with [added comments, highlights, graphs, and links]:

What really annoys scientists about the state of the climate change debate?
From misinformed politicians who should 'shut up', to a failure of large parts of society to grasp reality, climate scientists reveal their bugbears
Professor Andrew Pitman, director of the Australian Research Council’s Centre of Excellence for Climate System Science, University of New South Wales, Sydney
Many people who would not dream to claim they understand how antibiotics, microprocessors or immunisations work seem happy to wax lyrical on their views on climate change.
A politician or media identity who would be laughed out of office if they said “vaccines don't work" or “I am certain the moon is made of cheese" happily speak equivalent rubbish on climate science, believing their views deserve credit.
I want engineers to build bridges; I want a trained surgeon to operate on hearts and I want some of our decision-makers and commentators to either shut up, or familiarise themselves with climate science well enough to talk sense.
Professor Michael Mann, director of Penn State Earth System Science Center, United States
If there’s one concept that is typically misrepresented in the public discourse on climate change, it is the concept of uncertainty.
There are uncertainties in model projections of future climate change. However, these uncertainties cut both ways, and in many cases it appears that model projections have underestimated the rate and magnitude of the climate changes resulting from our burning of fossil fuels and emission of greenhouse gases into the atmosphere. The rapid lost of Arctic sea ice is one such example.


Dr Sophie Lewis, research fellow in the School of Earth Sciences at the University of Melbourne
I get annoyed when I hear yet another politician arguing that we can’t link extreme events to climate change. You know the spurious reasoning? Australia’s always had heatwaves/floods/fires, so this recent extreme is nothing to worry about. When I hear this, it’s time to turn off the TV.
Climate scientists don’t just guess at what contributed to recent extremes. We methodically calculate changes in the risk of extremes due to human factors, like greenhouse gases. I don’t just get irate out of principle.
Dismissing the link between climate change and extremes as hogwash leaves us vulnerable to a warmer climate. [see above comments on extremes]
A consequent shift from conditions, which have allowed agriculture to take place from about 8,000 years ago, would render large parts of the continents unsuitable for cultivation.
Rahmstorf says
"One of the phrases that makes me cringe is when I read in the media that a particular extreme weather event "is no evidence for climate change". This is so bad it's not even wrong, but it is quite misleading."
Notes for Rahmstorf: Even the IPCC SREX says a particular extreme weather event is not evidence for climate change, and there is no evidence that climate has become more variable or extreme.
Andrew Pitman says
Andrew Pitman says
"I want some of our decision-makers and commentators to either shut up, or familiarise themselves with climate science well enough to talk sense."apparently unfamiliar with the concepts of free speech, scientific or political debate.
Michael Raupach says
"humankind is encountering the finitude of our planet"i.e. the end of the planet is near and we're not doing enough.
Roger Jones is pissed off about a lot of things including
I can buy disaffected scientists to deny sound science with a plane fare to a bogus conference and a little publicity.Andrew Glickson is most upset about "irreversible tipping points," which have never occurred in Earth's 3.5 billion year history with CO2 levels 17-25 times higher than the present.
Sophie Lewis thinks
"Dismissing the link between climate change and extremes as hogwash leaves us vulnerable to a warmer climate."while ignoring that there is no evidence that climate has become more variable or extreme, paleoclimate evidence shows extreme weather is more common during cold periods, and many climate models predict less extreme weather in a warmer climate.
Illuminating that these scientists are most upset about politics and one-sided scientific arguments with scant scientific evidence to back them up, and for which ample conflicting evidence exists.
Readfearn's article, with [added comments, highlights, graphs, and links]:
What really annoys scientists about the state of the climate change debate?
From misinformed politicians who should 'shut up', to a failure of large parts of society to grasp reality, climate scientists reveal their bugbears
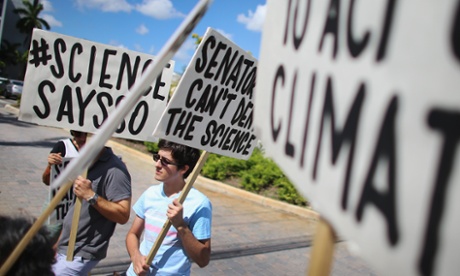
Protesters at the office of a US senator who doubts the evidence of human-caused climate change.
“Don’t shoot the messenger,” so the saying goes.
But what if that message warns we might want to rethink that whole fossil fuel burning thing pretty quick because it could seriously alter civilization and the natural world for centuries to come, and not in a good way?
Time to get the bullets out and start firing, obviously.
Climate scientists have been trying to dodge, catch or deflect those bullets for decades.
They are now all too used to being shot at, kicked and maligned as their findings are misunderstood, misrepresented, trivialised or booted around like footballs between politicians and other warring ideological factions and self-interested industry groups.
But if they had to pick one thing, what is it that really gets them annoyed?
When the public tries to understand the implications of their scientific findings – or just understand the findings themselves – what’s the most common mistake they see?
When the media gets hold of their findings, what makes climate scientists chuck a shoe, ice core or physics textbook at the screen in frustration?
I decided to ask a few leading climate scientists from around the globe to articulate that one thing that leaves them totally tacked off.
Some struggled to pick only a single bugbear (one even called to apologise for taking too long, so spoilt for choice were they), others took the chance to uncompromisingly unload their frustrations.
Here’s what they had to say.
“Don’t shoot the messenger,” so the saying goes.
But what if that message warns we might want to rethink that whole fossil fuel burning thing pretty quick because it could seriously alter civilization and the natural world for centuries to come, and not in a good way?
Time to get the bullets out and start firing, obviously.
Climate scientists have been trying to dodge, catch or deflect those bullets for decades.
They are now all too used to being shot at, kicked and maligned as their findings are misunderstood, misrepresented, trivialised or booted around like footballs between politicians and other warring ideological factions and self-interested industry groups.
But if they had to pick one thing, what is it that really gets them annoyed?
When the public tries to understand the implications of their scientific findings – or just understand the findings themselves – what’s the most common mistake they see?
When the media gets hold of their findings, what makes climate scientists chuck a shoe, ice core or physics textbook at the screen in frustration?
I decided to ask a few leading climate scientists from around the globe to articulate that one thing that leaves them totally tacked off.
Some struggled to pick only a single bugbear (one even called to apologise for taking too long, so spoilt for choice were they), others took the chance to uncompromisingly unload their frustrations.
Here’s what they had to say.
Professor Andrew Pitman, director of the Australian Research Council’s Centre of Excellence for Climate System Science, University of New South Wales, Sydney
Many people who would not dream to claim they understand how antibiotics, microprocessors or immunisations work seem happy to wax lyrical on their views on climate change.
A politician or media identity who would be laughed out of office if they said “vaccines don't work" or “I am certain the moon is made of cheese" happily speak equivalent rubbish on climate science, believing their views deserve credit.
I want engineers to build bridges; I want a trained surgeon to operate on hearts and I want some of our decision-makers and commentators to either shut up, or familiarise themselves with climate science well enough to talk sense.
Professor Michael Mann, director of Penn State Earth System Science Center, United States
If there’s one concept that is typically misrepresented in the public discourse on climate change, it is the concept of uncertainty.
There are uncertainties in model projections of future climate change. However, these uncertainties cut both ways, and in many cases it appears that model projections have underestimated the rate and magnitude of the climate changes resulting from our burning of fossil fuels and emission of greenhouse gases into the atmosphere. The rapid lost of Arctic sea ice is one such example.
Rather than being cause for inaction, uncertainty is a reason to act all the sooner.
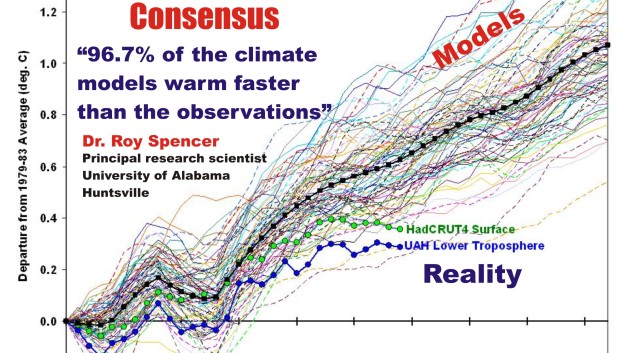
Notes for Michael Mann: 97% of the climate models have exaggerated, not "underestimated the rate and magnitude of the climate changes resulting from our burning of fossil fuels and emission of greenhouse gases into the atmosphere." Arctic sea ice has essentially stabilized since 2007 while Antarctic sea ice is at record highs. Global sea ice is significantly above the satellite era average.
 |
| Global sea ice is significantly above the long-term average |
Professor Michael Raupach, director of the Climate Change Institute, Australian National University, Canberra
The greatest cause for sorrow is the widespread inability of the public discussion to recognise the whole picture.
Much of the political discourse reduces the complexities of climate change to political football (“axe the tax”); much media reporting sees only the hook to today’s passing story; many interest groups want to use climate change to proselytise for their particular get-out-of-jail free card (nuclear power, carbon farming).
All of this misses or trivialises the real, systemic significance of climate change: that humankind is encountering the finitude of our planet, [the end is near] confronting the need to share and protect our endowment from nature, and realising that much will have to change to make this possible.
The greatest cause for sorrow is the widespread inability of the public discussion to recognise the whole picture.
Much of the political discourse reduces the complexities of climate change to political football (“axe the tax”); much media reporting sees only the hook to today’s passing story; many interest groups want to use climate change to proselytise for their particular get-out-of-jail free card (nuclear power, carbon farming).
All of this misses or trivialises the real, systemic significance of climate change: that humankind is encountering the finitude of our planet, [the end is near] confronting the need to share and protect our endowment from nature, and realising that much will have to change to make this possible.
Professor Richard Betts, chair in Climate Impacts at the College of Life and Environmental Sciences, University of Exeter, UK
The thing that bugs me most about the way climate change is talked about in the media is journalists citing scientific papers without providing a link to the original paper.
Readers often want to get more details or simply check sources, but this is very difficult (or sometimes impossible) if the source is not given. I've raised this a few times, and get lame excuses like 'readers get frustrated when the journals are paywalled' but that's not good enough. Media should provide sources – end of.
The thing that bugs me most about the way climate change is talked about in the media is journalists citing scientific papers without providing a link to the original paper.
Readers often want to get more details or simply check sources, but this is very difficult (or sometimes impossible) if the source is not given. I've raised this a few times, and get lame excuses like 'readers get frustrated when the journals are paywalled' but that's not good enough. Media should provide sources – end of.
Professor Steven Sherwood, director of the Climate Change Research Centre at the University of New South Wales, Sydney
Where to start?
These are things I don’t see (or don’t see enough).
First is still that, even though it is clear greenhouse gas emissions raise the temperature of the Earth, we’ve known this for 50+ years and no reputable atmospheric scientist in the world disputes this, most people think scientists disagree. They’ve been misled by the media, and I’ve been told repeatedly by reporters in the US and Australia that this is due to pressure from management.
Second is the fact that carbon dioxide emissions are effectively irreversible and will stay in the climate system for hundreds of generations is seldom noted. [false] If we decide later that this was a huge mistake there is no going back (practically speaking).
On the political side, I wish the media would note the obvious parallels of the carbon debate with past ones over restricting pollutants (mercury, lead, asbestos, CFCs), where claims that restrictions would be economically catastrophic never came true.
These are things I do see that bug me.
One would be phrases like “action on climate change”. We should be talking about “action on carbon dioxide” — and climate is only one reason (albeit the biggest) that too much of it is dangerous. Nothing we do with respect to any other influence on climate will prevent global warming if CO2 keeps climbing.
Where to start?
These are things I don’t see (or don’t see enough).
First is still that, even though it is clear greenhouse gas emissions raise the temperature of the Earth, we’ve known this for 50+ years and no reputable atmospheric scientist in the world disputes this, most people think scientists disagree. They’ve been misled by the media, and I’ve been told repeatedly by reporters in the US and Australia that this is due to pressure from management.
Second is the fact that carbon dioxide emissions are effectively irreversible and will stay in the climate system for hundreds of generations is seldom noted. [false] If we decide later that this was a huge mistake there is no going back (practically speaking).
On the political side, I wish the media would note the obvious parallels of the carbon debate with past ones over restricting pollutants (mercury, lead, asbestos, CFCs), where claims that restrictions would be economically catastrophic never came true.
These are things I do see that bug me.
One would be phrases like “action on climate change”. We should be talking about “action on carbon dioxide” — and climate is only one reason (albeit the biggest) that too much of it is dangerous. Nothing we do with respect to any other influence on climate will prevent global warming if CO2 keeps climbing.
Professor Stefan Rahmstorf, head of Earth System Analysis, Potsdam Institute for Climate Impact Research, Germany
One of the phrases that makes me cringe is when I read in the media that a particular extreme weather event "is no evidence for climate change". This is so bad it's not even wrong, but it is quite misleading.
One of the phrases that makes me cringe is when I read in the media that a particular extreme weather event "is no evidence for climate change". This is so bad it's not even wrong, but it is quite misleading.
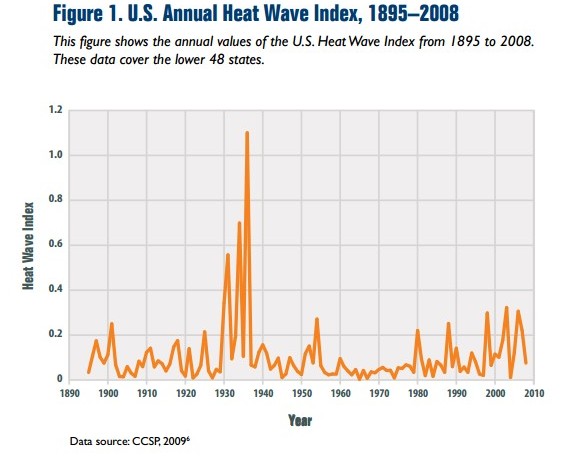
Notes for Stefan Rahmstorf: Even the IPCC SREX says a particular extreme weather event is no evidence for climate change, and there is no evidence that climate has become more variable or extreme.
Climate change is a measured fact seen in rising temperatures, vanishing ice, rising sea levels etc. - it needs no further evidence. [Yes it does, namely the cause of climate change, natural or AGW] And a single extreme event cannot possibly provide such evidence, because climate change increases the number of certain extremes. Some, like heat waves, have already increased massively thanks to global warming.
Climate change is a measured fact seen in rising temperatures, vanishing ice, rising sea levels etc. - it needs no further evidence. [Yes it does, namely the cause of climate change, natural or AGW] And a single extreme event cannot possibly provide such evidence, because climate change increases the number of certain extremes. Some, like heat waves, have already increased massively thanks to global warming.
US Heat waves were much more common in the 1930's:
Professor Roger Jones, research fellow at the Centre for Strategic and Economic Studies at Victoria University, Melbourne
Who am I?
I can be sued for calling a public individual fraudulent but not a whole scientific community or organisation – because climate scientists and the IPCC are fraudulent.
I can publish proven lies in my newspaper day after day with no penalty.
I can buy disaffected scientists to deny sound science with a plane fare to a bogus conference and a little publicity.
I can anonymously threaten researchers online, especially the female ones.
If anyone threatens me with facts, I can call them an antidemocratic, anti-jobs, McCarthyist, communist, anti-freedom, pagan environmentalist.
Everyone says there is no consensus.
I deny everything.
Who am I?
I can be sued for calling a public individual fraudulent but not a whole scientific community or organisation – because climate scientists and the IPCC are fraudulent.
I can publish proven lies in my newspaper day after day with no penalty.
I can buy disaffected scientists to deny sound science with a plane fare to a bogus conference and a little publicity.
I can anonymously threaten researchers online, especially the female ones.
If anyone threatens me with facts, I can call them an antidemocratic, anti-jobs, McCarthyist, communist, anti-freedom, pagan environmentalist.
Everyone says there is no consensus.
I deny everything.
Dr Sophie Lewis, research fellow in the School of Earth Sciences at the University of Melbourne
I get annoyed when I hear yet another politician arguing that we can’t link extreme events to climate change. You know the spurious reasoning? Australia’s always had heatwaves/floods/fires, so this recent extreme is nothing to worry about. When I hear this, it’s time to turn off the TV.
Climate scientists don’t just guess at what contributed to recent extremes. We methodically calculate changes in the risk of extremes due to human factors, like greenhouse gases. I don’t just get irate out of principle.
Dismissing the link between climate change and extremes as hogwash leaves us vulnerable to a warmer climate. [see above comments on extremes]
Dr Andrew Glikson, visiting fellow at the School of Archaeology and Anthropology, Australian National University
I think the scale of the changes being seen now when compared to the Earth's history is something the media and the public do not appreciate. Earth's history is marked by a number of major mass extinctions of species, triggered by volcanic eruptions, asteroid impacts and release of methane from sediments.
Major shifts in the state of the climate were caused either by pulsations in solar radiation or by release of carbon from the Earth. In each of these events a marked rise occurred in the concentration of greenhouse gases in the atmosphere.
As the level of energy and temperature of the atmosphere increased, irreversible tipping points were reached where the synergy of feedback processes – ice melt, warming water, released methane, droughts and fires - combined to shift the climate from one state to the next.
The current rise in energy of the atmosphere above that of pre-industrial times, by about 3 Watt per square meter, is about half that of the atmospheric energy rise during the last transition from glacial to interglacial state.
The current shift is threatening to bring about irreversible tipping points in the climate, with the most serious consequences, likely indicated by the increase over the last 20 years or so in the intensity of extreme weather events around the globe.
The current rise of atmospheric CO2 at a rate of near-three parts per million per year exceeds rates recorded in the history of the atmosphere for the last 55 million years, which retards the ability of species to adapt to environmental change in time.
I think the scale of the changes being seen now when compared to the Earth's history is something the media and the public do not appreciate. Earth's history is marked by a number of major mass extinctions of species, triggered by volcanic eruptions, asteroid impacts and release of methane from sediments.
Major shifts in the state of the climate were caused either by pulsations in solar radiation or by release of carbon from the Earth. In each of these events a marked rise occurred in the concentration of greenhouse gases in the atmosphere.
As the level of energy and temperature of the atmosphere increased, irreversible tipping points were reached where the synergy of feedback processes – ice melt, warming water, released methane, droughts and fires - combined to shift the climate from one state to the next.
The current rise in energy of the atmosphere above that of pre-industrial times, by about 3 Watt per square meter, is about half that of the atmospheric energy rise during the last transition from glacial to interglacial state.
The current shift is threatening to bring about irreversible tipping points in the climate, with the most serious consequences, likely indicated by the increase over the last 20 years or so in the intensity of extreme weather events around the globe.
The current rise of atmospheric CO2 at a rate of near-three parts per million per year exceeds rates recorded in the history of the atmosphere for the last 55 million years, which retards the ability of species to adapt to environmental change in time.
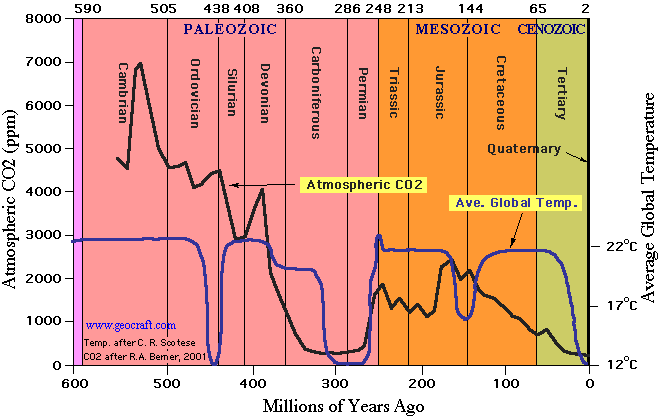 |
| Note the discontinuity of CO2 and temperature over geologic time scales, as well as no "irreversible tipping points" with CO2 levels more than 17 times higher than the present |
A consequent shift from conditions, which have allowed agriculture to take place from about 8,000 years ago, would render large parts of the continents unsuitable for cultivation.
Monday, July 15, 2013
Climate consensus cracking under weight of evidence
Climate consensus cracking under weight of evidence
By Larry Bell, 7/12/13
As the President demonstrated once again during his “climate action plan” address in Georgetown, he is not someone ever to allow facts to stand in the way of ideology and Green lobby cronyism. The familiar take-away line is that even more regulation is essential to bludgeon energy producers and consumers to abandon climate-ravaging fossil fuels in favor of heavily taxpayer-subsidized “alternatives.”
Even his staunch allies in all things liberal, the New York Times, appears to have finally recognized that the feverish climate fervor behind these Green grab gambits is overheated. They reported on June 6 that, “The rise in the surface temperature of Earth has been markedly slower over the last 15 years than in the 20 years before that. And that lull in warming has occurred even as greenhouse gases have accumulated in the atmosphere at a record pace.” Reporter Justin Gillis went on to admit that the break in temperature increases “highlights important gaps in our knowledge of the climate system,” whereby the lack of warming “is a bit of a mystery to climate scientists.”
Incidentally, on the same day that the NYT wondered where the warming went, the Washington Post breathlessly reported that “Global emissions of carbon dioxide from energy use rose 1.4 percent to 31.6 gigatons in 2012, setting a record and putting the planet on course for temperature increases well above international climate goals.”
They went on to quote the International Energy Agency declaring that “continuing that pace could mean a temperature increase over pre-industrial times of as much as 5.3° C (9° F), which IEA chief economist Faith Birol warned ‘would be a disaster for all countries,’ ”
Yup. Climate Really Changes…Has Before…Will Again.
Should lack of actual recent observed warming be taken to mean that climate doesn’t change, or that warming won’t occur again? No…hardly. But it does suggest a couple of important things. First, and foremost, it means that theoretical climate models upon which crisis claims are entirely based can’t be trusted. Second, if those models can’t be validated, then claims of consensus attributing an unproven crisis to human CO2 emissions, or to any other cause for that matter, certainly don’t warrant legitimacy either.
Isaac Held, a research scientist at NOAA’s Geophysical Fluid Dynamics Laboratory, says “no one has ever expected warming to be continuous, increasing like a straight line.” He’s right about that. As Fred Singer stated in my recent article, “the global climate has warmed since the Little Ice Age (about 1400-1700 AD), and it will likely continue to warm for another 200-300 years, in fits and starts, towards a max temp roughly matching that of the Medieval Warm Period.“
Held notes that observations “make it more plausible that the size of climate response to greenhouse gas increase is on the lower side of what models have been projecting over the last 10 or 20 years than over the high side.” Citing scientific uncertainty, particularly with regard to cloud influences, he said “It’s like cancer.” Held referred to “many, many research problems” posed by numerous types of clouds, each with their own special properties that might reflect or trap more or less of the sun’s heat.
Can’t Be the Models… Something Must Be Wrong With the Climate!
Mark Maslin and Patrick Austin stated in their June 2012 article in the journal Nature that, for the next UN Intergovernmental Panel on Climate Change (IPCC) assessment, “climate scientists face a serious public-image problem.” If the ClimateGate scandals weren’t enough, they observe that, “The climate models they are working with, which use significant improvements in our understanding of complex climate processes, are likely to produce wider rather than smaller ranges of uncertainty in their predictions. To the public and to policymakers, this will look as though the scientific understanding of climate change is becoming less, rather than more, clear.”
D’ya suppose they might have something there?
Maslin and Austin emphasize that a major uncertainty relates to subjective ways models are weighted. They note, for example, that “Every model has its own design and parameterizations of key processes, such as how to include clouds: and every model and its output [in IPCC’s last 2007 assessment] was assumed to be equally valid, even though some perform better than others in certain ways when tested against historic records. The differences between the models will be exacerbated in the 2013 IPCC assessment, because many, but not all, of the models have improved spatial resolution.”
Writing in The New Republic, Nate Cohn shares Maslin’s and Austin’s public climate science confidence concern: “Since 1998, the warmest year of the 20th Century, temperatures have not kept up with computer models that seemed to project steady warming: they’re perilously close to falling beneath even the lowest projections.” He observes that “in the end, the so-called scientific consensus on global warming doesn’t look much like consensus when scientists are struggling to explain the intricacies of the earth’s climate system, or uttering the word ‘uncertainty’ with striking regularity.”
Cohn then unhappily concludes, “The recent wave of news and magazine articles about scientists struggling to explain the warming slowdown could prolong or deepen the public’s skepticism.” He’s correct in acknowledging an existing and growing public skepticism.
How Trustworthy are those Models? Here’s a Reality Check.
Well-known climatologists Roy Spencer and John Christy at the University of Alabama in Huntsville compared global mean temperature increases predicted by 73 models from 1979 to present with those actually observed. The observed temperatures were taken from four balloon radiosonde datasets and two satellite datasets which provided virtually identical trends. Less reliable ground readings weren’t used to avoid misleading trend data resulting from land-use changes around recording stations. In addition, the observed temperatures were taken from the tropical troposphere, a region where models project the strongest, least ambiguous greenhouse warming signal.
The results of the modeled versus observed trends revealed a striking contrast. Seventy of the model plots increased sharply over the measurement period, and three increased more modestly. Observed temperatures slogged along a slow incline, overall about two-thirds lower, amounting to a less than 0.25° C increase since the beginning. Many of those disproven models will serve as the basis for IPCC’s next report.
Cohn finally confesses that, “Nonetheless, the combination of imperfect data, overlapping explanations, and continued uncertainty means that scientists cannot discount the possibility that they have overestimated the climate’s ‘sensitivity’ to additional greenhouse gas emissions.”
And what are some of those overlapping explanations and uncertainties? Well, even as Cohn points out, there are unfathomable (sorry…pun intended) ocean influences…although sea surface temperatures and the upper heat content didn’t increase over the last decade by enough to account for the “missing heat” that greenhouse gas emissions should have trapped in the Earth’s climate system but couldn’t find.
So some scientists (including Kevin Trenberth) have speculated that the heat may have taken a dive into the deep ocean, beneath 700 meters (where lamentably, there are no reliable temperature measurements). And how have they arrived at this hypothesis? Well, perhaps you already guessed the answer. Of course! They developed some hypothetical, unproven guess-work models.
Another theory attributes the lack of warming to an increase in stratospheric aerosol levels since 2002. Although there hasn’t been a large volcanic eruption to blame since 1991, some have correlated this with increased coal burning from South and East Asia.
Worse Yet…Some Very Chilling Prospects.
Yes, and there are other scientists who think that the heat is missing because it never made it into the Earth’s climate system in the first place due to the fact that the sun’s energy output ebbs and wanes. In fact, scientists at Russia’s prestigious Pulkovo Observatory in St. Petersburg have stated that solar activity is waning to such an extent that the global average yearly temperature will begin to decline into a very cold and protracted climate phase.
Observatory head Habibullo Abdussamatov, one of the world’s leading solar scientists, member of the Russian Academy of Science, and director of the Russian segment of the International Space Station, points out that over the last 1,000 years deep cold periods have occurred five times. Each is correlated with declines in solar irradiance much like we are experiencing now with no human influence. “A global freeze will come about regardless of whether or not industrialized countries put a cap on their greenhouse gas emissions. The common view of Man’s industrial activity as a deciding factor in global warming has emerged from a misinterpretation of cause and effect.”
Murry Salby, a climate scientist at Macquarie University in Sydney, agrees about the cause and effect reversal: “in the real world, global temperature is not controlled exclusively by CO2, as it is in the model world…in significant part CO2 is controlled by global temperature, as it is in the proxy record.” Salby points out that when models that have been predicting CO2-induced heating differ from direct observations, then they’re wrong, calling practices that claim otherwise a “cult science.”
Climate of Fear for Alarmists…Fewer People are Listening.
There can be little doubt that ongoing climate science consensus bleatings are receiving less and less of a howling response. According to Pew Research, fewer than half of all Americans now believe that scientists agree that warming is mostly due to human activities, down from 59 percent in 2006 to 45 percent today. And according to their annual policy priorities survey released last January, only 28 percent of those polled believed that global warming was a top priority for the President and Congress to address this year (ranking at the bottom of the 21 priorities listed). Four in ten of those who said it should be a top priority were Democrats, compared with only 13 percent of Republicans and about 30 percent of Independents.
Referring to flat temperatures and cooling public trust, The Economist observes that “there’s no getting around the fact that this reprieve for the planet is bad news for proponents of policies, such as carbon taxes and emission treaties, meant to slow warming by moderating the release of greenhouse gases.” The article points out that the moralizing stridency behind such policies was founded upon the idea that there is a scientific consensus about how much warming there would be if carbon emissions continue to rise according to a particular trend and heated debates regarding the economic and social damage that will result. “If that consensus is now falling apart, as it seems to be, that is, for good or ill, a very big deal.”
The Economist concludes: “The reality is that the already meager prospects of these policies, in America at least, will be devastated if temperatures do fall outside the lower bound of the projections that environmentalists have used to create a panicked sense of emergency. Whether or not impossible, to sell to the public, which will feel, not unreasonably, that the scientific and media establishment has cried wolf.”
No, that’s really not unreasonable at all. But there are a couple of larger issues. First, will someone at the New York Times please inform the President about this? Even more important…will he really care to know?
CFACT Advisor Larry Bell heads the graduate program in space architecture at the University of Houston. He founded and directs the Sasakawa International Center for Space Architecture. He is also the author of “Climate of Corruption: Politics and Power Behind the Global Warming Hoax.”
By Larry Bell, 7/12/13
As the President demonstrated once again during his “climate action plan” address in Georgetown, he is not someone ever to allow facts to stand in the way of ideology and Green lobby cronyism. The familiar take-away line is that even more regulation is essential to bludgeon energy producers and consumers to abandon climate-ravaging fossil fuels in favor of heavily taxpayer-subsidized “alternatives.”
Even his staunch allies in all things liberal, the New York Times, appears to have finally recognized that the feverish climate fervor behind these Green grab gambits is overheated. They reported on June 6 that, “The rise in the surface temperature of Earth has been markedly slower over the last 15 years than in the 20 years before that. And that lull in warming has occurred even as greenhouse gases have accumulated in the atmosphere at a record pace.” Reporter Justin Gillis went on to admit that the break in temperature increases “highlights important gaps in our knowledge of the climate system,” whereby the lack of warming “is a bit of a mystery to climate scientists.”
Incidentally, on the same day that the NYT wondered where the warming went, the Washington Post breathlessly reported that “Global emissions of carbon dioxide from energy use rose 1.4 percent to 31.6 gigatons in 2012, setting a record and putting the planet on course for temperature increases well above international climate goals.”
They went on to quote the International Energy Agency declaring that “continuing that pace could mean a temperature increase over pre-industrial times of as much as 5.3° C (9° F), which IEA chief economist Faith Birol warned ‘would be a disaster for all countries,’ ”
Yup. Climate Really Changes…Has Before…Will Again.
Should lack of actual recent observed warming be taken to mean that climate doesn’t change, or that warming won’t occur again? No…hardly. But it does suggest a couple of important things. First, and foremost, it means that theoretical climate models upon which crisis claims are entirely based can’t be trusted. Second, if those models can’t be validated, then claims of consensus attributing an unproven crisis to human CO2 emissions, or to any other cause for that matter, certainly don’t warrant legitimacy either.
Isaac Held, a research scientist at NOAA’s Geophysical Fluid Dynamics Laboratory, says “no one has ever expected warming to be continuous, increasing like a straight line.” He’s right about that. As Fred Singer stated in my recent article, “the global climate has warmed since the Little Ice Age (about 1400-1700 AD), and it will likely continue to warm for another 200-300 years, in fits and starts, towards a max temp roughly matching that of the Medieval Warm Period.“
Held notes that observations “make it more plausible that the size of climate response to greenhouse gas increase is on the lower side of what models have been projecting over the last 10 or 20 years than over the high side.” Citing scientific uncertainty, particularly with regard to cloud influences, he said “It’s like cancer.” Held referred to “many, many research problems” posed by numerous types of clouds, each with their own special properties that might reflect or trap more or less of the sun’s heat.
Can’t Be the Models… Something Must Be Wrong With the Climate!
Mark Maslin and Patrick Austin stated in their June 2012 article in the journal Nature that, for the next UN Intergovernmental Panel on Climate Change (IPCC) assessment, “climate scientists face a serious public-image problem.” If the ClimateGate scandals weren’t enough, they observe that, “The climate models they are working with, which use significant improvements in our understanding of complex climate processes, are likely to produce wider rather than smaller ranges of uncertainty in their predictions. To the public and to policymakers, this will look as though the scientific understanding of climate change is becoming less, rather than more, clear.”
D’ya suppose they might have something there?
Maslin and Austin emphasize that a major uncertainty relates to subjective ways models are weighted. They note, for example, that “Every model has its own design and parameterizations of key processes, such as how to include clouds: and every model and its output [in IPCC’s last 2007 assessment] was assumed to be equally valid, even though some perform better than others in certain ways when tested against historic records. The differences between the models will be exacerbated in the 2013 IPCC assessment, because many, but not all, of the models have improved spatial resolution.”
Writing in The New Republic, Nate Cohn shares Maslin’s and Austin’s public climate science confidence concern: “Since 1998, the warmest year of the 20th Century, temperatures have not kept up with computer models that seemed to project steady warming: they’re perilously close to falling beneath even the lowest projections.” He observes that “in the end, the so-called scientific consensus on global warming doesn’t look much like consensus when scientists are struggling to explain the intricacies of the earth’s climate system, or uttering the word ‘uncertainty’ with striking regularity.”
Cohn then unhappily concludes, “The recent wave of news and magazine articles about scientists struggling to explain the warming slowdown could prolong or deepen the public’s skepticism.” He’s correct in acknowledging an existing and growing public skepticism.
How Trustworthy are those Models? Here’s a Reality Check.
Well-known climatologists Roy Spencer and John Christy at the University of Alabama in Huntsville compared global mean temperature increases predicted by 73 models from 1979 to present with those actually observed. The observed temperatures were taken from four balloon radiosonde datasets and two satellite datasets which provided virtually identical trends. Less reliable ground readings weren’t used to avoid misleading trend data resulting from land-use changes around recording stations. In addition, the observed temperatures were taken from the tropical troposphere, a region where models project the strongest, least ambiguous greenhouse warming signal.
The results of the modeled versus observed trends revealed a striking contrast. Seventy of the model plots increased sharply over the measurement period, and three increased more modestly. Observed temperatures slogged along a slow incline, overall about two-thirds lower, amounting to a less than 0.25° C increase since the beginning. Many of those disproven models will serve as the basis for IPCC’s next report.
Cohn finally confesses that, “Nonetheless, the combination of imperfect data, overlapping explanations, and continued uncertainty means that scientists cannot discount the possibility that they have overestimated the climate’s ‘sensitivity’ to additional greenhouse gas emissions.”
And what are some of those overlapping explanations and uncertainties? Well, even as Cohn points out, there are unfathomable (sorry…pun intended) ocean influences…although sea surface temperatures and the upper heat content didn’t increase over the last decade by enough to account for the “missing heat” that greenhouse gas emissions should have trapped in the Earth’s climate system but couldn’t find.
So some scientists (including Kevin Trenberth) have speculated that the heat may have taken a dive into the deep ocean, beneath 700 meters (where lamentably, there are no reliable temperature measurements). And how have they arrived at this hypothesis? Well, perhaps you already guessed the answer. Of course! They developed some hypothetical, unproven guess-work models.
Another theory attributes the lack of warming to an increase in stratospheric aerosol levels since 2002. Although there hasn’t been a large volcanic eruption to blame since 1991, some have correlated this with increased coal burning from South and East Asia.
Worse Yet…Some Very Chilling Prospects.
Yes, and there are other scientists who think that the heat is missing because it never made it into the Earth’s climate system in the first place due to the fact that the sun’s energy output ebbs and wanes. In fact, scientists at Russia’s prestigious Pulkovo Observatory in St. Petersburg have stated that solar activity is waning to such an extent that the global average yearly temperature will begin to decline into a very cold and protracted climate phase.
Observatory head Habibullo Abdussamatov, one of the world’s leading solar scientists, member of the Russian Academy of Science, and director of the Russian segment of the International Space Station, points out that over the last 1,000 years deep cold periods have occurred five times. Each is correlated with declines in solar irradiance much like we are experiencing now with no human influence. “A global freeze will come about regardless of whether or not industrialized countries put a cap on their greenhouse gas emissions. The common view of Man’s industrial activity as a deciding factor in global warming has emerged from a misinterpretation of cause and effect.”
Murry Salby, a climate scientist at Macquarie University in Sydney, agrees about the cause and effect reversal: “in the real world, global temperature is not controlled exclusively by CO2, as it is in the model world…in significant part CO2 is controlled by global temperature, as it is in the proxy record.” Salby points out that when models that have been predicting CO2-induced heating differ from direct observations, then they’re wrong, calling practices that claim otherwise a “cult science.”
Climate of Fear for Alarmists…Fewer People are Listening.
There can be little doubt that ongoing climate science consensus bleatings are receiving less and less of a howling response. According to Pew Research, fewer than half of all Americans now believe that scientists agree that warming is mostly due to human activities, down from 59 percent in 2006 to 45 percent today. And according to their annual policy priorities survey released last January, only 28 percent of those polled believed that global warming was a top priority for the President and Congress to address this year (ranking at the bottom of the 21 priorities listed). Four in ten of those who said it should be a top priority were Democrats, compared with only 13 percent of Republicans and about 30 percent of Independents.
Referring to flat temperatures and cooling public trust, The Economist observes that “there’s no getting around the fact that this reprieve for the planet is bad news for proponents of policies, such as carbon taxes and emission treaties, meant to slow warming by moderating the release of greenhouse gases.” The article points out that the moralizing stridency behind such policies was founded upon the idea that there is a scientific consensus about how much warming there would be if carbon emissions continue to rise according to a particular trend and heated debates regarding the economic and social damage that will result. “If that consensus is now falling apart, as it seems to be, that is, for good or ill, a very big deal.”
The Economist concludes: “The reality is that the already meager prospects of these policies, in America at least, will be devastated if temperatures do fall outside the lower bound of the projections that environmentalists have used to create a panicked sense of emergency. Whether or not impossible, to sell to the public, which will feel, not unreasonably, that the scientific and media establishment has cried wolf.”
No, that’s really not unreasonable at all. But there are a couple of larger issues. First, will someone at the New York Times please inform the President about this? Even more important…will he really care to know?
CFACT Advisor Larry Bell heads the graduate program in space architecture at the University of Houston. He founded and directs the Sasakawa International Center for Space Architecture. He is also the author of “Climate of Corruption: Politics and Power Behind the Global Warming Hoax.”
Monday, November 19, 2012
Speak loudly and carry a busted hockey stick
Vaclav Klaus
Blue Planet in Green Shackles
Blue Planet in Green Shackles
Speak loudly and carry a busted hockey stick
November 19, 2012
The average temperature for the Earth, or any region or even any specific place is very difficult to determine with any accuracy. At any given time surface air temperatures around the world range over about 100°C. Even in the same place they can vary by nearly that much seasonally and as much as 30°C or more in a day. Weather stations are relatively few and located very irregularly. Well maintained stations with good records going back a century or more can be counted on one’s fingers. Even then only maximum and minimum temperatures or ones at a few particular times of day are usually available. Maintenance, siting, and surrounding land use also all have influences on the temperatures recorded.
The purported 0.7°C of average global warming over the past century is highly uncertain. It is in fact less than the margin of error in our ability to determine the average temperature anywhere, much less globally. What portion of any such warming might be due to due to anthropogenic CO2 emissions is even less certain. There are, however, numerous phenomena which are affected by temperature and which can provide good evidence of relative warming or cooling and, in some cases, even actual temperatures. These include growth rings in trees, corals and stalactites, borehole temperature profiles and the isotopic and biologic signatures in core samples from sediments or glaciers. In addition, historical accounts of crops grown, harvest times, freezes, sea ice, river levels, glacial advances or retreats and other such records provide clear indication of warming and cooling.
Recent Warming Nothing Unusual
The temperature record everywhere shows evidence of warming and cooling in accord with cycles on many different time scales from daily to annual, decadal, centennial, millennial and even longer. Many of these seem to correlate with various cycles of solar activity and the Earth’s own orbital mechanics. The temperature record is also marked by seemingly random events which appear to follow no discernable pattern.
Over the past 3000 years there is evidence from hundreds of independent proxy studies, as well as historical records, for a Minoan Warm period around 1000 BC, a Roman Warm Period about 2000 years ago, a Medieval Warm Period (WMP) about 1000 years ago and a Modern Warm Period now developing. In between were markedly colder periods in the Dark Ages and another between the 16th and 19th centuries which is now known as the Little Ice Age (LIA). The warmer periods were times of bountiful crops, increasing population and a general flourishing of human societies. The cold periods were times of droughts, famines, epidemics, wars and population declines. Clearly life has been much better in the times of warmer climate, and there is nothing to indicate that the apparent mild warming of the past century is anything other than a return of this millennial scale warming cycle.
Good News Unwelcome to Alarmists
This rather good news about a possibly warmer climate has not met with hopeful interest from those who purport to be so concerned about the possibly dangerous effects of anthropogenic global warming (AGW). On the contrary, their reaction has overwhelmingly been a strong rejection of any beneficial possibility. It is apparent that their deepest commitment is to the threat itself and not to any rational assessment of real world probabilities or the broader consequences of any of their proposed remedies.
Fabricating a Hockey Stick from Hot Air
This blanket rejection of any possibility other than the hypothetical threat of AGW has led to some strange behaviour for people who modestly proclaim themselves to be the world’s top climate scientists. Not only have they ignored and dismissed the hundreds of studies indicating the global existence of a Medieval Warm Period and the Little Ice Age, they have set out to fabricate an alternate reality in the form of a graph purporting to represent the global temperature for the past thousand years. It portrays a near straight line wiggling up and down only a fraction of a degree for centuries until it begins an exponential rise gradually starting at the beginning of the 20th century and then shooting steeply up in the latter part of that century. This hockey stick-shaped graph was then heavily promoted as the icon of AGW. It appeared on the cover of the third climate assessment report of the IPCC published in 2003 and was reproduced at various places in the report itself.
Among the emails between leading climate researchers released in the Climategate affair were a number which revealed a concerted effort to come up with some means to deny the existence of the MWP. The implement chosen to do this became known as the Hockey Stick Graph.
The methodology used to construct the graph involved the use of estimates of temperatures from a very small sample of tree growth rings from the Yamal Peninsula in far northern Siberia and ancient stunted pine trees from near the tree line in the High Sierras of California. This data was then subjected to a statistical treatment later shown by critics to produce a hockey stick form of graph even when random numbers were used as raw input data. To make matters even worse, the same tree ring data also indicated a significant decline in temperature for the 20th century, but this was hidden by burying it in a much larger number of data points from instrument measurements. The resulting study was published in the prestigious scientific journal, Nature in 1998. Remarkably, this very small, highly selected and deceptively manipulated graph was proclaimed to be an accurate representation of global temperatures and the extensive body of contrary evidence was simply ignored.
Continuing the Game With a Busted Stick
When serious shortcomings of the hockey stick study began to be exposed and questioned the climate alarmists closed ranks and proclaimed their preeminent authority and expertise but refused to engage in any genuine scientific debate with their critics. Instead, they appealed to a supposed consensus of experts, peer review, and personal denigration of any who dared to disagree.
All of the name calling, pissing contests over credentials and abstruse statistical manipulations made it difficult for the general public to come to any conclusion. Regardless of various provable errors and conflicting evidence, the alarmists could and did simply ignore it all and claim the HS graph as gospel truth.
Then came Climategate. Obvious scams, lies and connivance are something that doesn’t require a computer model or a PhD to recognise. In the Climategate emails discussion of things like things like “…Mike’s Nature trick…,”, manipulations to “…hide the decline”, requests to destroy correspondence, efforts to supress publication of conflicting studies, vilification of critics, and abuse of peer review were matters anyone could see were not ethical. Certainly they were not the kind of behaviour we should expect from high level scientists whose advice we are being asked to accept in policies that could be expected to have major effects on the prosperity of our entire society.
The loss of public trust and credibility resulting from Climategate was immense and has been compounded by additional ongoing exposures of misconduct, repeated failures of alarmist predictions and the slow motion economic train wreck of green energy initiatives.
Although one might rationally expect that the obvious collapse of alarmist momentum would have them reassessing their approach and perhaps even the validity of their earlier assumptions, it seems that the idea that they may have been wrong in any respect must be be inconceivable to them. Instead, their response to conflicting reality and declining credibility has been only to declare still greater certainty and ratchet up the alarm to an even less believable level of hype.
If at First You Don’t Succeed, Repeat the Failure
Introduction of the carbon tax in Australia was supposed to lead the world along the path of righteousness toward cheap renewable energy and environmental correctness. Unfortunately for the current government both economic reality and climate itself have not co-operated. The intended good example is becoming one of an obvious foolishness to be avoided and nobody is following. Ongoing exposure of scientific misconduct by alarmist researchers and repeated failure of their predictions haven’t helped either. The alarmist community is in disarray and becoming increasingly shrill in the tone of their pronouncements. The need for strong new scientific evidence to reinforce the shredded remnants of their discredited claims is becoming desperate.
CSIRO has tried to help with a series of increasingly dire predictions but having become a heavily bureaucratised and politicised institution they have been careful to cover their backsides with qualifiers and disclaimers which dull the sharp edge of hype, certainty and urgency needed by government. However, through generous grants government has also bought and paid for reliable cadres of university based academics whose funding and even whole careers are now based on research into Catastrophic Anthropogenic Global Warming (CAGW). Although science may aspire to value free objectivity, it is observable fact that when generous funding is provided to study a purported problem, one thing is certain. It will never be found that there really wasn’t one.
In early June this year a new research report announced the finding of a distinct hockey stick shaped graph for Australian climate over the past millennium. If correct, this would be of great value in supporting the faltering case for CAGW. As the original HS graph was based entirely on data from the northern hemisphere, finding the same pattern from the Southern Hemisphere would bolster the claim that the recent warming is indeed global and unprecedented. Based on different much more extensive data and free of the inappropriate statistical treatment of the original HS study, this new one would also greatly bolster the tattered credibility of the original study.
The new study appeared in Journal of Climate under the title, "Evidence of unusual late 20th century warming from an Australasian temperature reconstruction spanning the last millennium". It was authored by Joelle Gergis, Raphael Neukom, Ailie Gallant, Steven Phipps and David Karoly. In mid-May 2012 it was made available online in preprint form, having been peer reviewed and accepted for print publication in an upcoming issue of the journal. In a number of key aspects what followed has been a rerun of the original HS story. Shortly after the online preprint appeared, the Canadian statistician Steve McIntyre pointed out that a statistical procedure which was stated in the Gergis et al. study to have been applied had not in fact been used.
Not coincidentally, it was McIntyre who exposed the statistical shortcomings in the original HS study.
Although advanced statistical analysis is widely used in science, very few researchers have a thorough mathematical understanding of what they are doing in this regard. Most are simply following a recipe. However, there is little risk of having to justify the validity of anything as their peers are not statisticians either. McIntyre has an unfair advantage in this. He is a genuine expert in statistics critiquing the work of researchers who are really not very skilled in his discipline.
What ensued in subsequent critical discussion on the Internet and in emails between the authors, their colleagues and the journal editors was a litany of shifting denial, obfuscation, excuses, trivialisation and denigration that could have been borrowed from the original HS script. Without going into the tedious and tawdry details (readily available on the net), the key points of the story are that in response to McIntyre’s finding of the statistical problem the authors announced they had already discovered it themselves the day before McIntyre pointed it out, and that it was really just an oversight in the data processing routine which could quickly be corrected and would have no effect on the overall findings of the study. The journal editors accepted this and gave the authors a deadline with sufficient time to rerun the data routine and make any necessary corrections to the MS.
After much speculation in the blogosphere and varying opinion among the authors and their supporters about what to do and how it might affect the outcome, the deadline passed without a corrected MS being received by the journal. The editors then asked for the study to be withdrawn. Such a request is the scientific equivalent of hara-kiri, a dishonour so great that the only honourable atonement is what amounts to ritual scientific suicide.
If, as publically maintained, all that was involved was a data processing error which could easily be corrected and would have no important effect on the outcome, surely the correction would have been made. However, email correspondence between the authors (which became available through an FOI request) revealed a concern that if properly applied the omitted data processing routine would not result in the desired HS graph or, if it did so, would at best yield only highly uncertain results.
The direct cost of this fiasco to taxpayers is reported to have totalled some $950,000 in research grants from 2009 to 2012. To further this failed work the latest Australian Research Council grants announcement also lists another $350,000 in funding to the lead author approved for 2013 – 2015. The climate gravy train can provide a sumptuous ride for those whose work shows promise of producing what the government wants.
Climatology - Science or Ideology?
Climatology is no longer recognisable as a science but has morphed into a fundamentalist ideology of a millenarian nature. Science only serves it to enhance claims of authority and certainty. Scientific ethics and evidence are employed selectively in accord with the noble cause of saving the planet from the corruptions of humanity and capitalism. Any conflicting reason or evidence is never sufficient for doubt but is only a test of faith to be overcome. Any opposing argument is not simply incorrect but driven by wilful evil, in league with big business if not Satan himself.
For third rate academics CAGW has much to offer. One doesn’t need to be particularly capable to speculate about some dire consequence of warming, receive widespread publicity and be treated as an important expert. Unlike in real science, no colleagues will dispute them and the few sceptics willing to question anything will generally be ignored and denigrated by all their peers. The news media will describe them as experts and provide the public attention they know they deserve but somehow had never been recognised by anyone else until they climbed onto the climate bandwagon. Grants then flow and jetting off to attend important conferences in attractive places with all expenses paid provides frequent welcome breaks from the tedium of academia. Perhaps best of all, is a delicious feeling of importance and moral superiority over all of the high achievers striving so hard to discover something of consequence about the real world. The only personal cost is to one’s own scientific integrity and that’s not worth much if one is just another unrecognised minor league academic no one had ever heard of before they joined into the climate alarm. In any case, saving the planet is the noblest of all causes and absolves any tinge of guilt in such regard.
Uncertainty and a Duty of Care
Recently an Italian court sentenced several scientists to jail terms in connection with a failed prediction regarding an earthquake. The court decision provoked widespread condemnation from the global scientific community because earthquakes are beyond the ability of current science to predict. However, the legal basis of their culpability was not in failing to predict the quake but in falsely asserting certainty in their own prediction. In this instance the scientists assured the local population that there was little risk of a dangerous event and that they should all go home, have a nice bottle of wine and not worry. A strong quake took place and several hundred people were killed.
The situation was perhaps exacerbated by a conflicting opinion from an independent researcher who had detected a sharp rise in radon gas in the air and felt this was evidence of an impending temblor. The government experts disagreed and assured everyone they were the experts and they were confident there was little or no risk.
If scientists are going to claim high levels of expert authority they have a duty of care to make clear the level of uncertainty in their predictions. This is especially so where there are potentially major detrimental consequences from following their advice should it prove to be incorrect. The essential difference between belief and science, or between alarmists and sceptics, is that the former assert certainty while the latter admit room for doubt. False claims of certainty and expertise by alarmist researchers have been a major obstacle to any rational public debate of the matter.
Fantasies vs. Reality
In the meantime, while we have been indulging the fantasies of activists and academics vying for our attention on the threat of CAGW, the economies of the developed world have come to teeter on the brink of financial chaos.
Democracies everywhere have voted for more government and more benefits than their productive sectors can support. Deficits are now chronic and blowing out while productive activity struggles under the burden of ever more government imposed restrictions and demands. The climate-alarmist push to penalise and restrict the use of fossil fuels and force the premature adoption of expensive, inadequate, unreliable renewable energy is a dagger to the very heart of our society at a time of great vulnerability. Ironically, if the alarmist aim is achieved they themselves, the urban non-producers, will be among the first to become truly unsustainable. The next few years look to become a decisive reality test.
In news just in (and curiously ignored in the mainstream Western media) it is reported that for the first time since it began The Intergovernmental Panel on Climate Change (IPCC) was not invited to attend an upcoming United Nations Climate Change Conference. Could it be that in a global financial crisis nations have finally come to realise that climate hysterics are more of a problem than a solution?
Subscribe to:
Posts (Atom)