Showing posts sorted by relevance for query total column water vapor. Sort by date Show all posts

Wednesday, March 6, 2013

Man-made global warming theory is falsified by satellite water vapor observations

Reblogged from Clive Best and Ken Gregory at Friends of Science.org:


Water Vapor Decline Cools the Earth: NASA Satellite Data

by Ken Gregory P.Eng., Friends of Science.org

An analysis of NASA satellite data shows that water vapor, the most important greenhouse gas, has declined in the upper atmosphere causing a cooling effect that is 16 times greater than the warming effect from man-made greenhouse gas emissions during the period 1990 to 2001.
The world has spent over $ 1 trillion on climate change mitigation based on climate models that don’t work. They are notoriously poor at simulating the 20th century warming because they do not include natural causes of climate change – mainly due to the changing sun -  and they grossly exaggerate the feedback effects of greenhouse gas emissions.
Most scientists agree that doubling the amount of carbon dioxide (CO2) in the atmosphere, which takes about 150 years, would theoretical warm the earth by one degree Celsius if there were no change in evaporation, the amount or distribution of water vapor and clouds. Climate models amplify the initial CO2 effect by a factor of three by assuming positive feedbacks from water vapor and clouds, for which there is little direct evidence. Most of the amplification by the climate models is due to an increase in upper atmosphere water vapor.
The Satellite Data
The NASA water vapor project (NVAP) uses multiple satellite sensors to create a standard climate dataset to measure long-term variability of global water vapor. NASA recently released the Heritage NVAP data which gives water vapor measurement from 1988 to 2001 on a 1 degree by 1 degree grid, in three vertical layers.1 The NVAP-M project, which is not yet available, extends the analysis to 2009 and gives five vertical layers. Water vapor content of an atmospheric layer is represented by the height in millimeters (mm) that would result from precipitating all the water vapor in a vertical column to liquid water. The near-surface layer is from the surface to where the atmospheric pressure is 700 millibar (mb), or about 3 km altitude. The middle layer is from 700 mb to 500 mb air pressure, or from 3 km to 6 km attitude. The upper layer is from 500 mb to 300 mb air pressure, or from 6 km to 10 km altitude.
The global annual average precipitable water vapor by atmospheric layer and by hemisphere from 1988 to 2001 is shown in Figure 1.
The graph is presented on a logarithmic scale so the vertical change of the curves approximately represents the forcing effect of the change. For a steady earth temperature, the amount of incoming solar energy absorbed by the climate system must be balanced by an equal amount of outgoing longwave radiation (OLR) at the top of the atmosphere. An increase of water vapor in the upper atmosphere would temporarily reduce the OLR, creating a forcing of more incoming than outgoing energy, which raises the temperature of the atmosphere until the balance is restored.
NVAP_pwv
Figure 1.  Precipitable water vapor by layer, global and by hemisphere.
The graph shows a significant percentage decline in upper and middle layer water vapor from 1995 to 2001. The near-surface layer shows a smaller percentage increase, but a larger absolute increase in water vapor than the other layers. The upper and middle layer water vapor decreases are greater in the Southern Hemisphere than in the Northern Hemisphere.
Table 1 below shows the precipitable water vapor for the three layers of the Heritage NVAP and the CO2 content for the years 1990 and 2001, and the change.
LayerL1 near-surfaceL2 middleL3 upperSumCO2
1013-700700-500500-300
mmmmmmmmppmv
199018.994.61.4925.08354.16
200120.724.030.9425.69371.07
change1.73-0.57-0.550.6116.91
Table 1.  Heritage NVAP 1990 and 2001 water vapour and CO2.
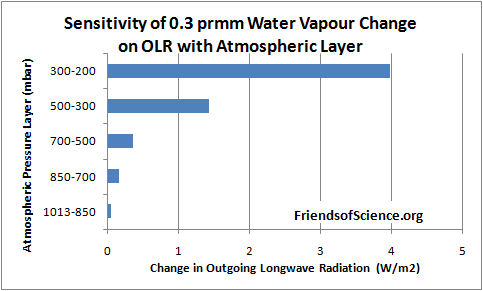
Dr. Ferenc Miskolczi performed computations using the HARTCODE line-by-line radiative code to determine the sensitivity of OLR to a 0.3 mm change in precipitable water vapor in each of 5 layers of the NVAP-M project. The program uses thousands of measured absorption lines and is capable of doing accurate radiative flux calculations.  Figure 2 shows the effect on OLR of a change of 0.3 mm in each layer.
The results show that a water vapor change in the 500-300 mb layer has 29 times the effect on OLR than the same change in the 1013-850 mb near-surface layer. A water vapor change in the 300-200 mb layer has 81 times the effect on OLR than the same change in the 1013-850 mb near-surface layer.
OLR_PWV_bar
Figure 2. Sensitivity of 0.3 mm precipitable water vapor change on outgoing longwave radiation by atmospheric layer.
Table 2 below shows the change in OLR per change in water vapor in each layer, and the change in OLR from 1990 to 2001 due to the change in precipitable water vapor (PWV).
L1L2L3SumCO2
OLR/PWVW/m2/mm-0.329-1.192-4.75
OLR/CO2W/m2/ppmv-0.0101
OLR changeW/m2-0.5690.6792.6132.723-0.171
Table 2.  Change of OLR by layer from water vapor and from CO2 from 1990 to 2001.
The calculations show that the cooling effect of the water vapor changes on OLR is 16 times greater than the warming effect of CO2 during this 11-year period. The cooling effect of the two upper layers is 5.8 times greater than the warming effect of the lowest layer.
These results highlight the fact that changes in the total water vapor column, from surface to the top of the atmosphere, is of little relevance to climate change because the sensitivity of OLR to water vapor changes in the upper atmosphere overwhelms changes in the lower atmosphere.
The precipitable water vapour by layer versus latitude by one degree bands for the year 1991 is shown in Figure 3. The North Pole is at the right side of the figure. The water vapor amount in the Arctic in the 500 to 300 mb layer goes to a minimum of 0.53 mm at 58.5 degrees North, then increases to 0.94 mm near the North Pole.
Nvap_lpw_1991
Figure 3. Precipitable water vapor by layer in 1991.
The NVAP-M project extends the analysis to 2009 and reprocesses the Heritage NVAP data. This layered data is not publicly available. The total precipitable water (TPW) data is shown in Figure 4, reproduced from the paper Vonder Haar et al (2012) here. There is no evidence of increasing water vapor to enhance the small warming effect from CO2.
fig4c_tpw
Figure 4. Global month total precipitable water vapor NVAP-M.
The Radiosonde Data
Water vapor humidity data is measured by radiosonde (on weather balloons) and by satellites.  The radiosonde humidity data is from the NOAA Earth System Research Laboratory here.
GlobalRelativeHumidity300_700mb
Figure 5. Global relative humidity, middle and upper atmosphere, from radiosonde data, NOAA Earth System Research Laboratory.
A graph of the global average annual relative humidity (RH) from 300 mb to 700 mb is shown in Figure 5. The specific humidity in g/kg of moist air at 400 mb (8 km) is shown in Figure 6. It shows that specific humidity has declined by 14% since 1948 using the best fit line.
SH400mb
Figure 6.  Specific humidity at 400 mb pressure level
In contrast, climate models all show RH staying constant, implying that specific humidity is forecast to increase with warming. So climate models show positive feedback and rising specific humidity with warming in the upper troposphere, but the data shows falling specific humidity and negative feedback.
Many climate scientists dismiss the radiosonde data because of changing instrumentation and the declining humidity conflicts with the climate model simulations. However, the radiosonde instruments were calibrated and the data corrected for changes in response times. The data before 1960 should be regarded as unreliable due to poor global coverage and inferior instruments. The near surface radiosonde measurements from 1960 to date show no change in relative humidity which is consistent with theory. Both the satellite and radiosonde data shows declining upper atmosphere humidity, so there is no reason to dismiss the radiosonde data. The radiosonde data only measures humidity over land stations, so it is interesting to compare to the satellite measurements which have global coverage.
Comparison Between Radiosonde and Satellite Data
The specific humidity radiosonde data was converted to precipitable water vapor for comparison with the satellite data. Figure 7 compares the satellite data to the radiosonde data for the years 1988 to 2001.
PW_NOAA&NVAP
Figure 7. Comparison between NOAA radiosonde and NVAP satellite derived precipitable water vapor.
The NOAA and NVAP data compares very well for the period 1988 to 1995. The NVAP satellite data shows less water vapor in the upper and middle layers than the NOAA data. In 2000 and 2001 the NVAP data shows more water vapor in the near-surface layer than the NOAA data. The vertical change on the logarithmic graph is roughly equal to the forcing effect of each layer, so the NVAP data shows water vapor has a greater cooling effect than the radiosonde data.
The Tropical Hot Spot
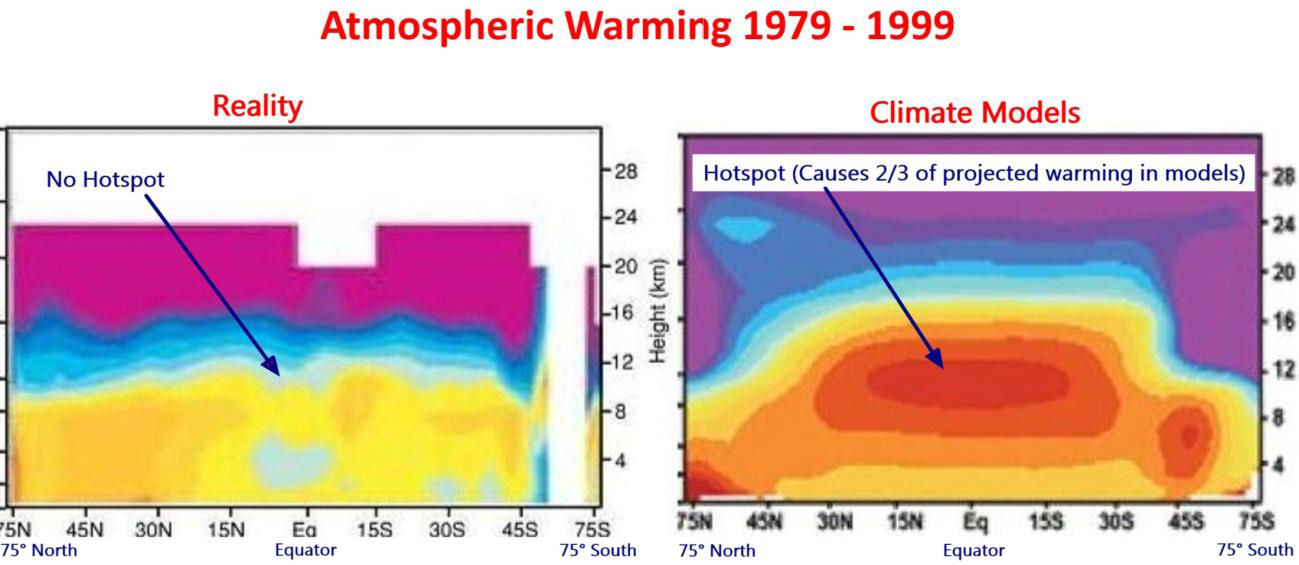
The models predict a distinctive pattern of warming – a “hot-spot” of enhanced warming in the upper atmosphere at 8 km to 13 km over the tropics, shown as the large red spot in Figure 8. The temperature at this “hot-spot” is projected to increase at a rate of two to three times faster than at the surface. However, the Hadley Centre’s real-world plot of radiosonde temperature observations from weather balloons shown below does not show the projected hot-spot at all. The predicted hot-spot is entirely absent from the observational record. If it was there it would have been easily detected.
The hot-spot is forecast in climate models due to the theory that the water vapor profile in the tropics is dominated by the moist adiabatic lapse rate, which requires that water vapor increases in the upper atmosphere with warming. The moist adiabatic lapse rate describes how the temperature of a parcel of water-saturated air changes as it move up in the atmosphere by convection such as within a thunder cloud. A graph here shows two lapse rate profiles with a larger temperature difference in the upper atmosphere than at the surface. The projected water vapor increase creates the hot-spot and is responsible for half to two-thirds of the surface warming in the IPCC climate models.
Hot_spot
Figure 8. Climate models predict a hot spot of enhanced warming rate in the tropics, 8 km to 13 km altitude. Radiosonde data shows the hot spot does not exist. Red indicates the fastest warming rate. Source: http://joannenova.com.au
The projected upper atmosphere water vapor trends and temperature amplification at the hot-spot are intricately linked in the IPCC climate theory. The declining upper atmosphere humidity is consistent with the lack of a tropical hot spot, and both observations prove that the IPCC climate theory is wrong.
A recent technical paper Po-Chedley and Fu (2012) here compares the temperature trends of the lower and upper troposphere in the tropics from satellite data to the climate model projections from the period 1981 to 2008.2 The upper troposphere is the part of the atmosphere where the pressure ranges from 500 mb to 100 mb, or from about 6 km to 15 km. The paper reports that the warming trend during 1981 to 2008 in the upper troposphere simulated by climate models is 1.19 times the simulated warming trend of the lower atmosphere in the tropics.  (Note this comparison is to the lower atmosphere, not the surface, and includes 10 years of no warming to 2008.) Using the most current version (5.5) of the satellite temperature data from the University of Alabama in Huntsville (UAH), the warming trend of the upper troposphere is only 0.973 of the lower troposphere in the tropics for the same period. This is different from that reported in the paper because the authors used an obsolete version (5.4) of the data. The satellite data shows not only a lack of a hot-spot, it shows a cold-spot just where a hot-spot was predicted.
Conclusion
Climate models predict upper atmosphere moistening which triples the greenhouse effect from man-made carbon dioxide emissions. The new satellite data from the NASA water vapor project shows declining upper atmosphere water vapor during the period 1998 to 2001. It is the best available data for water vapor because it has global coverage. Calculations by a line-by-line radiative code show that upper atmosphere water vapor changes at 500 mb to 300 mb have 29 times greater effect on OLR and temperatures than the same change near the surface. The cooling effect of the water vapor changes on OLR is 16 times greater than the warming effect of CO2 during the 1990 to 2001 period. Radiosonde data shows that upper atmosphere water vapor declines with warming. The IPCC dismisses the radiosonde data as the decline is inconsistent with theory. During the 1990 to 2001 period, upper atmosphere water vapor from satellite data declines more than that from radiosonde data, so there is no reason to dismiss the radiosonde data. Changes in water vapor are linked to temperature trends in the upper atmosphere. Both satellite data and radiosonde data confirm the absence of any tropical upper atmosphere temperature amplification, contrary to IPCC theory. Four independent data sets demonstrate that the IPCC theory is wrong. CO2 does not cause significant global warming.
Note 1. The NVAP data in Excel format is here.
Note 2.  The lower troposphere data is: http://www.nsstc.uah.edu/public/msu/t2lt/uahncdc.lt
The upper troposphere data is calculated as 1.1 x middle troposphere – 0.1 x lower stratosphere; where middle troposphere is: http://www.nsstc.uah.edu/public/msu/t2/uahncdc.mt and the lower stratosphere is:http://www.nsstc.uah.edu/public/msu/t4/uahncdc.ls

Wednesday, May 1, 2013

New paper finds 'no consensus on the sign' of cloud effects on climate

A paper published today in the Journal of Climate finds "climate models have no consensus on the sign of the longwave cloud feedback." Translation: we don't know if it is positive or negative, whether radiative 'greenhouse' effects from clouds are positive or negative. Longwave infrared feedback from water vapor/clouds is essential to determine whether the miniscule radiative effect from CO2 is amplified ['positive feedback' as claimed by the IPCC] or dampened ['negative feedback' as shown by many skeptics] due to changes in water vapor. 

Further, the paper states "stratospheric water vapor and temperature changes may both act as a positive feedback mechanism during global warming," but satellite observations show stratospheric water vapor as well as total column water vapor are declining in defiance of the IPCC computer models.

Observations of stratospheric water vapor from Soloman 2010: Black line is from radiosonde observations collected in only one location {Boulder CO}. Global satellite data is shown by the diamonds starting in 1993 and indicate a declining trend since ~1993.
Journal of Climate 2013 ; e-View

On the longwave climate feedbacks

Yi Huang*
Department of Atmospheric and Oceanic Sciences, McGill University
Abstract
This paper mainly addresses two issues that concern the longwave climate feedbacks. First, it is recognized that the radiative forcing of greenhouse gases, as measured by their impact on the outgoing longwave radiation (OLR), may vary across different climate models even when the concentrations of these gases are identically prescribed. This forcing variation contributes to the discrepancy in these models’ projections of surface warming. A method is proposed to account for this effect in diagnosing the sensitivity and feedbacks in the models. Second, it is shown that the stratosphere is an important factor that affects the OLR in transient climate change. Stratospheric water vapor and temperature changes may both act as a positive feedback mechanism during global warming and can not be fully accounted as a “stratospheric adjustment” of radiative forcing. Neglecting these two issues may cause a bias in the longwave cloud feedback diagnosed as a residual term in the decomposition of OLR variations. The climate models have no consensus on the sign of the longwave cloud feedback after accounting for both issues.

Prior posts on the multiple failures of computer modelling of clouds

Tuesday, February 7, 2012

New paper supports Miskolczi's theory of saturated greenhouse effect


Surface Water Vapor Pressure and Temperature Trends in North America during 1948-2010

V. Isaac and W. A. van Wijngaarden*
Physics Dept., Petrie Bldg., York University, 4700 Keele St., Toronto, ON Canada, M3J 1P3; e-mail: wlaser@yorku.ca

Abstract
Over 1/4 billion hourly values of temperature and relative humidity observed at 309 stations located across North America during 1948-2010 were studied. The water vapor pressure was determined and seasonal averages were computed. Data were first examined for inhomogeneities using a statistical test to determine whether the data was fit better to a straight line or a straight line plus an abrupt step which may arise from changes in instruments and/or procedure. Trends were then found for data not having discontinuities. Statistically significant warming trends affecting the Midwestern U.S., Canadian prairies and the western Arctic are evident in winter and to a lesser extent in spring while statistically significant increases in water vapor pressure occur primarily in summer for some stations in the eastern half of the U.S. The temperature (water vapor pressure) trends averaged over all stations were 0.30 (0.07), 0.24 (0.06), 0.13 (0.11), 0.11 (0.07) C/decade (hPa/decade) in the winter, spring, summer and autumn seasons, respectively. The averages of these seasonal trends are 0.20 C/decade and 0.07 hPa/decade which correspond to a specific humidity increase of 0.04 g/kg per decade and a relative humidity reduction of 0.5%/decade.


UPDATE: Dr. Miskolczi has reviewed the paper and comments on it:

I am sorry to say it gives little bearing on what the global average h2o column amount is doing with respect the greenhouse effect (or the global average IR optical depth of the atmosphere). 

First, let me remind you that the greenhouse effect (caused by the true absorbed surface upward LW flux density by greenhouse gases ) mutually depends on the total column amount of the IR absorbers and the spectral distribution of the surface upward radiation. There is a long way to go from a regional (USA, Canada) average surface h2o partial pressure trend to the trend in the true global average IR optical depth of the atmosphere. However, if you assume, that the published trends in the surface specific humidity and temperature is a representative global average, then the slight increase in temperature and h2o content really supports my theory of constant global average IR optical depth. The reason is that the increased surface temperature shifts the distribution of the spectral flux density towards the windows region and therefore reduces the flux absorption, while the increasing specific humidity tends to increase the IR absorption. The combined effect may be a constant greenhouse effect (as predicted theoretically by the constant IR optical depth of 1.87). 

Further, I have serious reservations with respect the methodology of the computations. 

1 - Equation 1. is incorrect, the specific humidity depends on the actual surface pressure. Looking for very small variations this dependence might not be negligible 

2 - Equation 2 (a version of the Bolton equation) is for the computation of saturated h2o pressure over water. I assume, that in winter time large areas are snow and ice covered and the temperature is well below freezing, therefore the use of the saturation pressure formula over ice is justified. (ei = 6.112 exp(22.46 t/(272.62 + t)) , WMO, CIMO 2008).  

3 - The argument that the positive h2o pressure trend and the negative relative humidity trend comes from Equation 7 is not quite true. The h2o pressure was computed from the saturation pressure, therefore the h2o partial pressure should have the same dependence on the ambient temperature as the saturation h2o pressure. The relative humidity is a true stochastic variable depending only on the instantaneous movement of the water vapor in the air. 

4. - The h2o partial pressure (or h2o number density) has a strong constraint with respect the actual total pressure (and number density), ie. the partial pressures of all atmospheric constituents should add up to the total pressure. The trends in the observed surface pressure were not presented, therefore one may not know where the excess h2o was coming.  

This paper by no means is a proof of the existence of some kind of positive h2o feedback working in the global greenhouse effect.


Ferenc Miskolczi

Thursday, September 8, 2011

Latest incoherent babbling from Gore: More water vapor causes more and less drought

No wonder Al Gore got a "D" in natural sciences... in his latest rant to the unquestioning Discovery Magazine he falsely claims atmospheric water vapor has increased due to global warming over the past 30 years [satellite data proves the opposite], and that said alleged increase in water vapor leads to both more and less drought. Note to Gore: more water vapor leads to more precipitation, not drought.
Gore: "the science linking the climate crisis to the increased frequency and severity of these extreme events is quite clear: There’s 4 percent more water vapor in the atmosphere above the oceans than there was only 30 years ago; and the extra heat is not only loading up the atmosphere with more water vapor that fuels these big storms, it’s also responsible for increased intensity and duration of drought. And of course the number of big precipitation events has been increasing around the world, and in the drought-prone areas, the intervals between the downpours have been longer."
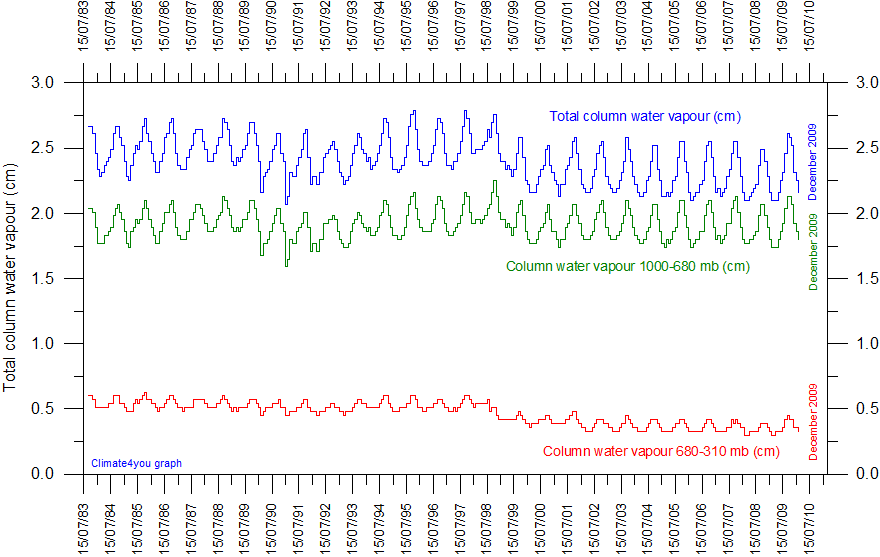
Variations in the total column water vapour in the atmosphere since July 1983 according to The International Satellite Cloud Climatology Project (ISCCP). The upper graph (blue) shows the total amount of water in the atmosphere. The green graph shows the amount of water in the lower troposphere between 1000 and 680 mb, corresponding to altitudes up to about 3 km. The lower red graph shows the amount of water between 680 and 310 mb, corresponding to altitudes from about 3 to 6 km above sea level. The marked annual variation presumably reflects the asymmetrical distribution of land and ocean on planet Earth, with most land areas located in the northern hemisphere. The annual peak in atmospheric water vapour content occur usually around August-September, when northern hemisphere vegetation is at maximum transpiration. The annual moisture peak occurs simultaneously at different levels in the atmosphere, which suggests an efficient transport of water vapour from the planet surface up into the troposphere. The time labels indicate day/month/year. There is a possibility that the step-like change shown 1998-1999 to some degree may be related to changes in the analysis procedure used for producing the data set, according to information from ISCCP.

Gore also shows his disconnect from reality claiming his climate hoax is "building" in support with a "powerful shift in perception." Gore claims that CO2 is "40 percent above the conditions that created the well-being of humanity on this planet," while ignoring the inconvenient truth that humans have existed for approximately 200,000 years and that for the vast majority of this period suffered through 2 long ice ages.
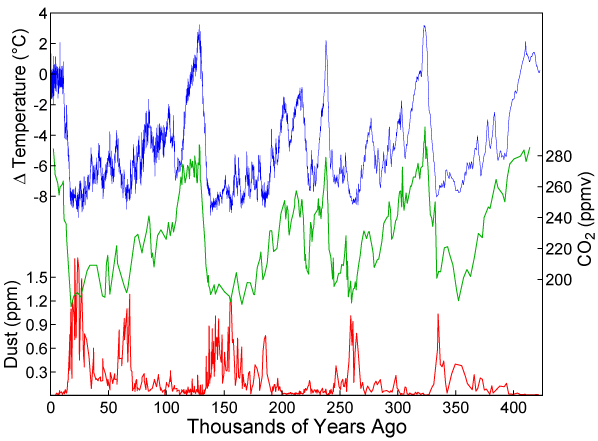
Temperature changes lead CO2 changes by approximately 800-1000 years in the Vostok ice core records

GORE PLANS 24 HOURS OF 'CLIMATE [HOAX] REALITY'
Kieran Mulvaney
Analysis by Kieran Mulvaney   DISCOVERY NEWS 
The last time former US Vice President Al Gore discussed the climate change issue with Discovery News, the Copenhagen treaty discussions were in full swing, and Gore expressed at the time that "I choose to be optimistic" about their outcome.
That was a shade under two years ago, and since then, for those concerned that human activities are changing the planet's climate, the outlook seems bleaker. The Copenhagen process failed to produce the global agreement for which supporters had hoped, and meanwhile, at least among segments of the population in the United States, skepticism about global warming has, if anything, hardened. And yet, Gore insisted in a conversation last week that he maintains the same optimistic outlook.
"I think there’s great cause for optimism despite the fact that the US political process has been paralyzed largely by a determined effort by the global warming polluters and their ideological allies in the smother-the-government-in-the-bathtub crowd," he said during a phone conversation with Discovery News and two other outlets. "I think the momentum at the grass roots is deceptively powerful, broad based and building, including among businesses, and I think that is very encouraging. And I think that ultimately the reality of climate change is increasingly difficult for the deniers to deny, and I think we’re in the midst now of a powerful shift in perception of what is happening."
That reality, he says, is evident: "The pollution produced worldwide every day – 90 million tons – is having the exact effects scientists have long predicted. Based on the laws of physics they cannot but have that effect." But, he argued recently in an article in Rolling Stone, the picture has been deliberately muddied by a strategy on the part of the fossil fuel industry to, as a leaked 1991 memo stated, 'Reposition global warming as theory, rather than fact.'
There's no doubt, he concedes, that "the political process has been paralyzed by this strategy of creating false doubt," which ranges from challenging the validity of the Intergovernmental Panel on Climate Change (IPCC) to floating red herrings, "like [warming is caused by] volcanoes or sunspots [or, more recently, cosmic rays], or it’s not getting warmer, or it’s stopped getting warmer, or something’s happening on Jupiter [note to Gore: as a matter of fact Mars has warmed 4 times faster than Earth] , or whatever." The strategy, he continues, extends to assailing "the integrity of the scientists themselves by regularly claiming they are making up evidence because they’re greedy and they’re trying to get more money for research grants by falsifying data. That is a slander that ought to be transparent, but when those and similar messages are pumped out through the mass media on a daily basis and reinforced by politicians who behave as if they are indentured servants of the carbon polluters, it has an effect, no doubt about that. But I think the key to it is to confront the reality of what we are facing."
As part of that effort, Gore's Climate Reality Project is launching a 24-hour event on September 14. In one city in each time zone, beginning in Mexico City at 7 p.m. Central Time and working west, a 30-minute slideshow presentation will be followed by a 30-minute discussion with a live audience. The 24 presentations will, in total, be made in 13 languages in locations as diverse as the Aleutian Islands, Cape Verde and Iceland, concluding in a presentation in New York City by Gore himself, with the entire day-long event streamed online. Gore says perhaps "98 percent" of the slideshow is an update of, and different from, the one that formed the basis of the Academy Award-winning An Inconvenient Truthit will, he says, focus on rebutting the three or four principal assertions made by climate change deniers, and will also focus on the succession of extreme weather events that have occurred globally over the last year.
Linking weather events and climate change is a fraught business, of course, whether doing so to reinforce or rebut global warming theory. But climate change models have long predicted that a changing climate will result in a greater abundance of such events, and greater extremes in those events that occur, and [self-annointed climate scientist] Gore is among those who argue that the evidence shows unequivocally that that impact is now being felt.
"In the last year, the reality of the climate crisis has become palpable," he says. "We’ve had 10 billion-dollar-plus events in the US alone. We’ve seen flooding in Pakistan, 20 million people displaced from their homes, further destabilizing a nuclear-armed country. In Australia, an area the size of France and Germany combined was inundated. In Russia, the drought and fires killed more than 50,000 people and resulted in all the grain from Russia, Ukraine, and Kazakhstan being taken off the market – which, among other factors, contributed to an all-time record food price spike. The Texas southwestern drought (Texas, New mexico, Oklahoma, Arizona) with no end in sight - of 254 counties in Texas, 252 of them were on fire this summer. And Nashville, where just a year ago we had a once-in-one-thousand-years rainfall, flooding out thousands of my neighbors who lost their homes and businesses and didn’t have flood insurance because it had never flooded in the areas affected.
"And again, the science linking the climate crisis to the increased frequency and severity of these extreme events is quite clear: There’s 4 percent more water vapor in the atmosphere above the oceans than there was only 30 years ago; and the extra heat is not only loading up the atmosphere with more water vapor that fuels these big storms, it’s also responsible for increased intensity and duration of drought. And of course the number of big precipitation events has been increasing around the world, and in the drought-prone areas, the intervals between the downpours have been longer."
Al Gore Interview 008But, insists Gore, the picture he and his fellow presenters will be painting is not one of a bleak future but one of - yes, that word again - optimism, one fueled not least by the increasing availability of relatively simple solutions.
"There are continued advances in the affordability and effectiveness of renewable energy and a continued awakening to the monetary benefits of adopting higher levels of efficiency," he says. "In some developing countries, the impact is even greater; just as some of those countries leapfrogged the old wired telephone networks and went straight to cellphones, those nations that do not have large electrical grids are going straight to small scale solar and wind. So I think as more people see the viability, affordability, and effectiveness of these alternatives, I think that gives tremendous momentum toward the overall effort toward a solution."
Even so, that optimism is tempered by urgency. "It’s a race against time, because the overburden of this heat trapping pollution grows every day. [Levels of atmospheric carbon dioxide are] already 40 percent above the levels when human civilization emerged, 40 percent above the conditions that created the well-being of humanity on this planet. But denying the reality that is now perceptible not just in scientific papers but with our eyes and ears all around us, that means any position based on the denial of reality is doomed to collapse. I just think the distance between reality and the false beliefs of the deniers is going to make that view increasingly untenable."