However, there are multiple fundamental problems with the claim including:
1. As stevengoddard.com points out in "Junk Science Award For The Evening"
February 26, 2015
"Over the deade the authors examined (2000 to 2010), the average level of the gas (CO2) in the atmosphere went up by 22 parts-per-million. And the time series shows a steadily rising trend in its impact, layered on top of the seasonal changes. By the end of that period, the gas was retaining an extra 0.2 Watts for every square meter of the Earth’s surface compared to the start.
Still, it seems worth noting that the continued increase in greenhouse energy retention measured during this time coincides with a period where the Earth’s surface temperatures did not change dramatically. All that energy must have been going somewhere. [i.e. to space] "
Newsflash: the greenhouse effect really exists | Ars Technica
The authors started in the 2000 La Nina, and ended at the 2010 El Nino – when troposphere temperatures were half a degree warmer. Then they noticed that there was slightly more downwelling long wave radiation [DWLR], which they blamed on increased absorption from the increase in CO2.
The increase in DLWR was due to the warmer troposphere during the El Nino. Warmer air emits more longwave radiation. The higher concentration of CO2 will also emit more DLWR radiation, but that is not due to increased absorption. I don’t know how scientists can get any more clueless than that.
Indeed, the authors admit in the abstract below that the CO2 contribution to the alleged overall trend of downwelling longwave radiation is a mere 10% of the total. So what caused the other 90%?
However, per the (debunked) IPCC formula, the rise in CO2 from 369.52 ppm in 2000 to 389.85 ppm in 2010 "would" have "trapped"
5.35*ln(389.85/369.52) or 0.29 W/m2
Thus even if one believes the IPCC formula and this new paper's assumptions (including extensive computer modeling in the new paper), the IPCC formula exaggerates CO2 surface radiative forcing by 45% over the observations.
3. Thirdly, the peak emission spectra of CO2 is at 15 microns, which by Wien's displacement law is equivalent to a blackbody radiating at -80C. Per the second law of thermodynamics, a low temperature/frequency/energy body at -80C cannot warm a higher temperature/frequency/energy body at 15C (Earth).
4. Rather, the entire 33K greenhouse effect is entirely explained by the Maxwell/Carnot/Clausius atmospheric mass/gravity/pressure theory and the 'greenhouse equation.' Increased CO2 instead facilitates loss of outgoing IR radiation to space, as has been observed by an increase in OLR (Outgoing Longwave Radiation) over the past 60+ years, opposite to the predictions of the alternative radiative forcing greenhouse theory.
The claim that the warming 2000-2010 is from CO2 confuses cause with effect. Warming of the atmosphere due to internal variability, ocean oscillations, cloud cover changes, solar amplification mechanisms, etc. secondarily warm the CO2 in the atmosphere increasing the 15 micron IR radiation observed from increased levels of CO2.

Update:
From Greenie Watch & Tallbloke's talkshop:
UPDATE: Rog Tallbloke Has even more fun with the above study than I did. He points out that in Alaska over the study period, the average temperature actually FELL by four degrees. So rising CO2 must cause cooling, Right?
Another point I did not mention because I saw no point in beating a dead horse concerns the graph below. It appeared with the original story.
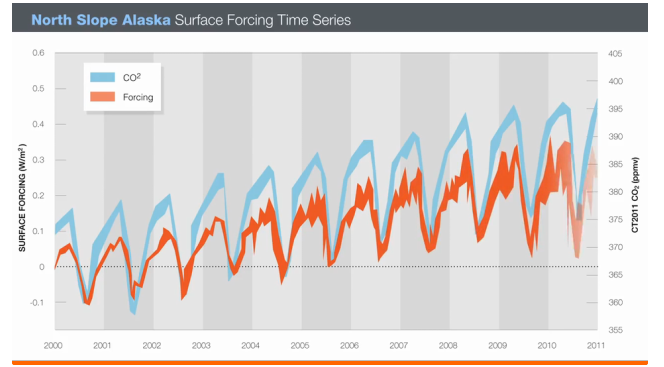
It shows two nicely matching curves, does it not? But what are the quantities being graphed? One is CO2 but the other is NOT temperature. It is a theoretically derived construct called forcing. Not so impressive.
Observational determination of surface radiative forcing by CO2 from 2000 to 2010
- Nature
- doi:10.1038/nature14240
- Received
- Accepted
- Published online
The climatic impact of CO2 and other greenhouse gases is usually quantified in terms of radiative forcing1, calculated as the difference between estimates of the Earth’s radiation field from pre-industrial and present-day concentrations of these gases. Radiative transfer models calculate that the increase in CO2 since 1750 corresponds to a global annual-mean radiative forcing at the tropopause of 1.82 ± 0.19 W m−2 (ref. 2). However, despite widespread scientific discussion and modelling of the climate impacts of well-mixed greenhouse gases, there is little direct observational evidence of the radiative impact of increasing atmospheric CO2. Here we present observationally based evidence of clear-sky CO2 surface radiative forcing that is directly attributable to the increase, between 2000 and 2010, of 22 parts per million atmospheric CO2. The time series of this forcing at the two locations—the Southern Great Plains and the North Slope of Alaska—are derived from Atmospheric Emitted Radiance Interferometer spectra3 together with ancillary measurements and thoroughly corroborated radiative transfer calculations4. The time series both show statistically significant trends of 0.2 W m−2per decade (with respective uncertainties of ±0.06 W m−2 per decade and ±0.07 W m−2 per decade) and have seasonal ranges of 0.1–0.2 W m−2. This is approximately ten per cent of the trend in downwelling longwave radiation5, 6, 7. These results confirm theoretical predictions of the atmospheric greenhouse effect due to anthropogenic emissions, and provide empirical evidence of how rising CO2 levels, mediated by temporal variations due to photosynthesis and respiration, are affecting the surface energy balance.
"One is CO2 but the other is NOT temperature. It is a theoretically derived construct called forcing." That theoretical construct is known as infrared radiation measured in watts per square meter. This is the same theoretical construction that comes out of a heat lamp.
ReplyDeleteThat one study is Feldman 2015 (1) under carefully controlled "CLEAR sky" conditions. But then, there is Dong, Xi, Minnis 2006, under "ALL sky" conditions, that found the reverse.
ReplyDeletehttps://uploads.disquscdn.com/images/f7284311bd39f1b54da5654cf20551919fa9f4c3e7880870c2c03fc6d223dac9.jpg
”Similar to the clear-sky study, we also provide the all-sky upwelling SW and LW fluxes to study the surface radiation budget under all-sky conditions. The rates of net SW and LW fluxes are −0.07 W/m^2 [per year] and −0.37 W/m^2 [per year], respectively, resulting in a decrease of 0.44 W/m^2 per year in NET flux at the surface (Figure 3b). The decline of NET flux, however, does not correlate with the increased surface air temperature as illustrated in Figure 3a. The surface air temperature is determined by the sum of NET radiation fluxes (downwelling and upwelling SW and LW fluxes) and nonradiative fluxes (sensible and latent heat fluxes, ground heat flux and energy flux used for melt), as well as the large-scale advection [Wild et al., 2004]. Wild et al. [2004] investigated this counterintuitive result and concluded that it may be due to a decrease of surface evaporation and associated reduced evaporative surface cooling.”
”… using the Stefan-Boltzmann equation indicates that an annual increase of 0.04°C air temperature each year corresponds to an increase of 0.4 W/m^2 per year in upward LW upward surface emission. However, the measured change is a decrease of 0.26 W/m^2 per year as shown in Figure 2e.”
Dong, Xiquan, Baike Xi, and Patrick Minnis 2006. "Observational evidence of changes in water vapor, clouds, and radiation at the ARM SGP site." Geophysical Research Letters
http://onlinelibrary.wiley.com/doi/10.1029/2006GL027132/full
(1)Feldman, Daniel R., et al. 2015 "Observational determination of surface radiative forcing by CO2 from 2000 to 2010.” Nature
http://asl.umbc.edu/pub/chepplew/journals/nature14240_v519_Feldman_CO2.pdf
Radiative flux is always measured in units of W/m^2, Radiative forcing is defined as the change in flux so I'm not sure what all the fuss is about. You could convert it to DeltaT if you wanted to apply a sensitivity parameter, but that isn't really the purpose of the paper.
ReplyDeleteThe measurements in this paper are good quality and the calculations that are done are completely standard in Chemical physics and molecular spectroscopy.
Point 3 is quite off course on the thermodynamics, but I'm pretty sure I'm not going to get anywhere with you on that one.
I'm curious, is the technology of the Et.el. paper the same as the satellite technology?
ReplyDelete