Showing posts sorted by relevance for query roman minoan. Sort by date Show all posts

Wednesday, July 25, 2012

Another broken hockey stick: New paper finds ocean temps were warmer during multiple periods over past 2700 years & current warming within natural variability

A paper published today in Geophysical Research Letters finds that sea surface temperatures [SSTs] in the Southern Okinawa Trough off the coast of China were warmer than the present during the Minoan Warm Period 2700 years ago, the Roman Warm Period 2000 years ago, and the Sui-Tang dynasty Warm Period 1400 years ago. According to the authors, "Despite an increase since 1850 AD, the mean [sea surface temperature] in the 20th century is still within the range of natural variability during the past 2700 years." In addition, the paper shows the rate of warming in the Minoan, Roman, Medieval, and Sui-Tang dynasty warm periods was much faster than in the current warming period since the Little Ice Age. The paper finds "A close correlation of SST in Southern Okinawa Trough with air temperature in East China, intensity of East Asian monsoon and the El-Niño Southern Oscillation index has been attributed to the fluctuations in solar output and oceanic-atmospheric circulation," which corroborates other papers demonstrating that the climate is highly sensitive to tiny changes in solar activity. The paper adds to the peer-reviewed publications of over a thousand scientists showing that the current warm period is well within the range of natural variability and is not unprecedented, not accelerated, and not unusual in any respect. 
Reconstructed Sea Surface Temperatures [SSTs] over the past 2700 years. The Minoan, Roman {RWP],   & Sui-Tang dynasty [STWP] warm periods were all warmer than the current warm period [CWP]. The Dark Ages Cold Period [DACP] and Little Ice Age [LIA] are also shown.
GEOPHYSICAL RESEARCH LETTERS, VOL. 39, L14705, 5 PP., 2012
doi:10.1029/2012GL052749
Key Points
  • The 20th century warming in SOT is still within variability of late Holocene
  • A strong coupling of KC, EAM and ENSO exists in late Holocene
  • MWP has a mean SST lower than RWP and STWP in Okinawa Trough
Weichao Wu
MOE Laboratory for Earth Surface Processes, College of Urban and Environmental Sciences, Peking University, Beijing, China
Wenbing Tan
MOE Laboratory for Earth Surface Processes, College of Urban and Environmental Sciences, Peking University, Beijing, China
Liping Zhou
MOE Laboratory for Earth Surface Processes, College of Urban and Environmental Sciences, Peking University, Beijing, China
Center for Ocean Studies, Peking University, Beijing, China
Huan Yang
Key Laboratory of Biogeology and Environmental Geology of Ministry of Education, China University of Geosciences, Wuhan, China
Yunping Xu
MOE Laboratory for Earth Surface Processes, College of Urban and Environmental Sciences, Peking University, Beijing, China
Center for Ocean Studies, Peking University, Beijing, China
Most of the temperature reconstructions for the past two millennia are based on proxy data from various sites on land. Here we present a bidecadal resolution record of sea surface temperature (SST) in Southern Okinawa Trough for the past ca. 2700 years by analyzing tetraether lipids of planktonic archaea in the ODP Hole 1202B, a site under the strong influence of Kuroshio Current and East Asian monsoon. The reconstructed SST anomalies generally coincided with previously reported late Holocene climate events, including the Roman Warm Period, Sui-Tang dynasty Warm Period, Medieval Warm Period, Current Warm Period, Dark Age Cold Period and Little Ice Age. However, the Medieval Warm Period usually thought to be a historical analogue for the Current Warm Period has a mean SST of 0.6–0.8°C lower than that of the Roman Warm Period and Sui-Tang dynasty Warm Period. Despite an increase since 1850 AD, the mean SST in the 20th century is still within the range of natural variability during the past 2700 years. A close correlation of SST in Southern Okinawa Trough with air temperature in East China, intensity of East Asian monsoon and the El-Niño Southern Oscillation index has been attributed to the fluctuations in solar output and oceanic-atmospheric circulation.

Tuesday, November 27, 2012

New paper finds Roman Warming Period in Florida was warmer than today

A new paper published in Quaternary International reconstructs temperatures in SW Florida and finds that summer temperatures during the Roman Warm Period [RWP] from 300 BC-550 AD were "insignificantly different from today" and that winters during the RWP were "colder than today at 150-200 AD and 250-300 AD, similar to today at 200-250 AD, 300-350 AD and 450-500 AD, and warmer than today at 500-550 AD." The paper adds to hundreds of other peer-reviewed papers demonstrating temperatures during the Medieval, Roman, Minoan, and other unnamed warming periods were as warm or warmer than today.

The paper also shows that tiny variations in Total Solar Irradiance [TSI] of less than 1 W/m2 correlated with significant changes in reconstructed temperature of up to 5C. The IPCC claims that changes in TSI during the 20th century of about 1.5 W/m2 cannot account for 0.7C observed global warming, but data from this paper and others suggests otherwise. In addition, the paper shows TSI lagged by 50 years is better correlated to reconstructed temperatures, perhaps as a result of the enormous thermal inertia of the oceans. 
Modern temperature shown by double arrows on left vertical axis, coldest winter temps from 8 otoliths shown by red boxes. Grey line is variation in total solar irradiance [TSI] and black line is TSI lagged 50 years.
 Figure 6. Reconstructed Roman Warm Period and Vandal Minimum summers and winters in comparison with solar irradiance change. Symbols in red represent the Roman Warm Period and symbols in blue represent the Vandal Minimum. The thin line represents the variation of total solar irradiance ΔTSI (TSI value relative to the solar minimum 1365.57 Wm−2 in 1986) and the thick line represents the same profile as the thin line but with 50-year time lag (from Steinhilber et al., 2009). (B) Open circles represent coldest temperatures selected for evaluating winter temperature. Each open square represents each archaeological otolith specimen. The height of open squares represents its average winter temperature with standard error and the width of open squares represents its chronostratigraphic range. Double arrow represents the average winter temperature of modern otolith MOD2002 (from Wang et al., 2011).


Seasonal climate change across the Roman Warm Period/Vandal Minimum transition using isotope sclerochronology in archaeological shells and otoliths, southwest Florida, USA

  • a Department of Geological Sciences, University of North Carolina at Chapel Hill, Mitchell Hall, Campus Box # 3315, Chapel Hill, NC 27599, USA
  • b Florida Museum of Natural History, University of Florida, PO Box 117800, Gainesville, FL 32611-7800, USA

Archaeological evidence suggests that southwest Florida experienced variably warmer and wetter climate during the Roman Warm Period (RWP; 300 BC-550 AD) relative to the Vandal Minimum (VM; 550-800 AD). This hypothesis was tested by reconstructing seasonal-scale climate conditions for the latter part of the RWP (1-550 AD) by using high-resolution oxygen isotope ratios (δ18O) of archaeological shells (Mercenaria campechiensis) and otoliths (Ariopsis felis). Eight shells radiocarbon-dated to 150-550 AD recorded that the RWP summers at 150-250 AD were insignificantly different from today and the RWP summers at 250-350 AD and 450-550 AD were drier relative to today. Eight otoliths indicate that the winters were variable during the RWP, colder than today at 150-200 AD and 250-300 AD, similar to today at 200-250 AD, 300-350 AD and 450-500 AD, and warmer than today at 500-550 AD. The climate reconstructions agree with archaeological observations and are partially coherent with the history of sea-level change, with a drying and cooling trend at the 95% confidence level across the RWP/VM transition. The climate transition is not only consistent with falling sea level, but also coherent with reduced solar radiation. Reduced solar radiation may have triggered a change in atmospheric circulation patterns that precipitated the observed climate transition.

Thursday, August 29, 2013

New paper finds another non-hockey-stick in China

A new paper published in Quaternary Science Reviews reconstructs the mean annual temperature in the Pearl River Basin, China over the past ~6,300 years and finds another non-hockey-stick with the modern mean annual temperature of ~15.4C exceeded many times in the past including during the Medieval, Roman, Minoan, and Egyptian Warming Periods, and by the Holocene Climate Optimum. 


Horizontal axis is years before the present. Modern mean annual temperature is ~15.4 C.

A new regional, mid-Holocene palaeoprecipitation signal of the Asian Summer Monsoon

  • a School of Geographical Sciences, University of Bristol, University Road, Bristol BS8 1SS, UK
  • b Organic Geochemistry Unit, The Cabot Institute, School of Chemistry, University of Bristol, Cantocks Close, Bristol BS8 1TS, UK
  • c British Geological Survey, Kingsley Dunham Centre, Keyworth, Nottingham NG12 5GG, UK
  • d Department of Earth Sciences, University of Hong Kong, James Lee Sciences Building, Pokfulam Road, Hong Kong, China
  • e Department of Geography, University of Durham, South Road, Durham DH1 3LE, UK
  • f Earth Observatory of Singapore, Nanyang Technological University, 50 Nanyang Avenue, Block N2-01a-15, 639798, Singapore

Highlights

The Dongge speleothem δ18O record mirrors the Pearl River Estuary BIT record.
This suggests both are driven by regional precipitation (Asian Summer Monsoon).
Leaf wax δ13C values reflect the initiation of anthropogenic cultivation ∼2 ka.
Scale-equivalent comparison with climate model-data is possible for the first time.

Abstract

The Dongge Cave speleothem δ18O record, which lies in the Pearl River basin (China), has been interpreted as recording a regional decline in Asian Summer Monsoon precipitation over the last 6.5 ka. The same overall trend is seen in the bulk sedimentary organic δ13Corg record from a core in the Pearl River Estuary. However, the two records differ in detail and the regional nature of the Dongge palaeoprecipitation signal has therefore been questioned. Our study re-evaluates both records by constructing, for the same estuarine core, biomarker and compound-specific δ13C records, which have better constrained terrestrial and marine end members than δ13Corg, providing additional insights into the evolution of the Asian Summer Monsoon.
The Branched Isoprenoidal Tetraether (BIT) index reflects the ratio of soil versus marine organic matter. The BIT record from the estuarine core co-varies with the Dongge Cave δ18O record suggesting the two share a common control which is likely to be driven by regional climate. By contrast, the sterols, n-alcohols and n-fatty acid ratios show the same overall trend as Dongge, but parallel the δ13Corg record's variability between 6.5 and 2 ka indicating a partial decoupling between soil and land-plant organic matter fluxes in the Pearl River Basin. There is clear divergence between the biomarker and 13Corg records from 2 ka to present. Analysis of the leaf wax δ13C suggests that this results from an abrupt change in vegetation probably resulting from local, anthropogenic cultivation two thousand years ago.
The basin scale of these estuarine records equates to up to 15 grid cells in typical Earth System Models used for simulating global climate. This permits comparison of Palaeoclimate Model Intercomparison Project simulations of the mid-Holocene with spatially equivalent data relating to the Summer Asian Monsoon, for the first time.

Thursday, August 15, 2013

New paper finds another 2 non-hockey-sticks in Sweden, cooling over past ~7000 years

A paper published today in Quaternary Science Reviews reconstructs temperatures in southern Sweden over the past 10,000 years and finds 2 more non-hockey-sticks with both annual and summer temperatures showing a long-term cooling over the past ~7,000 years. The paper shows the Medieval, Roman, Minoan, Egyptian and Holocene Climate Optimum warming periods were all warmer than modern temperatures. 

First graph at left side shows annual temperatures have declined over the past ~7000 years since the Holocene Climate Optimum. Vertical axis is years before the present.
New evidence of Holocene atmospheric circulation dynamics based on lake sediments from southern Sweden: a link to the Siberian High
  • a Department of Geological Sciences, Stockholm University, 106 91 Stockholm, Sweden
  • b Institute of Geosciences, University of Kiel, Ludewig-Meyn-Str. 10, 24118 Kiel, Germany
  • c Department of Geology, Lund University, Sölvegatan 12, 223 62 Lund, Sweden

Highlights

New isotopic lake sediment sequence from the Baltic Sea island of Gotland.
The lake's paleohydrology is sensitive to the intensity of the Siberian High.
Polar air outbreaks across the region were more frequent after c. 6000 cal. yr BP.

Abstract

Oxygen (δ18O) and carbon (δ13C) isotope records of calcitic carbonate components (Chara sp. algal encrustations and Bithynia tentaculata gastropod opercula) from a lake-sediment succession on the Baltic Sea island of Gotland, south-eastern Sweden, have been obtained to investigate regional climate dynamics during the Holocene. The hydrological sensitivity of the small lake, particularly in terms of spring snowmelt contribution to the local water budget, provides a means of tracing past changes in the influence of snow-bearing easterly winds across the Baltic Sea Proper, which signifies the wintertime strength of the Siberian High. Repeated episodic depletions in 18O at the centennial scale correlate with events of increased potassium concentration in the GISP2 ice-core record from Greenland, which indicates a coupling to large-scale fluctuations in atmospheric circulation patterns. A corresponding correlation with simultaneous depletions in 13C suggests repeated responses of the local lake hydrology to snow-rich winters through decreasing water residence time, perhaps augmented by methanogenesis due to prolonged ice-cover seasons under the influence of an expanding Siberian High. Frequency analysis of the isotopic records reveals well-defined fluctuations at quasi-500-520-, 670-, 830- and 1430-yr periodicities, and a gradually stronger impact of Polar air outbreaks across the southern Baltic Sea region with time after ca 6000 cal. BP.

Tuesday, April 29, 2014

How to lie with climate statistics & probability, version 10¹³

A paper published today in the Journal of Geophysical Research claims that the probability of the streak of contiguous US average monthly temperatures from June 2011 - June 2012 "occurring randomly was quoted as (1/3)^13, or about one in 1.6 million." 

This is odd, given that more than 1,200 peer-reviewed, published non-hockey-sticks demonstrate the Medieval Warm Period [worldwide including North America] was as warm or warmer than the present. There is also ice core data from the Arctic and Antarctic, and hundreds of other proxy studies indicating the Roman, Minoan, Egyptian, Holocene Climate Optimum, and many other unnamed warming periods were warmer than the present. The last interglacial was ~8C warmer than the present, as were almost all of the other interglacials over the past 5.2 million years. 


Maybe it's just me looking at those stupid denier lines, but seems to me the chances that such a "temperature streak" could occur naturally in the US [only 2% of the planet!] are to an approximation about one million in one million. 

The background on how skeptics view those stupid global warming denier lines:


UPDATE: Sunshine Hours analyzed the US temperature record and found another similar "temperature streak" in 1933/1934, and that's after all of the fraudulent up-justing of the US temperature records:

The Hockey Schtick blog brought a recent paper to my attention.

The abstract says:
“A recent observation in NOAA’s National Climatic Data Center’s monthly assessment of the state of the climate was that contiguous US average monthly temperatures were in the top third of monthly ranked historical temperatures for thirteen straight months from June 2011 — June 2012. The chance of such a streak occurring randomly was quoted as (1/3)13, or about one in 1.6 million.”

I’m not going to discuss the “chances”. But I am going to simply note the following.

The NOAA ranks months temperature and precipitation based on the number of months from 1895. So 2012 was the 118th year. If a month is ranked 118 (as of 2012) then it was the warmest month from 1895 to 2012.
Using the same 12 month June to June time frame and using data from October 2012 ( before NOAA’s recent update) it took me about 10 minutes to find out a similar streak.

From June 1933 to to June 1934 8 months were ranked 100 and above. 2 of them were ranked 118.
From June 2011 to June 2012 8 months were ranked 100 and above. 1 of them was ranked 118.

yearMonthRank
19336118
19337104
19339116
193312115
19341114
19344107
19345118
19346108

yearMonthRank
20117114
20118117
20121115
20122104
20123118
20124116
20125117
20126107

What are the odds of that occurring 80 years apart!


Warm Streaks in the US Temperature Record: What are the Chances?

Peter F. Craigmile et al


A recent observation in NOAA's National Climatic Data Center's monthly assessment of the state of the climate was that contiguous US average monthly temperatures were in the top third of monthly ranked historical temperatures for thirteen straight months from June 2011 — June 2012. The chance of such a streak occurring randomly was quoted as (1/3)13, or about one in 1.6 million. The streak continued for three more months before the October 2012 value dropped below the upper tercile. The climate system displays a degree of persistence that increases this probability, relative to the assumption of independence. This paper puts forth different statistical techniques that more accurately quantify the probability of this and other such streaks. We consider how much more likely streaks are when an underlying warming trend is accounted for in the record, the chance of streaks occurring anywhere in the record, and the distribution of the record's longest streak.

Tuesday, March 19, 2013

New paper shows Greenland was warmer during the 1930's and 1400's than the present

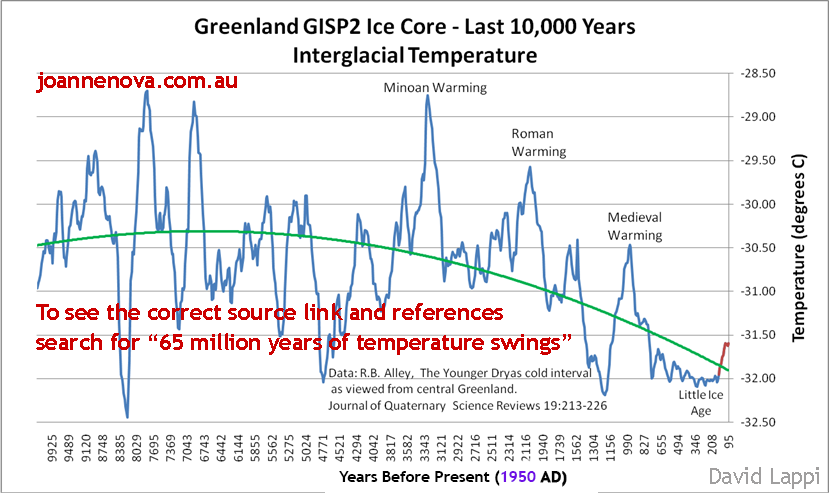
A new paper published in Climate of the Past reconstructs Greenland temperatures over the past 800 years and shows that reconstructed temperatures were higher in the 1930's and 1400's than at the end of the record in the year 2000. The paper also finds Greenland temperatures correlated to "solar-induced changes in atmospheric circulation patterns such as those produced by the North Atlantic Oscillation/Arctic Oscillation (NAO/AO)." The Medieval Warming Period 1000 years ago is not included in this 800 year reconstruction, but Greenland ice cores demonstrate that the Medieval, Roman, Minoan, Egyptian, and other unnamed warming periods were all warmer than modern Greenland temperatures.
Reconstructed Greenland temperatures shown in blue bottom graph were higher in the 1930's and 1400's than at the end of the record in the year 2000. Michael Mann's bogus hockey stick is shown  for comparison in green in top graph. 

Clim. Past, 9, 583-596, 2013
www.clim-past.net/9/583/2013/
doi:10.5194/cp-9-583-2013

On the origin of multidecadal to centennial Greenland temperature anomalies over the past 800 yr

T. Kobashi1,2, D. T. Shindell3, K. Kodera4,5, J. E. Box6,7, T. Nakaegawa4, and K. Kawamura1
1National Institute of Polar Research, 10-3 Midoricho, Tachikawa, Tokyo, 190-8518, Japan
2Scripps Institution of Oceanography, University of California, San Diego, La Jolla, CA 92093, USA
3NASA Goddard Institute for Space Studies, New York, NY 10025, USA
4Meteorological Research Institute, Tsukuba, 305-0052, Japan
5Solar Terrestrial Environment Laboratory, Nagoya University, Nagoya, Japan
6Byrd Polar Research Center, The Ohio State University, Columbus, OH 43210, USA
7Department of Geography, The Ohio State University, Columbus, OH 43210, USA

 Abstract. The surface temperature of the Greenland ice sheet is among the most important climate variables for assessing how climate change may impact human societies due to its association with sea level rise. However, the causes of multidecadal-to-centennial temperature changes in Greenland temperatures are not well understood, largely owing to short observational records. To examine these, we calculated the Greenland temperature anomalies (GTA[G-NH]) over the past 800 yr by subtracting the standardized northern hemispheric (NH) temperature from the standardized Greenland temperature. This decomposes the Greenland temperature variation into background climate (NH); polar amplification; and regional variability (GTA[G-NH]). The central Greenland polar amplification factor as expressed by the variance ratio Greenland/NH is 2.6 over the past 161 yr, and 3.3–4.2 over the past 800 yr. The GTA[G-NH] explains 31–35% of the variation of Greenland temperature in the multidecadal-to-centennial time scale over the past 800 yr. We found that the GTA[G-NH] has been influenced by solar-induced changes in atmospheric circulation patterns such as those produced by the North Atlantic Oscillation/Arctic Oscillation (NAO/AO). Climate modeling and proxy temperature records indicate that the anomaly is also likely linked to solar-paced changes in the Atlantic meridional overturning circulation (AMOC) and associated changes in northward oceanic heat transport.

 Final Revised Paper (PDF, 7995 KB)   Discussion Paper (CPD)   Special Issue

Monday, March 4, 2013

New paper finds Arctic temperatures were up to 3.8°C warmer ~3000 years ago

A paper published today in Quaternary Science Reviews reconstructs Arctic temperatures in Kamchatka, USSR over the past 4,500 years and finds the highest reconstructed temperatures were about 3.8°C warmer than modern temperatures. The authors find "the highest reconstructed temperature reaching 16.8 °C between 3700 and 2800 years before the present," about 3.8°C above "modern temperatures (∼13 °C)." In addition, the data shows temperatures between 2500 - 1100 [during the Medieval and Roman warming periods] were about 1-2°C above modern temperatures of ~13°C. The paper adds to many other peer-reviewed papers demonstrating that there is nothing unusual, unnatural, or unprecedented regarding modern Arctic temperatures. 
Graph on left side shows reconstructed July temperatures were 1-2°C  higher than modern from 2500-1100 years ago [during the Roman and Medieval warming periods], and up to 3.8°C higher than modern from 3700-2800 years ago [during Egyptian and Minoan warming periods]. Second graph from left shows similar changes in Greenland ice core data.

Late Holocene climate and environmental changes in Kamchatka inferred from the subfossil chironomid record
  • a Alfred Wegener Institute for Polar and Marine Research, Research Unit Potsdam, Telegrafenberg A43, 14473 Potsdam, Germany
  • b Kazan Federal University, Kremlyovskaya Str., 18, 420018 Kazan, Russia
  • c Potsdam University, Am Neuen Palais 10, 14469 Potsdam, Germany
  • d University of Tromsø, Department of Geology, Dramsveien 201, 9037 Tromsø, Norway
  • e Institute of Volcanology and Seismology FED RAS, Piipa blvd., 9, 683006 Petropavlovsk-Kamchatsky, Russia

Abstract

This study presents a reconstruction of the Late Holocene climate in Kamchatka based on chironomid remains from a 332 cm long composite sediment core recovered from Dvuyurtochnoe Lake (Two-Yurts Lake, TYL) in central Kamchatka. The oldest recovered sediments date to about 4500 cal years BP. Chironomid head capsules from TYL reflect a rich and diverse fauna. An unknown morphotype of Tanytarsini,Tanytarsus type klein, was found in the lake sediments. Our analysis reveals four chironomid assemblage zones reflecting four different climatic periods in the Late Holocene. Between 4500 and 4000 cal years BP, the chironomid composition indicates a high lake level, well-oxygenated lake water conditions and close to modern temperatures (∼13 °C). From 4000 to 1000 cal years BP, two consecutive warm intervals were recorded, with the highest reconstructed temperature reaching 16.8 °C between 3700 and 2800 cal years BP. Cooling trend, started around 1100 cal years BP led to low temperatures during the last stage of the Holocene. Comparison with other regional studies has shown that termination of cooling at the beginning of late Holocene is relatively synchronous in central Kamchatka, South Kurile, Bering and Japanese Islands and take place around 3700 cal years BP. From ca 3700 cal years BP to the last millennium, a newly strengthened climate continentality accompanied by general warming trend with minor cool excursions led to apparent spatial heterogeneity of climatic patterns in the region. Some timing differences in climatic changes reconstructed from chironomid record of TYL sediments and late Holocene events reconstructed from other sites and other proxies might be linked to differences in local forcing mechanisms or caused by the different degree of dating precision, the different temporal resolution, and the different sensitive responses of climate proxies to the climate variations. Further high-resolution stratigraphic studies in this region are needed to understand the spatially complex pattern of climate change in Holocene in Kamchatka and the surrounding region.

Highlights

► We investigated fossilized chironomids in lake sediment core from Central Kamchatka. ► We reconstructed late Holocene climate variations using chironomid inference model. ► Before 3.7 cal ka BP reconstructed TJuly are close to present day temperatures. ► Between 3.7 and 1.1 cal ka BP two warm stages are reconstructed. ► After 1.1 cal ka BP lower than present day TJuly are reconstructed.