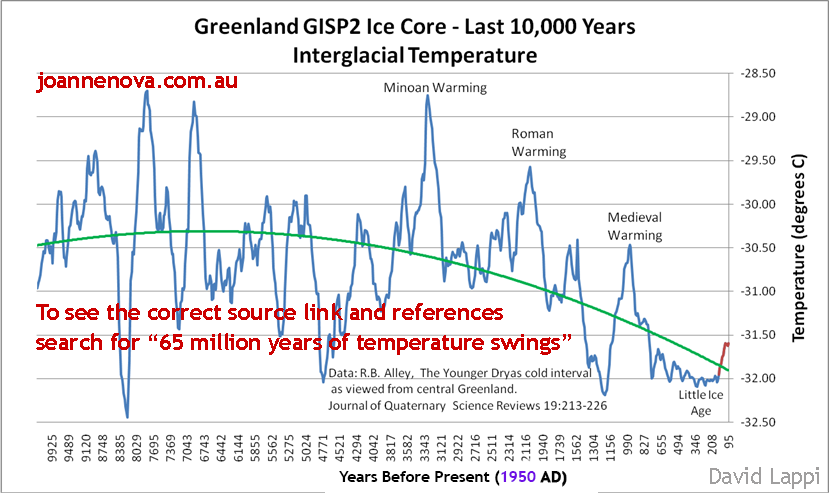
This is odd, given that more than 1,200 peer-reviewed, published non-hockey-sticks demonstrate the Medieval Warm Period [worldwide including North America] was as warm or warmer than the present. There is also ice core data from the Arctic and Antarctic, and hundreds of other proxy studies indicating the Roman, Minoan, Egyptian, Holocene Climate Optimum, and many other unnamed warming periods were warmer than the present. The last interglacial was ~8C warmer than the present, as were almost all of the other interglacials over the past 5.2 million years.
Maybe it's just me looking at those stupid denier lines, but seems to me the chances that such a "temperature streak" could occur naturally in the US [only 2% of the planet!] are to an approximation about one million in one million.
The background on how skeptics view those stupid global warming denier lines:
UPDATE: Sunshine Hours analyzed the US temperature record and found another similar "temperature streak" in 1933/1934, and that's after all of the fraudulent up-justing of the US temperature records:
Warm Streaks in the US Temperature Record: What are the Chances?
Peter F. Craigmile et al
A recent observation in NOAA's National Climatic Data Center's monthly assessment of the state of the climate was that contiguous US average monthly temperatures were in the top third of monthly ranked historical temperatures for thirteen straight months from June 2011 — June 2012. The chance of such a streak occurring randomly was quoted as (1/3)13, or about one in 1.6 million. The streak continued for three more months before the October 2012 value dropped below the upper tercile. The climate system displays a degree of persistence that increases this probability, relative to the assumption of independence. This paper puts forth different statistical techniques that more accurately quantify the probability of this and other such streaks. We consider how much more likely streaks are when an underlying warming trend is accounted for in the record, the chance of streaks occurring anywhere in the record, and the distribution of the record's longest streak.
Maybe it's just me looking at those stupid denier lines, but seems to me the chances that such a "temperature streak" could occur naturally in the US [only 2% of the planet!] are to an approximation about one million in one million.
The background on how skeptics view those stupid global warming denier lines:
UPDATE: Sunshine Hours analyzed the US temperature record and found another similar "temperature streak" in 1933/1934, and that's after all of the fraudulent up-justing of the US temperature records:
The Hockey Schtick blog brought a recent paper to my attention.
The abstract says:
“A recent observation in NOAA’s National Climatic Data Center’s monthly assessment of the state of the climate was that contiguous US average monthly temperatures were in the top third of monthly ranked historical temperatures for thirteen straight months from June 2011 — June 2012. The chance of such a streak occurring randomly was quoted as (1/3)13, or about one in 1.6 million.”
I’m not going to discuss the “chances”. But I am going to simply note the following.
The NOAA ranks months temperature and precipitation based on the number of months from 1895. So 2012 was the 118th year. If a month is ranked 118 (as of 2012) then it was the warmest month from 1895 to 2012.
Using the same 12 month June to June time frame and using data from October 2012 ( before NOAA’s recent update) it took me about 10 minutes to find out a similar streak.
From June 1933 to to June 1934 8 months were ranked 100 and above. 2 of them were ranked 118.
From June 2011 to June 2012 8 months were ranked 100 and above. 1 of them was ranked 118.
| year | Month | Rank |
| 1933 | 6 | 118 |
| 1933 | 7 | 104 |
| 1933 | 9 | 116 |
| 1933 | 12 | 115 |
| 1934 | 1 | 114 |
| 1934 | 4 | 107 |
| 1934 | 5 | 118 |
| 1934 | 6 | 108 |
| year | Month | Rank |
| 2011 | 7 | 114 |
| 2011 | 8 | 117 |
| 2012 | 1 | 115 |
| 2012 | 2 | 104 |
| 2012 | 3 | 118 |
| 2012 | 4 | 116 |
| 2012 | 5 | 117 |
| 2012 | 6 | 107 |
What are the odds of that occurring 80 years apart!
Warm Streaks in the US Temperature Record: What are the Chances?
Peter F. Craigmile et al
A recent observation in NOAA's National Climatic Data Center's monthly assessment of the state of the climate was that contiguous US average monthly temperatures were in the top third of monthly ranked historical temperatures for thirteen straight months from June 2011 — June 2012. The chance of such a streak occurring randomly was quoted as (1/3)13, or about one in 1.6 million. The streak continued for three more months before the October 2012 value dropped below the upper tercile. The climate system displays a degree of persistence that increases this probability, relative to the assumption of independence. This paper puts forth different statistical techniques that more accurately quantify the probability of this and other such streaks. We consider how much more likely streaks are when an underlying warming trend is accounted for in the record, the chance of streaks occurring anywhere in the record, and the distribution of the record's longest streak.

FYI:
ReplyDeletehttp://sunshinehours.wordpress.com/2014/04/30/the-streak-19331934-and-20112012/
From June 1933 to to June 1934 8 months were ranked 100 and above. 2 of them were ranked 118.
From June 2011 to June 2012 8 months were ranked 100 and above. 1 of them was ranked 118.
Thanks much - I've added as an update to the post above
Deletesee also William Briggs post
ReplyDeletehttp://wmbriggs.com/blog/?p=12321