Showing posts sorted by date for query pettersson. Sort by relevance Show all posts

Tuesday, December 17, 2013

Biochemistry professor explains why man-made CO2 remains in the atmosphere only 14 years

Biochemistry professor Dr. Gösta Pettersson updates his prior posts on why the lifetime of man-made CO2 in the atmosphere is only about 14 years, not hundreds to thousands as claimed by the IPCC and the IPCC's Bern Model.

Google translation + light editing from the Swedish site Stockholm's Initiative:

The informational bomb curve 


Here is a guest post by biochemistry Professor Dr. Gösta Pettersson with new results that provide answers to criticism performed in a couple of blog posts by Professor Mats Almgren. Gösta Pettersson shows that his simple temperature-dependent box model can explain both the bomb curve and the Keeling Curve including El Niño fluctuations. In addition to the weaknesses of Mats Almgren criticism Gösta Pettersson takes up here, I brought up other weaknesses in an earlier blog post .

The informational bomb curve

Gösta Pettersson
The above-ground nuclear weapons tests during the Cold War are approximately doubled atmospheric levels of C14 emissions. After the 1963 test ban treaty, most of this excess of 14C-carbon dioxide removed from the atmosphere. That this is the case has been coated by measurements of the so-called ΔC14 values, whose temporal changes constitute what I described as bomb test curve.
Professor Mats Almgren has indicated that ΔC14 at current definition is not proportional to changes in the amount of C14, but related to the latter ( n14 ) according to the relationship
n14/n14s = (ΔC14 +1) n12/n12s Eqn. (1)
where n12 represents the amount of C12 and the index s indicates the values ​​of the variables in a standard year (1950) prior to nuclear tests. In my last guest post corrected and I packed me for Almgren's instructions and featured a character with an accurate translation of ΔC14 to n14 . It is reproduced in slightly modified form in Figure 1 below, which shows how the amount of C14 in the atmosphere declined after September 1963, ΔC14 values ​​measured at the North Cape and in Central Europe. I embrace the Almgren and others abbreviation of "bomb test curve" to "bomb curve", but let those words stand for black data in Fig.1, the ones that show how the amount of airborne C14-carbon dioxide dropped after the CTBT.
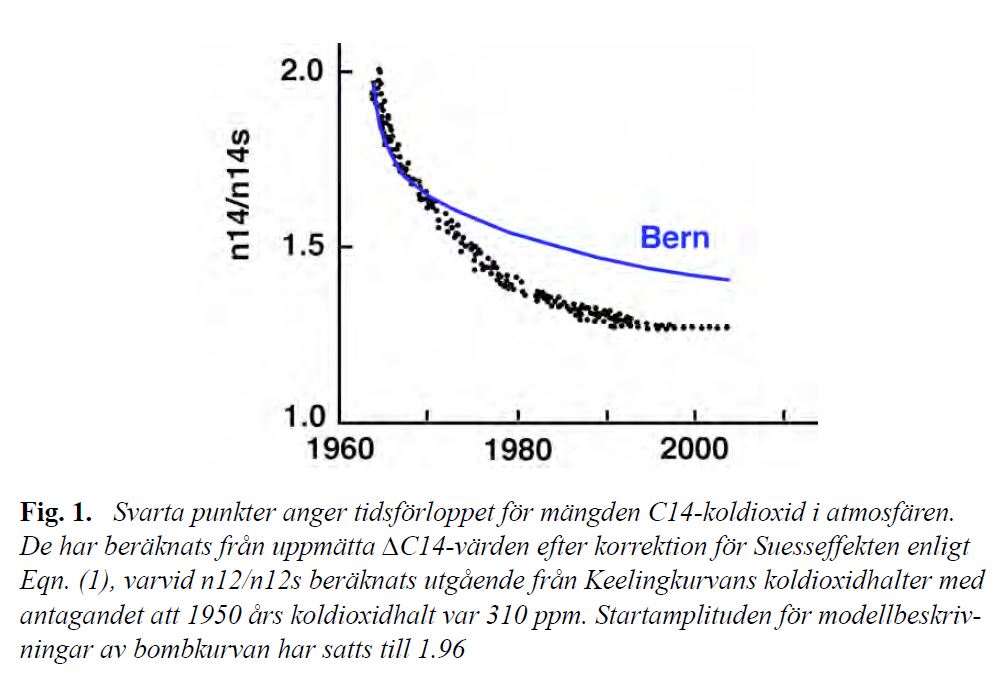
The informational bomb curve Figure 1
Following the agreement reached concerning the translation of ΔC14 to n14 has Almgren gave his views on what the bomb curve says about the carbon cycle. He argues that it requires very specific conditions to the disappearance of a pulse of carbon dioxide shall comply the bomb curve course, there were plenty of C14 in the system even before the bomb tests, there is evidence that air is added to the C14, both before and after the bomb tests, and to Such C14-supply suggested to be due to isotope effects in carbon dioxide exchange.
These circumstances lead to the conclusion Almgren to bomb curve is not at all reflect the disappearance of a pulse of carbon dioxide and therefore can not be used for falsification of eg. [the IPCC's] Bern model. I want to designate as a completely wrong conclusion . Almgrens words "not at all reflect" probably has a different meaning than what I deduce from them and is a trifle in the context. But just in case it should be noted that the bomb curve is obviously highly influenced by (and in this sense reflects) the disappearance of the excess pulse of 14C-carbon dioxide bomb tests gave rise to. Since the C14 carbon is carbon dioxide gives bomb curve thus information about the disappearance of a pulse of carbon dioxide. This information can obviously be used to test the validity of the presented CO2 model.
The Bern model has been constructed and calibrated based on the premise that only anthropogenic emissions contributed to increasing atmospheric carbon dioxide concentration under Keeling Curve. Blue curve in Figure 1 shows the graph of the model's "impulse response function", ie. the relaxation function that specifies under which the time course a pulse rate of carbon dioxide excess on the model is removed from the atmosphere. The model considers all carbon isotopes as kinetically identical, why blue curve also indicates the model regulations relating to the relaxation process of an excess pulse of C14 emissions.
Therefore, the results in Figure 1 are clearly evidence that the Bern model is falsified by the bomb curve . The 1963 surplus of C14 CO2 disappeared significantly faster than the Bern model prescribes. None of the of Almgren foregoing circumstances may change the situation. Have the air added to the C14 after the bomb test pulse, so this addition is included in the bomb curve and not the later one iota closer to the blue model curve in Figure 1. Conversely, the discrepancy between the blue curve and the part of the bomb curve corresponding to the relaxation of bomb test pulse. Furthermore, the experimental ΔC14 values ​​measured with high accuracy and corrected for Suess effect on the basis of well known data for n12/n12s-kvoten. This means that the discrepancy between the observations and blue curve in Figure 1 is not significant and represents any random variation.
Because the excess of C14-carbon disappeared as quickly as bomb curve shows can also be concluded that anthropogenic emissions can not be the only noteworthy reason that atmospheric carbon dioxide levels have increased (it would require that the relaxation process is so slow that Bern model prescribes). The basic premise of the Bern model's construction is destroyed then the bomb curve. The designers failed to take into account all factors of significance for carbon dioxide exchange. Moreover, it has been over-emphasized factors that appear to be of minor importance; bomb curve shows no tendency to the marked flerfasighet characterizing Bern model blue curve and Almgren ascribe the transition from rapid exchange with surface water to slower exchange with the deep ocean.
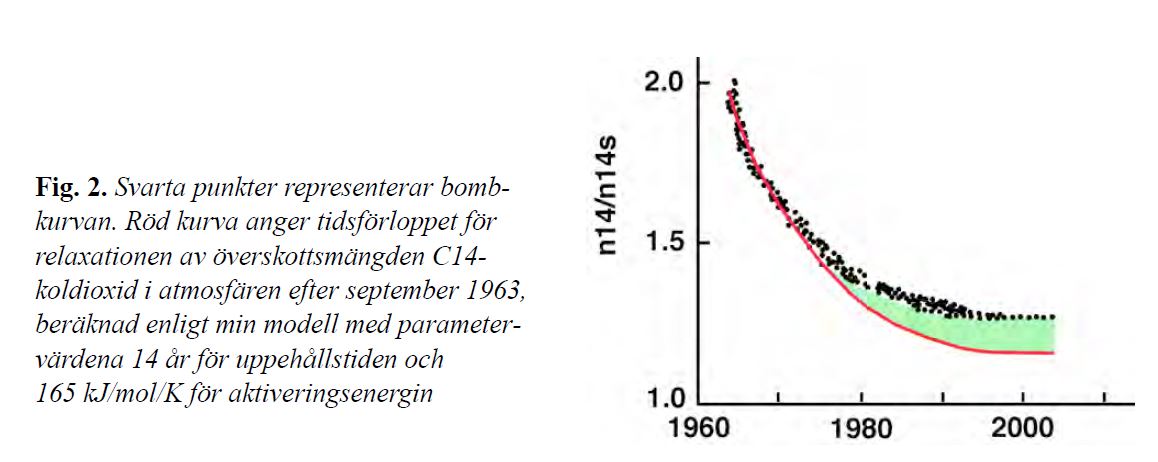
Is there any better explanation for bomb curve appearance? My answer is yes, based on analyzes of the same basic concept as the 1950s climatological pioneers started from when the shortage of computers did not have the opportunity to review details but focused on the main features: The kinetics of atmospheric excess CO2 elimination must be mainly determined by the exchange with the hydrosphere which constitute the dominant sink. In Paper 3 , I have shown that a simple air / ocean model adequately describes both Keeling curve term trend as the temperature dependence of the El Niño fluctuations. Red curve in Figure 2 shows what this simple model (hereafter referred to as "my model") prescribes concerning relaxation of bomb tests excess of atmospheric C14 emissions.
The informational bomb curve Figure 2
My model provides an acceptable description of the elimination of the first half of the 1963 surplus of C14, but stipulates that the amount of C14 in 2004 should have ended 16% higher than the 1950 year standard value rather than the 27% higher as bomb curve indicates. Either model shows about 10% error at the end of the curve, or the amount of C14 in the atmosphere increased about 10% by supplements that are not directly related to the bomb test pulse.
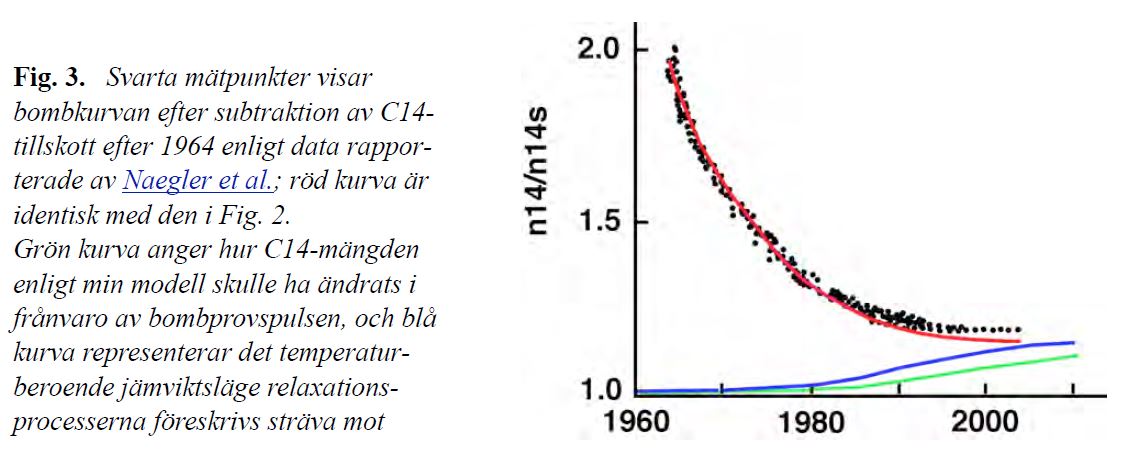
Crucial support for the latter option gives the inventory of bomb-C14 as kolcykelforskare at Heidelberg University conducted on the basis of the large number of ΔC14-series using an advanced model that includes the biosphere and divide the atmosphere into 22 zones ( Naegler et al. ) . was found among other things that the amount of C14 in the air during the period 1964-2005 at length increased by 8% of the total amount bomb tests prior to complete.This was explained as an effect of industrial emissions of C14 (and should also include any C14 contribution from nuclear weapons testing by Test Ban Treaty).
Same industrial C14 supplements must then be assumed to contribute to bomb the curve, ie.should be subtracted from bombkurvans readings to give a picture of how the relaxation of the actual bomb test pulse progressed. Figure 3 shows that such correction of the bomb curve virtually eliminate the previous discrepancy (highlighted green zone in Figure 2) against my model.Remaining differences are so small that they should fall within the limits of error for the data measurement points and model calculations are based on.
The informational bomb curve Figure 3
Of Naegler et al.'s Results also show that the hydrosphere and biosphere in 2005 together made up 84% of the 1964 surplus of atmospheric C14. This means that the relaxation of the excess proceeded at such a pace that only 16% of it may have been left in the air in 2005. Measured on the uptake of C14-surplus thus has this disappeared from the air in excellent conformity with the final value 1.16 for the red curve in Figure 2-3.
The gist of all this is that bomb curve gives fully reliable and extractable information about the disposal of the atmospheric C14 surplus bomb tests gave rise to. My model provides a good description of the relaxation process, and is consistent with what Heidelbergforskarna concluded with far more advanced models, and based on a far more extensive observational material. In both cases, the analyses clearly show that 80% of the bomb test pulse transmitted from the air to the outdoors in general within less than 30 years, in stark contrast to the IPCC's assertion that it takes several centuries to dispose of 80% of the excess pulse of atmospheric carbon dioxide. Whether bomb curve or Heidelbergforskarnas C14 inventories in 2006 [ Naegler et al. ] or 2010 [Levin et al. ] not support the Bern model's instruction to approximately 40% of the bomb test pulse is still present in the air.
The corrected bomb curve in Figure 3 is monophasic, although not strictly exponential. It is described so well by my model that I certainly can stand by my previous conclusion that the removal of atmospheric carbon dioxide excess is overwhelmingly controlled by the air's carbon dioxide content in accordance with the law of mass action (the basis for the model's kinetic differential equations) and the residence time of 14 years. There is absolutely no indication that the slow processes in the oceans have a significant effect on the relaxation process, in any case, no effects of the kind the IPCC Bern model prescribes.
Will this that my model provides a simple explanation for the amount of airborne C14-carbon dioxide rose slightly even before the nuclear test. The period 1850-1950 was characterized by global warming, and heating provides thermal degassing. If one assumes the IPCC's assumption that the carbon cycle was in equilibrium in pre-industrial times (before 1850), so provide my model that the amount of C14 in the air then it should have been 5% lower than the standard year 1950.Because global warming has progressed in the second half of the 1900s, one can expect that the amount of C14 in the air would have continued to increase, although there have been no nuclear weapons tests. Green curve in Figure 3 shows how the increase would have looked like in my model.
So the rising C14 amounts before the bomb tests are best explained as a temperature effect of equilibrium positions, the same effect as under Paper 3 contributed to about half of the observed increase in atmospheric total carbon dioxide levels during the industrial period. That bomb curve for such reasons, in my model should tend towards n14/n14s-värden significantly higher than 1 has been pointed out by Pehr Björnbom with multiple and illuminated by the red curve in Figure 3.
Blue curve in Figure 3 indicates my model regulation on how the equilibrium position of the air C14 amount varied after 1960, ie. shows the temperature dependence of the final value that relaxation of C14-surplus pursued. Bomb The curve was in 2004 very close to this year's equilibrium value.My previous conclusion that the bomb curve gives an observed image of more than 95% of the relaxation process is itself therefore remains. To the extent that the elimination of atmospheric carbon dioxide excess is controlled by the process with relaxation times on the order of hundreds or thousands of years, then such slow processes only expected to affect the removal of the last few percent of example. emissions of fossil carbon dioxide.
Almgren has termed bomb curve as a lingering myth . I hope the bomb curve remains tenacious in debate, for it is definitely not a myth. Instead, it represents one of several basic observations provide evidence that the Bern model is inconsistent with the present experimental results concerning the disposal of excess atmospheric carbon dioxide. This has been pointed out by many authors before me and is fully in line with the position taken NIPCC.
The IPCC continues to cling to his preconceived notions that anthropogenic emissions of fossil carbon dioxide is the dominant cause of the atmospheric carbon dioxide concentration increase. Therefore, one is forced to continue to ignore the bomb curve and many studies showing that carbon dioxide retention is in the order of 10 years rather than 100 years, evidence unchanged from the strong temperature effects on the Keeling curve produced by El Niño fluctuations. This ignorance (which leads to neglect of thermal degassing) is, according to the argument in Paper 3 reason why the IPCC arrives at a CO2 budget where about one third of the anthropogenic carbon emissions disappeared without a trace to an unidentified "missing sink"; they renamed it to "residual terrestrial sink".
My model does not ignore the above-mentioned observations, but relies on them and explains them with strict kinetic link that leads to a balanced CO2 budget. The bomb curve still represents one of the strongest evidence that the IPCC provides a grossly exaggerated picture of how long the anthropogenic carbon dioxide emissions will remain in the air. Many of the arguments I stated in my earliest posts were misguided because they were related to an incorrect translation of ΔC14values. Yet had the fundamental conclusions I then drew much stronger support of the experimental data than the kolcykelbild IPCC paints. After the correct translation of the C14 values ​​according to Almgren's instructions conclusions can now be drawn on the basis of entirely sound data and arguments.

Wednesday, September 4, 2013

Biochemistry professor explains why the lifetime of CO2 in the atmosphere is only 14 years

Dr. Gösta Pettersson, Professor Emeritus of biochemistry and specialist in reaction kinetics, further explains why the computer model ["The Bern Model'] used by the IPCC to predict CO2 lifetimes of over 100 years is highly flawed and is strongly contradicted by observations from both atomic bomb testing and atmospheric levels of CO2 [the Keeling Curve]. 

Dr. Pettersson finds "the IPCC extremely (about tenfold) underestimated both the speed of the final location for the natural disposal of atmospheric carbon dioxide" by natural sinks. The assumption of the "IPCC Bern model that 22% of atmospheric carbon dioxide surplus can never be removed from the air seems quite amateurish considering that the present empirical observations (Fig. 1) confirms that at least 95% of the bomb test excess of 14C-carbon dioxide has been removed "already" after 50 years." 

"Paper 2 shows the bomb curve estimated value of the CO2 relaxation time (14 years) and concludes that the IPCC-backed climate models overestimate future anthropogenic contribution to atmospheric carbon dioxide concentration by a factor of 3-15 depending on the emissions scenario and the considered time period. This means that emissions of fossil carbon dioxide can not be expected to lead to a politically unacceptable global warming (two degree target), even according to the IPCC's worst case discharge scenarios, the longest present experimentally determined estimate of the relaxation time, and the alarmist climate models' own estimates of the greenhouse effect strength."

"The IPCC has been scientifically untenable reasons turned a blind eye to the present very extensive and entirely consistent experimental results concerning CO2 relaxation and preferred to base their assessments on a mathematical model that lacks empirical support, and even contrary to the observations made."


Bomb Test curve - nature's simple answers to complex relationships


156 Comments  Guest Post by Gösta Pettersson  [Google translation from Swedish + light editing]

Figure 1 bomb test curve
Figure 1.   Time course (black data points) for the relaxation of the excess of 14C-carbon dioxide as the above-ground nuclear tests showed, indicating a much shorter atmospheric lifetime of CO2 than assumed by the IPCC [blue line of the Bern Model].
Peter Stilbs and Pehr Björnbom have in TCS messages noticed my book False alarm and my conclusion that bomb test curve (figure above) falsifies the underpinning for climate models projections of future carbon dioxide levels and global temperatures. The inserts gave rise to a rather intense debate. Many commentators stressed the complexity of the carbon cycle, and hinted that I underestimated this by basing my conclusion solely on bomb test curve. "There's more to it" was one comment. "Gösta makes it too easy for themselves," was another.
I can understand the doubt. Kolcykelproblematiken a whole is very complex. Hydrosphere uptake of carbon dioxide is dependent on wind, temperature, rainfall, etc. according to little-understood relationship (eg. Revelle effect). The spread of the absorbed carbon dioxide from the surface waters to deeper water layers can be made according to several different mechanisms and span time scales from the second level to centuries. The yield of carbon dioxide between the air and the biosphere is likewise by a variety of processes of widely different time scales. Are you interested in what happens to the carbon value after it has been transferred from the air to the outdoors in general, then you can be served by kolcykelmodeller who, like Bern model looking observe and describe the effects of the present heterogeneities and other mechanistic complications in the total carbon dioxide exchange .
The situation is completely different if you have the limited objective of ascertaining the extent to which anthropogenic carbon dioxide emissions contribute to increasing atmospheric carbon dioxide concentration (and hence an increase in the greenhouse effect). Then you only need to know the kinetics of an atmospheric CO2 relaxation (equilibration), ie. knowing how quickly and to what extent an excess of carbon dioxide removed from the air. Bomb Test curve provides just such information to more than 95% of the relaxation of the excess pulse of 14C-labeled carbon dioxide as the above-ground nuclear tests resulted. The graph shows the net result of the disparate events that helped to remove the anthropogenic input excess C14 emissions by transferring it from the air to the outdoors in general. The curve represents the empirically determined response that nature has given us the carbon cycle all complex relationships.
C14 carbon is carbon dioxide. The relaxation processes which reduced the excess air of C14 emissions are identical to those that continuously reduces such excess carbon dioxide as the atmosphere is supplied by human activities such as the use of fossil fuels, land use change and cement production. Because of the kinetic kolisotopeffekternas small size can be also as a good approximation to assume that C14 carbon disposed with the same speed and in the same degree as carbon dioxide with different isotope composition.
These simple facts provide bomb test curve an outstanding informative weight. It tells us that the air at the end of X should contain about 91% of the anthropogenic carbon dioxide emissions in the year X-1, approximately 85% of emissions in the year X-2, and so on back in time. Based on available historical data for the amount of emissions since the industrial revolution, one can on the basis of the appearance of the bomb curve calculate how much human activities contributed to increasing atmospheric carbon dioxide concentration up to an arbitrary subsequent years. Likewise, the curve us exactly the information we need to analogously calculate the likely future emissions of fossil carbon dioxide will contribute to increasing atmospheric carbon dioxide future.
So what these climatological fundamental calculations is concerned, it is not me who makes it too easy for me, but others that make it too difficult for them. One does not know why the bomb test curve looks the way it does. Suffice it to say how it looks and to base their calculations on this look. One need not resort to models that consider what happens to the carbon dioxide after it entered into the biosphere and hydrosphere. It is a mathematical model that provides an acceptable description of the bomb test curve, nature's answer to the critical question of how quickly and to what extent the excess carbon dioxide removed from the atmosphere.
And in that respect, it is clear from Figure 1 that the [IPCC] Bern model triphasic description of curve (blue graph) is substandard and unfit for the calculation. Statistical regression analysis shows that bomb test curve is best described as enfasiskt exponential (red graph), with a relaxation time in many consistent experimental studies found to be in the order of ten years rather than the hundred years that the IPCC states on the basis of the Bern model. The bomb curve appearance gives us ample information to enable us to conclude that the IPCC extremely severely (about tenfold) underestimated both the speed of the final location for the natural disposal of atmospheric carbon dioxide excess.
Why bomb test curve looks like it does is another question of mechanistic nature.The answer may, however, also a fair indication of the kinetic analysis of the curve. The IPCC states that the relaxation of atmospheric carbon dioxide excess is highly controlled by carbon dioxide slow transport from the ocean surface to the deep sea. I have commented on this by saying that I only need to glance at the bomb test curve to realize that the IPCC's claim is incorrect.
It is needed is not more than a glance to see that bomb test curve goes towards a final value which is close to zero and certainly less than 0:05. The information is all I need to be able to classify the kinetics disposal of excess air of carbon dioxide as a virtually irreversible process. Thus, the process must essentially have the same kinetic behavior as a completely irreversible process, ie. be more than 95% controlled by the air concentration of carbon dioxide according to law of mass action. There is not even a theoretical possibility that the slow processes in the ocean can influence more than, at most, 5% of the relaxation process.
This insight is likely only to specialists with good knowledge of the relaxation kinetics theory and practice. But for non-specialists, there is an easy alternative way to arrive at the same conclusion, since bomb test curve is found to follow an exponential progression.
Exponential decay of an excess concentration may be namely for purely mathematical reasons, then, and only then, the corresponding reaction rate is proportional to the concentration variable in question. The observation that bomb test excess of 14C-carbon dioxide removal in an exponential progression tells us, then, that the removal occurred at a speed which was proportional to the air concentration of the C14-labeled carbon dioxide. The observed part (95%) of the relaxation process has therefore been guided by the air content of C14-carbon dioxide, in accordance with the law of mass action applied to a completely irreversible process. Slow processes in the ocean can at most affect the removal of the remaining 5% of the excess carbon dioxide, ie. the final stage of the relaxation process that we have not yet had the opportunity to observe.
The conclusion that airborne carbon surplus raised virtually irreversible by natural sinks, one might also benefit from the IPCC, the data presented for the equilibrium distribution of carbon between the atmosphere (1.5%), and nature in general (98.5%). Bomb Sample curve only confirms that nature behaves as it theoretically might expect in such a case. In addition to consolidating the Uppsjön of published experimental measurements of atmospheric carbon dioxide retention (which invariably fall within the range 2-14 years) in principle is fully acceptable as estimates of carbon dioxide relaxation. IPCC lacks any any theoretical justification for its idiot explanation of climatic pioneers Bolin, Revelle, Suess et al. the ground that they measured the wrong kind of retention, one that is not relevant to the relaxation of excess carbon dioxide.
A scientific presentation of my kinetic analysis of the bomb test curve can be found in Paper 1 on the English-language website False alarm . There is also the scientific arguments showing that Bern model is in conflict with the present empirical data. From a theoretical aspect, Bern model grossest error prescribing the equilibrium distribution of carbon between air and nature in general is 22%: 78% ie. that the model makes natural uptake of carbon dioxide around 15 times reversiblare than what we know it is under the IPCC kolcykeldata.
Bern model's designers actually suggest that preindustrial atmospheric equilibrium concentration of carbon dioxide was about 5000 ppm, but apparently lack sufficient kinetic skills to realize that their model has this absurd consequence. Neither have the skills enough to realize that the reaction system equilibrium constants are fixed by the thermodynamic relations and not with a custom size in the construction of a kinetic model. Bern model of the IPCC accepted and utilized instruction to 22% of atmospheric carbon dioxide surplus can never be removed from the air seems quite amateurish considering that the present empirical observations (Fig. 1) confirms that at least 95% of the bomb test excess of 14C-carbon dioxide has been removed "already" after 50 years.
Paper 2 on the above website shows that in order it from the bomb cvurve estimated value of the relaxation time (14 years) concludes that the IPCC-backed climate models overestimate future anthropogenic contribution to atmospheric carbon dioxide concentration by a factor of 3-15 depending on the emissions scenario and the considered time period. This means that emissions of fossil carbon dioxide can not be expected to lead to a politically unacceptable global warming (two degree target), even according to the IPCC's worst case discharge scenarios, the longest present experimentally determined estimate of the relaxation time, and the alarmist climate models' own estimates of the greenhouse effect strength.
The IPCC has been scientifically untenable reasons turned a blind eye to the present very extensive and entirely consistent experimental results concerning CO2 relaxation and preferred to base their assessments on a mathematical model that lacks empirical support, and even contrary to the observations made. How can that be? My own answer to this question, I came to when I found that the corresponding section in the IPCC reports had Bern model two constructors as head writer (Siegenthaler in the first report and Joos in the subsequent three reports). The probability should be zero to those IPCC experts would realize his model shortcomings and persuade annul it. Something I with different slant cover in Chapter 15:5 - 6) of my book False alarm.

Friday, August 9, 2013

Paper finds lifetime of CO2 in atmosphere is only 5.4 years

A paper presented at the SEVENTEENTH SYMPOSIUM ON THERMOPHYSICAL PROPERTIES finds that the lifetime and residence time of man-made CO2 in the atmosphere are only about 5.4 years, far less than assumed by the IPCC. The paper corroborates prior work by Salby, Humlum et al, Frölicher et al, Cho et al, Calder et al, Francey etl, Ahlbeck, Pettersson, SpencerSegalstad, and others which has demonstrated that man-made CO2 is not the primary driver of atmospheric CO2.

Fossil Fuel Emissions and Fossil CO2 in the Atmosphere

Luciano Lepori S, Gian Carlo Bussolino, Andrea Spanedda and Enrico Matteoli C
IPCF-CNR, Pisa, Italy

The comparison of fossil fuel emissions (6.4 GtC/yr) with the growth rate of atmospheric CO2 (3.2 GtC/yr) suggests that about half of the anthropogenic CO2 has not remained in the atmosphere: it has dissolved in the ocean or has been taken up by the land. The isotope ratio C13/C12 of atmospheric CO2 has been measured over the last decades using mass spectrometry. From these data the fraction of fossil CO2 in atmospheric CO2 is straightforwardly calculated: 5.9 %(1981) and 8.5 %(2002). These results indicate that the amount of past fossil fuel and biogenic CO2 remaining in the atmosphere, though increasing with anthropogenic emissions, did not exceed in 2002 66 GtC, corresponding to a concentration of 31 ppm, that is 3 times less than the CO2 increase (88 ppm, 24 %) which occurred in the last century. This low concentration (31 ppm) of anthropogenic CO2 in the atmosphere is consistent with a lifetime of t(1/2) = 5.4 years, that is the most reliable value among other in the range 2-13 years, obtained with different measurements and methods. Contrary to the above findings on the concentration of fossil CO2 and its residence time in the atmosphere, in the Fourth Assessment Report of the Intergovernmental Panel on Climate Change it is stated that almost 45 % of anthropogenic emissions, corresponding to 88 ppm or 24 % of the total CO2, have remained in the atmosphere with a mean lifetime of t(1/2) = 30.5 years. On these assumptions are based both the theory of Anthropogenic Global Warming and the climate models.

Related: New paper finds ocean along Baja California coast is a net source of CO2 to the atmosphere

H/T to The Stockholm Initiative site for finding this abstract [Google translation from Swedish]:


David Coe - another kolcykelkritiker


This summer, there have been numerous posts and lively discussion of the carbon cycle.Earlier critics: Jaworowski, Beck, Sail City, Humlum and Kouwenberg have questioned the atmospheric carbon dioxide concentration and its variation before Manua Loa measurements began in the 1950s. A brief description of this on science page ( link)
Last summer was extended discussion in that Gösta Pettersson book "False Alarm" was published. Among other Pehr wrote a post about this in May ( link ). There is now a question of a much broader criticism of the IPCC's carbon cycle is quantitatively incorrect. An appropriate introduction to this newer criticism is to consider this chart.CO2 o ENSO
The lower blue bars show the atmospheric CO 2 -upptag/år ago Manua Loa measurements started. The red-tagged curve is CO 2 -tillförseln/år measured in Gtons carbon. The difference between these rather precise curves must represent the other CO 2 uptake, ie, in the oceans and the biosphere, ie the green field. On the x-axis has ENSO outbreak, ie emerging warm ocean currents, marked with black arrows. It is obvious that the strong variations in atmospheric absorption - high blue bars - correlates strongly with these ENSO outbreak. There is, however, no correlation with the fossil injections.
I highly recommend anyone interested to read chapter 7-9 in the book that is freely available ( link ). Gösta Pettersson shows that AGW supporters provided that increasing the concentration of CO 2 in the atmosphere solely due to the anthropogenic addition, and this causes errors in the results. It has used the Bern model with three widely different decay times for the natural processes that regulate the addition of CO 2 . Since the longest time parameter is more than a hundred years, so the forecasts landed in the often-quoted long lifetimes of carbon dioxide at 100 and even 500 years. Pettersson describes how this differs from the results that the decay of the 14 C isotope after 50's nuclear tests have shown."Bomb curve" decays much faster, and with only one decay time. The difference between Berne and Bomb curve led here for a detailed discussion, and it became almost an overdose of red and white beads. I do not think a consensus was reached, which iofs is very rare on this forum. However shows Göstas making very convincing that the IPCC's carbon cycle has serious quantitative problem, which in turn is disastrous for the validity of the "scenarios" which is based on a strongly increasing CO 2 content in the future.
Discussion of Göstas preparation was replaced in turn by some messages by Pehrson about Salby and his differential equation for the relationship between the CO 2 -content and temperature. The relationship between Göstas and Salbys criticism he is the right person to explain, so I will instead conclude by mentioning another kolcykelkritiker: David Coe . He observations are collected in four manuscripts of which so far published two at Andrew Montfords blog Bishop Hill ( link ). David deals with the two most recent IPCC reports are making when it comes to the carbon cycle and what is controlled atmospheric levels of CO 2 .Like other critics, he finds inconsistencies which shows that there are major flaws in the IPCC's theory that carbon dioxide is only determined by the anthropogenic contribution. I would have quoted one or two of his figures, but have not managed to copy them. Coe discusses include the concentration measurements of the stable 13 C isotope made. The usual description has been confirm that anthropogenic origin. Coe shows that this pioneer Keeling's 13 δ measurements indicated that there were problems with the evidence. Some time ago I referred Leporis conference paper on a new detailed analysis ( link ) which clearly showed that 13 δ values ​​rather showed that the CO 2 -increase was not predominantly derived from humans. Neither Coe, Salbys or Leporis works have been published in any peer-reviewed journal. Experience shows that this may be because they either  have no weakness that I did not realize. Or it may also be because they are so accurate that they represent a serious blow to climate science theses why the elite of tidkriftsredaktörer not want or dare to publish them.

Wednesday, August 7, 2013

New paper finds ocean along Baja California coast is a net source of CO2 to the atmosphere

A new paper published in the Journal of Geophysical Research Oceans finds the near-shore region in Baja California (Mexico) "was a weak annual net source of CO2 to the atmosphere." The paper joins at least 3 other peer-reviewed publications based on careful in-situ ocean measurements finding the oceans may act as a source rather than a sink for CO2, calling into question the belief that man is entirely responsible for the increase of CO2 levels. Prior work by Salby, Humlum et al, Frölicher et al, Cho et al, Calder et al, Francey et al, Ahlbeck, Pettersson, and others have demonstrated that man-made CO2 is not the driver of atmospheric CO2.

Air-sea CO2 fluxes in the near-shore and intertidal zones influenced by the California Current

Janet J. Reimer 1,2, Rodrigo Vargas 3,*,Stephen V. Smith 4, Ruben Lara-Lara 2,Gilberto Gaxiola-Castro 2, J. Martin Hernandez-Ayon 5, Angel Castro 6, Martin Escoto-Rodriguez 7, Juan Martínez-Osuna 2

Abstract: The study of air-sea CO2 fluxes (FCO2) in the coastal region is needed to better understand the processes which influence the direction and magnitude of FCO2 and to constrain the global carbon budget. We implemented a one-year (January through December, 2009) paired study to measure FCO2 in the intertidal zone (the coastline to 1.6 km offshore) and the near-shore (~3 km offshore) off the north-western coast of Baja California (Mexico); a region influenced by year-round upwelling. FCO2 was determined in the intertidal zone via eddy covariance; while in the near-shore using mooring buoy sensors then calculated with the bulk method. The near-shore region was a weak annual net source of CO2 to the atmosphere (0.043 mol CO2 m-2 y-1); where 91% of the outgassed FCO2 was contributed during the upwelling season. SST and ΔpCO2(from upwelling) showed the strongest relationship with FCO2 in the near-shore suggesting the importance of meso-scale processes (upwelling). FCO2 in the intertidal zone were up to four orders of magnitude higher than FCO2 in the near-shore. Wind speed showed the strongest relationship with FCO2 in the intertidal zone suggesting the relevance of micro-scale processes. Results show that there are substantial spatial and temporal differences in FCO2 between the near-shore and intertidal zone; likely a result of spatial differences. We suggest that detailed spatial and temporal measurements are needed across the coastal oceans and continental margins to better understand the mechanisms which control FCO2, as well as reduce uncertainties and constrain regional and global ocean carbon balances.

Monday, July 1, 2013

Swedish scientist replicates Dr. Murry Salby's work, finding man-made CO2 does not drive climate change

Swedish climate scientist Pehr Björnbom has recently replicated the work of Dr. Murry Salby, finding that temperature, not man-made CO2, drives CO2 concentration in the atmosphere. Dr. Björnbom confirms Salby's hypothesis that the rate of change in carbon dioxide concentration in the air follows an equation that only depends on temperature change, detailed in his report Reconstruction of Murry Salby's theory that carbon dioxide increase is temperature driven [Google translation].

Dr. Björnbom discusses his findings in this post from The Stockholm Initiative [Google translation + light editing]:

Murry Salby, climate science innovator who challenges established views


Murry Salby is a highly qualified and well-respected professor, academic teacher, and climate scientist. He has a series of innovative talks challenging the leading circles representing the IPCC sanctioned culture of consensus in climate science. He presents startling research that fundamentally questions the established views of the IPCC consensus. An important hypothesis that he advances is that the atmospheric CO2 rate of change is a function of only the global temperature changes and that this may explain the increase in carbon dioxide from pre-industrial times. This result was I able to reproduce, in a report given here.


One of the big talking points in climate science circles is interest in Murry Salby's lecture in Hamburg recently:
It is in this lecture he presents the hypothesis that the rate of change in carbon dioxide concentration in the air follows an equation that only depends on temperature change . There is enough information in the preferred order to be able to reconstruct Murry Salby's theory in detail, as I have done in the report Reconstruction of Murry Salby's theory that carbon dioxide increase is temperature driven . My reconstruction can be summarized in the following figure where the projected path of carbon dioxide compared with the observed from Mauna Loa since 1959 and before that carbon dioxide levels from an ice core.
Figure 1
The correspondence between the calculated and observed values ​​is excellent if not perfect. It should be noted that Murry Salby made ​​a much more detailed analysis than me with a thorough discussion.
The Murry Salbys theory agrees well with the observed data is of course no guarantee that the theory is also consistent with reality. But this shows that the arguments given in the IPCC reports are not as solid as is often claimed. I have considered these arguments in a previous blog post Is the IPCC argument for carbon dioxide increase due to human emissions sustainable? . There are other theories that give similar results as in the figure above, such as that of Dr. Gosta Pettersson.
What my reconstruction, however, quite clearly shows is that Murry Salby's reconstruction results are reliable. Murry Salby is on firm ground when he says that his hypothesis agrees with observations of how carbon dioxide levels have increased since 1850.
This is not the impression you get when you read the title of a blog post by a Swedish professor of climate blog UI, by a layman in climate science, as he is a specialist in artificial intelligence: "Salbys strained relationship with the truth." But reviews the blog post closer you get to say that the professor in question throw stones in glass houses. None of the professor's points of attack on Salbys lectures in Hamburg audit Salby's analysis. One, on a published map , I have included in annotating # 30 in last week's blog post . The second point of attack argues that Professor Murry Salby's criticism of climate models are inaccurate. But, unfortunately for the professor, the same day he published his blog post  so it came very known German climate scientist Hans von Storch with a similar criticism as that of Dr. Salby.
Murry Salby is Professor at the Department of Environment and Geography - Environmental Science from Macquarie University in Australia. He has a formidable list of publications , especially the part related books:
Books
Salby, M., 1992: The Atmosphere. In Climate Systems Modeling, K. Trenberth Ed. Sponsored Jointly by UCAR and the Electric Power Research Institute (EPRI), Cambridge University Press, 53-115.
Salby, M., 1996: Fundamentals of Atmospheric Physics. International Geophysics Series, Academic Press, pp. 628. 2nd Printing (2005)
Salby, M., 2002: Planetary Waves. in Encyclopedia of Physical Science and Technology, P. Crutzen Ed. Academic Press, 12, 357-371.
Salby, M., 2003: Fundamental Forces and Governing Equations, Chapter 2, in Handbook of Weather, Water, and Climate: Dynamics, Cliimate, Physical Meteorology, Weather Systems, and Measurements, T. Potter and B. Colman, eds. (Wiley-Interscience, Hoboken NJ, 2003), 7-20.
Salby, M., 2009: Fundamentals of Atmospheric Physics. International Geophysics Series, Academic Press, 2nd Edition (In preparation)
The latter book is now published, the list is not fully updated. I myself have read the textbook at postgraduate level Fundamentals of Atmospheric Physics in 1996 which is very respectable. Murry Salby appears to be very knowledgeable and competent.
From the beginning, in 2011, there was only one audio output (a podcast) from Murry Salby's lecture. But his thinking was so startling that it led to publicity. Judith Curry wrote a blog where she discusses a news article in the Herald Sun Andrew Bolt about this lecture.
Judith Curry begins her blog post:
I just finished listening to Murry Salbys podcast on climate change and carbon. Wow.
She then takes up the published summary and enters Andrew Bolt's article about the lecture. Her as usual pithy concluding remark is:
JC comments:  If Salby’s analysis holds up, this could revolutionize AGW science.  Salby and I were both at the University of Colorado-Boulder in the 1990′s, but I don’t know him well personally.  He is the author of a popular introductory graduate text Fundamentals of Atmospheric Physics.  He is an excellent lecturer and teacher, which comes across in his podcast.  He has the reputation of a thorough and careful researcher.  While all this is frustratingly preliminary without publication, slides, etc., it is sufficiently important that we should start talking about these issues.  I’ll close with this text from Bolt’s article: 
He said he had an “involuntary gag reflex” whenever someone said the “science was settled”. 
“Anyone who thinks the science of this complex thing is settled is in Fantasia.” 
Judith Curry obviously got a lot of criticism on her blog for her acclaim of Murry Salby's lecture, which she took up in her subsequent blog posts. Here she responds to a comment:
JC
Can you please provide for "the record" what you * especially * found that is "sufficiently important" in this, "we should start talking about" it?
Thanks in advance.
JC comment:  The fact that Murry Salby is a former colleague of mine and definitely a scientific straight shooter initially caught my attention on this.  If correct, his hypothesis has far reaching implications on both AGW science and policy.  His presentation was extremely lucid and well done (even without availability of the plots.)   The topic he addresses was one that I thought was squarely in the “what we know with confidence” category; this presentation synthesizes and opens up issues at the knowledge frontier on this topic.   Fascinating stuff.  So if you are irritated that “deniers” will use this talk (and the fact that I featured it on my blog) as ammo in their war against CO2 stabilization policy, well that is too bad.  I for one am not going to let your irritation get in the way of having a good discussion here where we all stand to learn something.
This is well said by Judith Curry, as probably everyone who has a sincere interest in climate can agree with.

References