Showing posts sorted by date for query trenberth travesty. Sort by relevance Show all posts

Wednesday, November 19, 2014

Updated list of 66 excuses for the 18-26 year 'pause' in global warming

"If you can't explain the 'pause', you can't explain the cause"

RSS satellite data showing the 18+ year 'pause' of global warming

An updated list of at least 29 32 36 38 39 41 51 52 63 64 65 66 excuses for the 18-26 year statistically significant 'pause' in global warming, including recent scientific papers, media quotes, blogs, and related debunkings: 

1) Low solar activity 

2) Oceans ate the global warming [debunked] [debunked] [debunked]

3) Chinese coal use [debunked]

4) Montreal Protocol 

5) What ‘pause’? [debunked] [debunked] [debunked] [debunked]

6) Volcanic aerosols [debunked]

7) Stratospheric Water Vapor 

8) Faster Pacific trade winds [debunked]

9) Stadium Waves

10) ‘Coincidence!’

11) Pine aerosols

12) It's "not so unusual" and "no more than natural variability"

13) "Scientists looking at the wrong 'lousy' data" http://

14) Cold nights getting colder in Northern Hemisphere

15) We forgot to cherry-pick models in tune with natural variability [debunked]

16) Negative phase of Interdecadal Pacific Oscillation

17) AMOC ocean oscillation

18) "Global brightening" has stopped

19) "Ahistorical media"

20) "It's the hottest decade ever" Decadal averages used to hide the 'pause' [debunked]

21) Few El Ninos since 1999

22) Temperature variations fall "roughly in the middle of the AR4 model results"

23) "Not scientifically relevant"

24) The wrong type of El Ninos

25) Slower trade winds [debunked]

26) The climate is less sensitive to CO2 than previously thought [see also]

27) PDO and AMO natural cycles and here

28) ENSO


33) NAO & PDO


35) Scientists forgot "to look at our models and observations and ask questions"

36) The models really do explain the "pause" [debunked] [debunked] [debunked]


37) As soon as the sun, the weather and volcanoes – all natural factors – allow, the world will start warming again. Who knew?

38) Trenberth's "missing heat" is hiding in the Atlantic, not Pacific as Trenberth claimed

[debunked] [Dr. Curry's take] [Author: “Every week there’s a new explanation of the hiatus”]

39) "Slowdown" due to "a delayed rebound effect from 1991 Mount Pinatubo aerosols and deep prolonged solar minimum"

[Before this new paper, anthropogenic aerosols were thought to cool the climate or to have minimal effects on climate, but as of now, they "surprisingly warm" the climate] 

42) Trenberth's 'missing heat' really is missing and is not "supported by the data itself" in the "real ocean":


"it is not clear to me, actually, that an accelerated warming of some...layer of the ocean ... is robustly supported by the data itself. Until we clear up whether there has been some kind of accelerated warming at depth in the real ocean, I think these results serve as interesting hypotheses about why the rate of surface warming has slowed-down, but we still lack a definitive answer on this topic." [Josh Willis]

43) Ocean Variability:

"After some intense work by of the community, there is general agreement that the main driver [of climate the "pause"] is ocean variability. That's actually quite impressive progress." 

44) The data showing the missing heat going into the oceans is robust and not robust:

" I think the findings that the heat is going into the Atlantic and Southern Ocean’s is probably pretty robust. However, I will defer to people like Josh Willis who know the data better than I do."-Andrew Dessler. Debunked by Josh Willis, who Dessler says "knows the data better than I do," says in the very same NYT article that "it is not clear to me, actually, that an accelerated warming of some...layer of the ocean ... is robustly supported by the data itself" - Josh Willis

45) We don't have a theory that fits all of the data:

"Ultimately, the challenge is to come up with the parsimonious theory [of the 'pause'] that fits all of the data" [Andrew Dessler]

46) We don't have enough data of natural climate cycles lasting 60-70 years to determine if the "pause" is due to such natural cycles:

"If the cycle has a period of 60-70 years, that means we have one or two cycles of observations. And I don’t think you can much about a cycle with just 1-2 cycles: e.g., what the actual period of the variability is, how regular it is, etc. You really need dozens of cycles to determine what the actual underlying variability looks like. In fact, I don’t think we even know if it IS a cycle." [Andrew Dessler]

47) Could be pure internal [natural] variability or increased CO2 or both

"this brings up what to me is the real question: how much of the hiatus is pure internal variability and how much is a forced response (from loading the atmosphere with carbon). This paper seems to implicitly take the position that it’s purely internal variability, which I’m not sure is true and might lead to a very different interpretation of the data and estimate of the future." [Andrew Dessler]

48) Its either in the Atlantic or Pacific, but definitely not a statistical fluke:


It's the Atlantic, not Pacific, and "the hiatus in the warming...should not be dismissed as a statistical fluke" [John Michael Wallace]

49) The other papers with excuses for the "pause" are not "science done right":

" If the science is done right, the calculated uncertainty takes account of this background variation. But none of these papers, Tung, or Trenberth, does that. Overlain on top of this natural behavior is the small, and often shaky, observing systems, both atmosphere and ocean where the shifting places and times and technologies must also produce a change even if none actually occurred. The “hiatus” is likely real, but so what? The fuss is mainly about normal behavior of the climate system." [Carl Wunsch]

50) The observational data we have is inadequate, but we ignore uncertainty to publish anyway:

"The central problem of climate science is to ask what you do and say when your data are, by almost any standard, inadequate? If I spend three years analyzing my data, and the only defensible inference is that “the data are inadequate to answer the question,” how do you publish? How do you get your grant renewed? A common answer is to distort the calculation of the uncertainty, or ignore it all together, and proclaim an exciting story that the New York Times will pick up...How many such stories have been withdrawn years later when enough adequate data became available?"

51) If our models could time-travel back in time, “we could have forecast ‘the pause’ – if we had the tools of the future back then” [NCAR press release]


64) Negative phase of the Interdecadal Pacific Oscillation (IPO)
which has allegedly "now stopped. The negative IPO has stopped. This is the same as saying the global warming hiatus has stopped.” -Axel Timmermann  [debunked]

65) Small volcanic eruptions [debunk - SO2 emissions should have increased warming instead]

66) There's no "pause" if you look at only at the warmest & coldest day of the year


___________________________________________


Additional related comments from climate scientists about the "pause"

1) My University screwed up the press release & didn't let me stop them from claiming my paper shows the "hiatus will last another decade or two." [Dessler]

2) "This [the 'pause'] is not an existential threat to the mainstream theory of climate." [Andrew Dessler]

3) "In a few years, as we get to understand this [the 'pause'] more, skeptics will move on (just like they dropped arguments about the hockey stick and about the surface station record) to their next reason not to believe climate science." [Andrew Dessler]


4)  "if you try really hard to mangle the data, and cherry pick very skillfully, you can make a case" for the "pause"

5) Michael Asten from Monash University’s School of Earth ­Atmosphere and Environment said that, while opinions on causes differed, the existence of the pause was settled. “Only activists dare claim the pause in global temperature does not exist,” Professor Asten said

and a roundup of climate scientists talking about no warming, from Jimbo at WUWT, and via Andrew Bolt's Herald Sun blog

Jimbo on Watts Up With That rounds up the climate scientists confessing to this lack of warming:

Dr. Phil Jones – CRU emails – 5th July, 2005 

“The scientific community would come down on me in no uncertain terms if I said the world had cooled from 1998. OK it has but it is only 7 years of data and it isn’t statistically significant….”

Dr. Phil Jones – CRU emails – 7th May, 2009

‘Bottom line: the ‘no upward trend’ has to continue for a total of 15 years before we get worried.’

Dr. Judith L. Lean – Geophysical Research Letters – 15 Aug 2009
“…This lack of overall warming is analogous to the period from 2002 to 2008 when decreasing solar irradiance also countered much of the anthropogenic warming…”

Dr. Kevin Trenberth – CRU emails – 12 Oct. 2009


“Well, I have my own article on where the heck is global warming…..The fact is that we can’t account for the lack of warming at the moment and it is a travesty that we can’t.”

Dr. Mojib Latif – Spiegel – 19th November 2009

“At present, however, the warming is taking a break,"……."There can be no argument about that.”

Dr. Jochem Marotzke – Spiegel – 19th November 2009

“It cannot be denied that this is one of the hottest issues in the scientific community.... We don’t really know why this stagnation is taking place at this point.”

Dr. Phil Jones – BBC – 13th February 2010


“I’m a scientist trying to measure temperature. If I registered that the climate has been cooling I’d say so. But it hasn’t until recently – and then barely at all. The trend is a warming trend.”

Dr. Phil Jones – BBC – 13th February 2010 

[Q] B – “Do you agree that from 1995 to the present there has been no statistically-significant global warming”

[A] “Yes, but only just”.

Prof. Shaowu Wang et al – Advances in Climate Change Research – 2010


“…The decade of 1999-2008 is still the warmest of the last 30 years, though the global temperature increment is near zero;…”

Dr. Robert K. Kaufmann – PNAS – 2nd June 2011

“…..it has been unclear why global surface temperatures did not rise between 1998 and 2008…..”

Dr. Gerald A. Meehl – Nature Climate Change – 18th September 2011 

“There have been decades, such as 2000–2009, when the observed globally averaged surface-temperature time series shows little increase or even a slightly negative trend1 (a hiatus period)….”

Met Office Blog – Dave Britton (10:48:21) – 14 October 2012 


“We agree with Mr Rose that there has been only a very small amount of warming in the 21st Century. As stated in our response, this is 0.05 degrees Celsius since 1997 equivalent to 0.03 degrees Celsius per decade.”

Dr. James Hansen – NASA GISS – 15 January 2013

“The 5-year mean global temperature has been flat for a decade, which we interpret as a combination of natural variability and a slowdown in the growth rate of the net climate forcing.”

Dr. Virginie Guemas – Nature Climate Change – 7 April 2013

“…Despite a sustained production of anthropogenic greenhouse gases, the Earth’s mean near-surface temperature paused its rise during the 2000–2010 period…”

Dr. Hans von Storch – Spiegel – 20 June 2013

“…the increase over the last 15 years was just 0.06 degrees Celsius (0.11 degrees Fahrenheit) — a value very close to zero….If things continue as they have been, in five years, at the latest, we will need to acknowledge that something is fundamentally wrong with our climate models….”

Professor Masahiro Watanabe – Geophysical Research Letters – 28 June 2013

“The weakening of k commonly found in GCMs seems to be an inevitable response of the climate system to global warming, suggesting the recovery from hiatus in coming decades.”

Professor Rowan Sutton – Independent – 22 July 2013

“Some people call it a slow-down, some call it a hiatus, some people call it a pause. The global average surface temperature has not increased substantially over the last 10 to 15 years.”

And, no, they never saw this coming:


UPDATE: Oh, did they forget to mention the planet wouldn’t actually warm for a while? Their bad: 

Scientists have long been aware that climate change would not happen at a fixed rate and could include periods where temperatures remain stable for 10 to 20 years, but admitted they had failed to explain this to the public in the past.
Prof Rowan Sutton, Director of Climate Research at the University of Reading, said: “Within the field we have taken for granted that there will be variations in the rate of warming, it is totally accepted and is no surprise ...[it] would correct to say that wasn’t the message that we communicated more widely and that probably is a failing.”
UPDATE: C3 has updated the Wayne's World list of excuses for the "pause":


Related:

Climate Depot Analysis: ‘There have been at least 10 separate explanations for the standstill in global warming’ – 1) Low Solar Activity; 2) Oceans Ate Warming; 3) Chinese Coal Use; 4) Montreal Protocol; 5) Readjusted past temps to claim ‘pause’ never existed 6) Volcanoes 7) Decline in Water Vapor 8) Pacific trade winds 9) ‘Coincidence’ 10) ‘Stadium Waves’

‘Warming Interrruptus’ – Causes for The Pause


Quotable Global Warming Hiatus Quotes

Monday, October 6, 2014

New paper is a huge blow to CAGW: 'Missing heat' NOT found in the deep oceans

A paper published yesterday in Nature Climate Change finds the deep oceans [below 2000 meters] cooled from 2005-2013, debunking the convenient excuse that Trenberth's AGW 'missing heat' has been hiding in the deep oceans. According to the authors, this deep ocean cooling caused a global sea level decrease of -0.13 mm/yr from 2005-2013. 

As the paper notes, this is a reversal from the deep ocean warming from the 1990's to 2005, which led to a sea level rise of +0.11 mm/yr during that period, but has reversed since 2005 to deep ocean cooling and a negative contribution to sea levels. Thus, there is no evidence of the AGW "missing heat" hiding in the deep oceans as many warmists have claimed. 

Even though the heat content of the upper oceans has slightly warmed 0.09C over the past 55 years [Levitus et al 2012], this is also not nearly enough to explain the alleged AGW "missing heat." Therefore, the "missing heat" is missing from both the upper and lower oceans. 

Thirdly, since there has been no statistically-significant warming of the atmosphere [troposphere] over the past 18-26 years during the so-called "pause" or "hiatus", the AGW "missing heat" is missing from the atmosphere as well. 

There is one inescapable conclusion: The "missing heat" is nowhere to be found in Earth's atmosphere or oceans, and has escaped to space, or never existed in the first place [except in computer models]. Indeed, measurements of outgoing longwave radiation to space [infrared from greenhouse gases] have increased over the past 62 years, not decreased as predicted by models from the rise in greenhouse gases.

"It's a travesty!" 


Accompanying editorial in Nature Climate Change [excerpt]


Deep-ocean contribution to sea level and energy budget not detectable over the past decade


Nature Climate Change
 
 
doi:10.1038/nclimate2387
Received
 
Accepted
 
Published online
 

Abstract


As the dominant reservoir of heat uptake in the climate system, the world’s oceans provide a critical measure of global climate change. Here, we infer deep-ocean warming in the context of global sea-level rise and Earth’s energy budget between January 2005 and December 2013. Direct measurements of ocean warming above 2,000 m depth explain about 32% of the observed annual rate of global mean sea-level rise. Over the entire water column, independent estimates of ocean warming yield a contribution of 0.77 ± 0.28 mm yr−1 in sea-level rise and agree with the upper-ocean estimate to within the estimated uncertainties. Accounting for additional possible systematic uncertainties, the deep ocean (below 2,000 m) contributes −0.13 ± 0.72 mm yr−1 to global sea-level rise and −0.08 ± 0.43 W m−2 to Earth’s energy balance. The net warming of the ocean implies an energy imbalance for the Earth of 0.64 ± 0.44 W m−2 from 2005 to 2013.

Deep ocean contribution to sea levels shown in bottom graph has declined -0.13 mm/yr since 2005

Saturday, October 4, 2014

New excuse #54 for the "pause" in global warming: 'Global quasi-stationary waves' from natural ocean oscillations

A recent paper published in Nature Climate Change by Kevin "it's a travesty!" Trenberth, et al, finds excuse #54 for the 18+ year "pause" in global warming: "Global quasi-stationary waves in the upper troposphere" due to the negative phase of the natural Pacific Decadal Oscillation [PDO]. 

According to the authors, 

"The Recent Pause In The Rise Of Global Mean Temperatures Are Examined Seasonally. For 1999 To 2012, The Hiatus In Surface Warming Is Mainly Evident In The Central And Eastern Pacific. It Is Manifested As Strong Anomalous Easterly Trade Winds, Distinctive Sea-Level Pressure Patterns, And Large Rainfall Anomalies In The Pacific, Which Resemble The Pacific Decadal Oscillation (PDO)."
By Using [lots of fudge factors in a climate] Model, The Large Negative Anomalous Latent Heating Associated With The Observed Deficit In Central Tropical Pacific Rainfall Is Shown To Be Mainly Responsible For The Global Quasi-Stationary Waves In The Upper Troposphere. The Wave Patterns In Turn Created Persistent Regional Climate Anomalies, Increasing The Odds Of Cold Winters In Europe. Hence, Tropical Pacific Forcing Of The Atmosphere Such As That Associated With A Negative Phase Of The PDO Produces Many Of The Pronounced Atmospheric Circulation Anomalies Observed Globally During The Hiatus."
In the conclusion, the authors state,
"These have been recognized as a dominant mode of natural interannual variability associated with ENSO, but here we focused on the inter-decadal variability that has become strongly evident recently through its manifestation as a pause in the rise of global mean temperatures. Accompanying the recent negative phase of the PDO has been striking changes in tropical and subtropical winds and ocean currents, with profound effects on OHC and sea level. Some of these aspects appear to be unique to the past decade and raise questions about whether natural internal variability itself is being altered by climate change."
It's a travesty to now claim, as Trenberth et al now appear to say, that natural variability itself is no longer natural and "being altered by" AGW! Such are the depths to which the AGW religion has sunk.

Side question: Do Trenberth et al Think That Capitalizing Every Single Word In Their Abstract Makes It Look More Definitive And Sciencey?

Full paper:

Seasonal aspects of the recent pause in surface warming
Nature Climate Change 4, 911–916 (2014) doi:10.1038/nclimate2341
Factors involved in the recent pause in the rise of global mean temperatures are examined seasonally. For 1999 to 2012, the hiatus in surface warming is mainly evident in the central and eastern Pacific. It is manifested as strong anomalous easterly trade winds, distinctive sea-level pressure patterns, and large rainfall anomalies in the Pacific, which resemble the Pacific Decadal Oscillation (PDO). These features are accompanied by upper tropospheric teleconnection wave patterns that extend throughout the Pacific, to polar regions, and into the Atlantic. The extratropical features are particularly strong during winter. By using an idealized heating to force a comprehensive atmospheric model, the large negative anomalous latent heating associated with the observed deficit in central tropical Pacific rainfall is shown to be mainly responsible for the global quasi-stationary waves in the upper troposphere. The wave patterns in turn created persistent regional climate anomalies, increasing the odds of cold winters in Europe. Hence, tropical Pacific forcing of the atmosphere such as that associated with a negative phase of the PDO produces many of the pronounced atmospheric circulation anomalies observed globally during the hiatus.

Tuesday, August 5, 2014

The search for the 'missing heat' in the oceans ends with a bust: Deep layers of the ocean have cooled over the past 20 years

A post today from the German site Die Kalte Sonne explains why Trenberth's "missing heat" from CO2 is still AWOL, not in the deep oceans as many alarmists have claimed, for the simple reason that the deep oceans have cooled over the past 20 years. The slight warming of the upper oceans of 0.09C over the past 55 years [Levitus 2012] is also not enough to account for the huge amount of "missing heat" that alarmists claim has been generated by man-made CO2. In reality, there never was any "missing heat," it was all radiated to space by greenhouse gases.

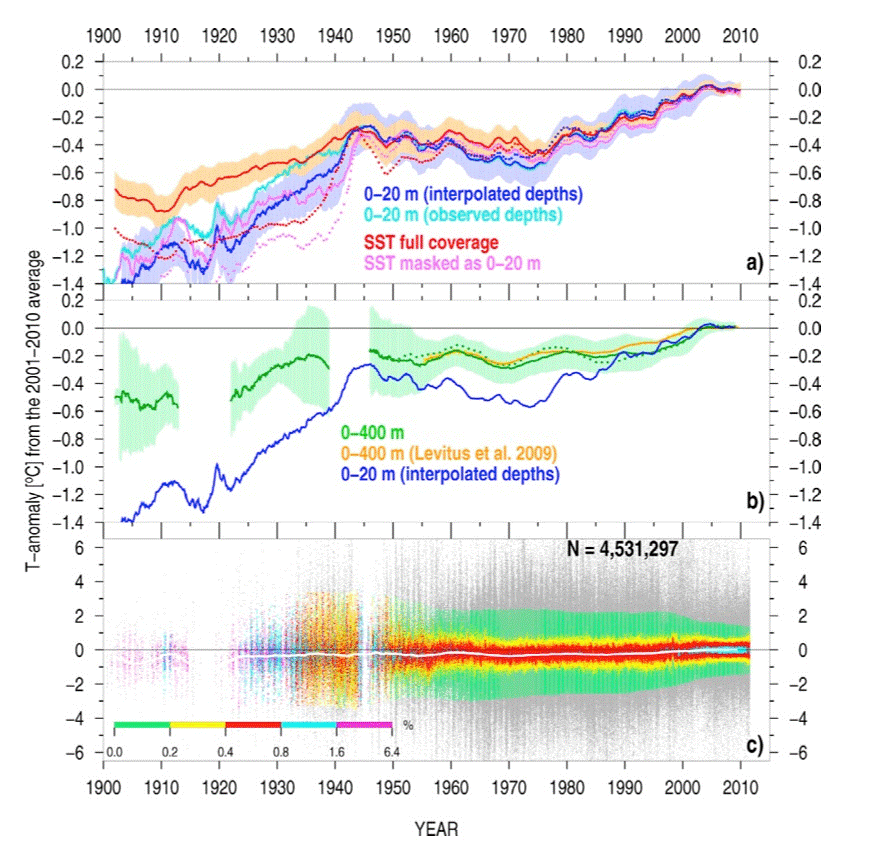
I would add to the Die Kalte Sonne post below that the Gouretski et al 2012 paper states 

"Levitus et al. [2009] estimate global temperature anomalies using extensive interpolation of the gridded anomaly fields. A modified version of the time series from Levitus et al. [2009], of mean temperature anomaly 0–400 m, averaged only over gridboxes with data, is shown in Figure 2b. Their time series suggests a more gradual warming since the 1950s than in our analysis. Differences between the two 0– 400m time series may be due to the XBT corrections applied, mapping techniques employed, and/or differences in data and quality control decisions for the data. For instance, modifying the mapping method described here to make it more similar to the method used by Levitus et al. [2009] by not applying the depth extension to shallow profiles results in a change in calculated mean temperature anomaly 0–400 m of < 0.05 C for years prior to 1955, < 0.02 C 1955–1970, and < 0.01 C after 1970. Regarding bias corrections, Lyman et al. [2010] found that differences due to XBT bias corrections were the major factor in differences between ocean heat content estimates. A more detailed discussion of the differences between the two curves is beyond the scope of the present work. However, the differences between the time series are smaller than their respective uncertainty bounds and both time series show the same increase of about 0.2 C since the mid-1950s."

Figure from  Gouretski et al 2012

Using the above temperature changes from Gouretski et al 2012 we obtain a rate of ocean temperature changes in the upper 400 meters of

1900-1955: < 0.0009C/yr
1955-1970: < 0.0001C/yr
1970-2010: < 0.00025C/yr

Therefore, the Gouretski et al 2012 paper would imply that the rate of upper 400 m ocean warming was ~3.6 times faster from 1900-1955 compared to 1970-2010, a deceleration of ocean warming in defiance of anthropogenic global warming theory, and the opposite of the acceleration claimed by the "Skeptical Science" website and by other alarmists.

Goggle translation from German [with apologies] from Die Kalte Sonne:

The search for the 'missing heat' in the oceans ends with bust: Deep layers of the ocean have cooled over the past 20 years

It has meanwhile spread that global warming paused for 16 years. Contrary to the IPCC's forecasts are stagnating temperatures, it is simply no longer getting warmer. How could this happen? The researchers devised a variety of hypotheses. The most widely used model says here that the surface temperatures of the Earth stagnate though, but in silence the waters of the deep sea would heat up strongly. And if these accumulated heat could eventually fight his way to the surface, then we are threatened with the warming disaster!
A nice theory, but how much truth is behind it? Is there data that underpin this model? First of all, you have to lead the complexity of the question in mind: We want to find out if there are layers of water in the world oceans, who warms up. The temperature of the water surface can be relatively easily derived from modern satellites. For up to 11 km deep oceans it will be more difficult. Satellite help here not because they get out of the depths of the oceans no information. The upper water layers obscure the underlying. In order to detect the temperature data in all three dimensions, surface and depth, as well as the temporal change of the values, repeated measurements must be performed in the water column on site, which is located at 362 million square kilometers of ocean surface as a logistical problem.
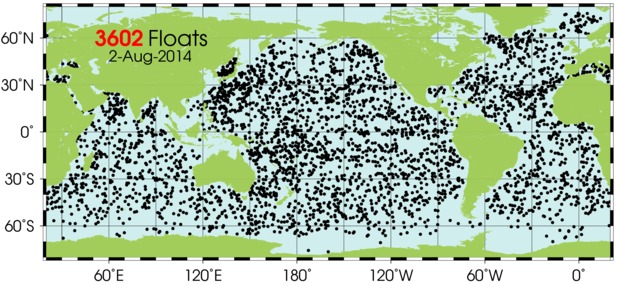
Because of the enormous importance of such data, science has in recent years, however, come up with something let. Since 2007, for determining the temperature of the deep sea called the Argo program, which consists of more than 3600 automatic diving buoys is drifting in the worlds oceans and regularly dive through the water column of 2,000 m depth to the surface of the water and measure the temperature and salinity. Wikipedia has the details:
This measuring robot are relatively small and weigh 20-30 kg. All profiling drifting buoys belonging to the Argo program, subject to a common data policy and the data are made available in real time without restriction to the general public. In the majority of cases the floats drift at depths of 1000 m (the so-called parking depth) and immerse every ten days then first at 2000 m starting to rise from the depth from the surface. During the ascent to the sea surface the floats measure temperature, conductivity and pressure in the water column. With the aid of the measured parameters then the salt content and the density of the sea water can be calculated also. Density is an important variable in oceanography, as horizontal density differences drive the large-scale currents in the ocean. The mean flow field in the parking depth can be determined from the distance traveled and the direction of successive float positions. The positions are not measured in the parking depth, but only on the surface by positioning systems GPS or ARGOS satellite. The transmission of the measured data is also where all the data collected, quality checked and then provided for use in real-time via satellite to international data centers.
Figure 1: Location map of the Argo buoys on August 2, 2014 Figure:. Argo website .
The following cartoon by Malou Zuidema & Esmee van Wijk describes the Argo measuring run very impressive:


While the Argo program represents a giant step forward, still lack systematic measurements of water depths below 2000 m. The data gap is huge when you consider that the average depth of the oceans is just under 3700 m. Also, of course, a lack of reliable, global data from the pre-Argo era, ie before 2007. Well covered The Argo-measurement period is only 7 years, which is extremely low compared to the climatic minimum interval of 30 years.
Before we go into the available measurement data, we need to introduce another concept, which plays in the description and summary of the oceanic temperature conditions and changes an important role in the so-called "heat content of the oceans", in English "Ocean Heat Content" (OHC) . Wikipedia explains:
The heat content of the oceans [...] (eg oceans) stored thermal energy called (the amount of heat) in the sea or parts thereof.Water has a higher heat capacity than air, therefore, the heat content of the oceans, is higher than in the atmosphere. The atmosphere containing only about 2% of the total heat capacity of the soil.
And this is one of the main reasons why we should deal with all water layers of the oceans and not only with the water surface: In the totality of ocean water can be a thousand times more stored heat, as in the atmosphere. Even small changes in the oceans, therefore, have a meaning.
Changes in the oceanic heat content in the past 50 years
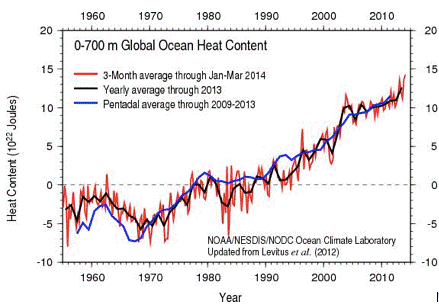
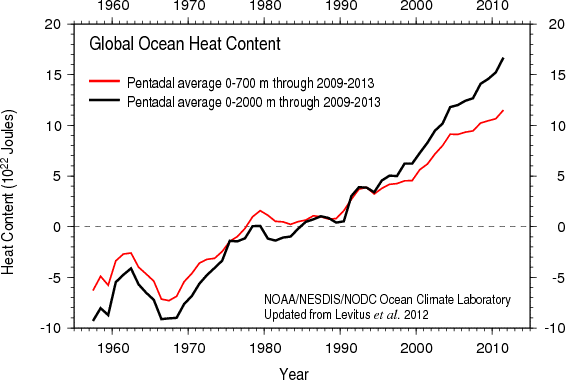
The development of the oceanic heat content (OHC) is usually shown for certain water depth ranges. The North American Oceanographic authority NOAA shown in the following figure, the OHC for the last 60 years for the depth interval 0-700m, so a summary value for the global water body from the water surface to a depth of 700 m:
 
Figure 2: Evolution of the oceanic heat content for the last 60 years (depth interval 0-700m). Source: NOAA .
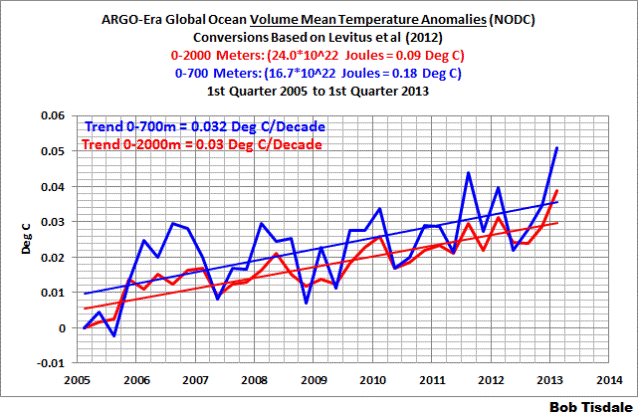
The OHC has increased in recent decades to be felt, what little wonder, as the global warming at the same time is advanced by half a degree. The data used in the pre-Argo-time is naturally quite thin . Suppose nevertheless at once that the trend is true. Perhaps you've noticed that on the Y-axis that temperatures are plotted, but the energy in Joules. This energy can, however, translate them back into temperatures (with thanks to Lucia / The Blackboard ):
Figure 3: OHC change the last 60 years, expressed in degrees Celsius. Source: Lucia / The Blackboard .
Have you noticed it? The OHC change in the past 60 years includes a change of less than 0.1 ° C. An extremely small amount, even taking into account the enormous heat capacity of the ocean to the atmosphere (see also Bob Tisdale's curves on WUWT).
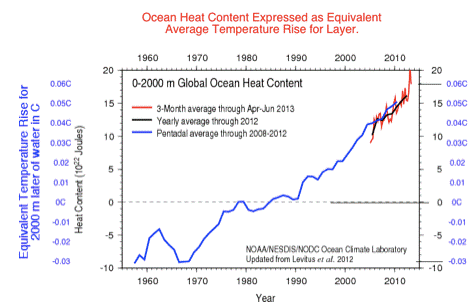
Let's look now into the deeper water layers, 0-2000m:

Figure 4: OHC of the past 60 years, 0-2000m. Source: NOAA .
In principle, the development of water depth intervals 0-700m and 0-2000m are similar. The layers 0-2000m take on a bit more heat, probably mainly because the water column is much larger than in the case of 0-700m.
When the curves are global averages. Interestingly, the developments in the different oceans differ, sometimes significantly (see illustrations of Bob Tisdale at WUWT ). Thus, the cooled northern North Atlantic in the depth range 0-700m between 1955-1997 steadily. A research group led by Sirpa Hakkinen of NASA's Goddard Space Flight Center was also in a 2013 Journal of Geophysical Research published study show that the heat content of the northern North Atlantic is strongly influenced by ocean cycles. The OHC development is largely parallel to the Atlantic Multidecadal Oscillation (AMO), which is characterized by a quasi-cyclic 60-year history.
The cyclic 60-year component in global OHC history is all the more evident when one considers longer series of data. A team led by Viktor Gouretski of the University of Hamburg scoured the global oceanographic databases and found temperature data from water depths up to 400m, dating back to 1900. The work appeared in 2012 in the Geophysical Research Letters . The OHC curve 0-400m (green curve in Figure part b below) runs largely parallel with the known global temperature development: it can be seen two heating phases between 1900 to 1945 and from 1970 to 2003, interrupted by a warming break. The data for the study come from, according to authors:
1) bottle casts, 2) Conductivity-Temperature-Depth (CTD) profilers, 3) Mechanical BathyThermographs (MBT), 4) Expendable BathyThermographs (XBT), 5) Argo profiling floats, and 6) pinniped mounted sensors (sensors attached to marine mammals).
Figure 5: Development of the global oceanic heat content for the last 110 years after Gouretski et al. In 2012 . Green curve in Figure b shows part OHC for the depth interval 0-400m.
In 2012, a team led by Dean Roemmich of the Scripps Institution of Oceanography published in the journal Nature Climate Change even a study on the warming of the oceans during the past 135 years, and it includes data of the known Challenger Expedition took from 1872 to 1876. In an associated press release Roemmich explains that the warming of the oceans is a process that not only in this age of increased industrial CO 2 emissions began, but began more than 100 years:
"The Significance of the study is not only did we see a temperature difference did indicates warming on a global scale, but did the magnitude of the temperature change since the 1870s is twice did Observed over the past 50 years," Said Roemmich, co- chairman of the International Argo Steering Team. "This Implies did the time scale for the warming of the ocean is not just the load 50 years but at least the load 100 years."
Changes in the oceanic heat content in the past 10 years
As we have seen, the OHC has grown over the long term as part of the re-heating of the 20th century following the Little Ice Age. 60-year ocean cycles and other processes have modulated and shaped the course of heating. Now some IPCC researchers have close speculated that the lack of surface warming during the past 16 years by a sinking of the heat was indebted in the world oceans. We will therefore in the following, especially the last one, take two decades closer look. Fortunately, we can in this case - at least for the upper half of the water column - help the new Argo data.
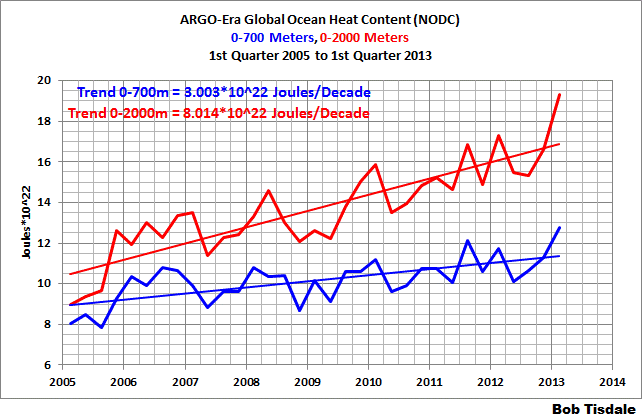
According to Argo data from the U.S. National Oceanographic Data Center (NODC) of the NOAA OHC for the two depth ranges 0-700m and 0-2000m has risen in the last 10 years ( Figure 6 ). An acceleration of the heating with respect to the front of the last decade, however, can not be seen ( Figures 2-4 ).
Figure 6: Development of OHC for the two depth ranges 0-700m and 0-2000m in the last 10 years. Data: NODC, Graphics: Bob Tisdale .
The observed on the sea and land surface warming pause seems to be true that is not for the top 2 km of the water column. Here is the heating continued under NODC data set. You can see the IPCC supporters already funny to a bonfire dancing: "Yippie, the heating goes on! Did we have always told you. Must seek only to place your stop! ". Warming in the ocean, yes, but by how much? At this point, the party suddenly stops: The current Ewärmungstrend the upper ocean is only half pitiful 0.03 ° C per decade ( Figure 7 ). In 30 years here, only a tenth of a degree together, in 300 years, a full degree - if the heating so would go on as before. A heat disaster is different.
Figure 7: Global temperature development of the oceans for the two depth ranges 0-700m and 0-2000m in the last 10 years. Data: NODC, Graphics: Bob Tisdale .
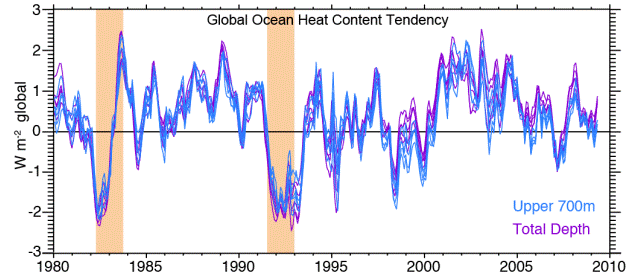
The IPCC near U.S. scientist Kevin Trenberth - known for its "it's a travesty!" - Email sobs for heating break - have a in May 2014 in the Journal of Climate published work even admit that the warming of the oceans from 2001 - 2010 has slowed, the rate of increase OHC thus has decreased (Figure 8).
Figure 8: Evolution of the rate of change in OHC from 1980 to 2010. From Trenberth et al. 2014 .
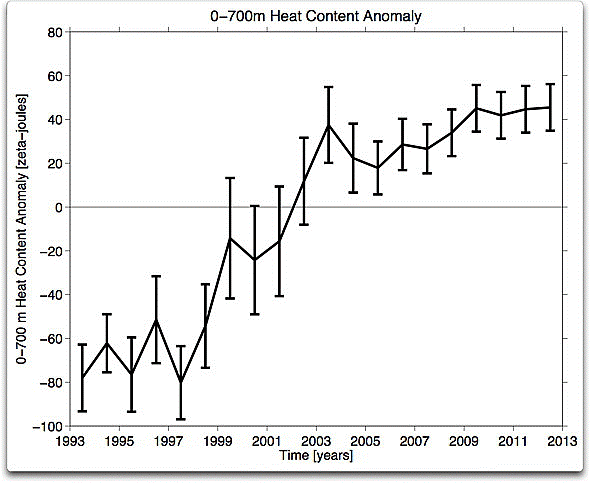
Apparently, however, there are differences of opinion among scientists, as the heterogeneous measurement data are to be prepared.Researchers at the Pacific Marine Environment Laboratory (PMEL) NOAA suspect that data from XBT measurements (expendable bathythermograph) have not been processed correctly . In an improved analysis of the PMEL scientists come to an OHC development for the low floor 0-700m, which no longer contains a rise in the curve since 2003 ( Figure 9 ). Thus, the warming of the oceans would be virtually to a depth of 700 so come to a standstill .
Figure 9: Development of the OHC for the depth interval 0-700m during the last 20 years. Data and Graphics: NOAA Pacific Marine Environment Laboratory ( PMEL )
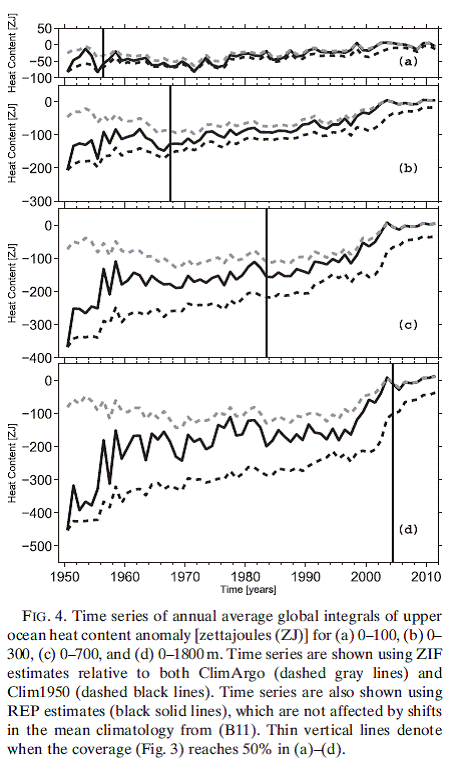
In March 2014 was published in the Journal of Climate , a Paper of the two PMEL researchers John Lyman and Gregory Johnson, in which they also pointed to problems with the selected climatological reference period. If you select the period to which the anomalies relate too early to go many interpolated values ​​with one and change the trends. The spatial coverage and the uncertainties due to "infill" grow with increasing distance from the present time. In this work the OHC anomalies 1950-2011 redetermined by a reference period 2005-2010 is chosen, with the most accurate monthly data are available: Argo. The result can sit up ( Figure 10 ): The OHC had about 2003 peak and has stagnated ever since. No evidence of "missing heat" in depths up to 1800m.
Figure 10: OHC development for (a) 0-100m, (b) 0-300m, (c) 0-700m, (d) 0-1800m. From Lyman & Johnson in 2014 .
Also, the UK Met Office has a OHC record (UKMO EN3) developed showing almost no warming in the 0-700m and 0-2000m curves since 2003 (see Figures 4 and 5 in Bob Tisdale's post on WUWT ).
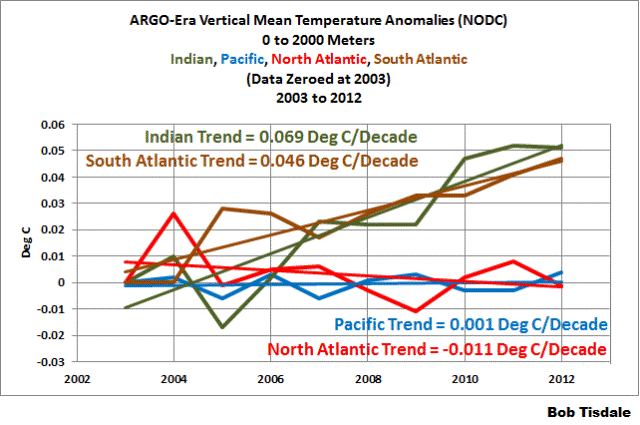
Again, the developments in the different oceans are very different from each other. While the Indian Ocean and South Atlantic heat above average, the heat content has in the North Atlantic and Pacific over the last 10 years hardly changed (depth interval 0-2000m) ( Figure 11 ). Also, the Southern Ocean around Antarctica process currently seems to lose heat than to accumulate, as Schulz et al. 2012 documented.
Again, the warning may be mentioned that there definitely ocean cycles are taken into account, the effect over time periods which exceed the Argo Messära many times. A simplistic extrapolation of the observed Argo Trends in the next 20-30 years, therefore, makes little sense.
Figure 11: OHC trends from the Argo era, broken down by major oceans. data: NODC, Graphics: Bob Tisdale
Was mentioned in passing briefly that the OHC values ​​from year to year show larger fluctuations. Therefore, in practice often running averages are shown for several years, in order to suppress this "noise". The annual fluctuations stem from changes in the Pacific, where El Nino and La Nina phases make noticeable and affect the global OHC budget. Wikipedia knows this:
Model studies have shown that during La Niña years by shifting winds warmer water masses about ocean currents into the deeper layers of the sea are increasingly being transported. This leads to greater heat absorption of deep and less heat absorption of the atmosphere and temperature of the surface of the sea. Years with increase in temperature in deeper waters are associated with a negative phase of the interdecadal Pacific Oscillation (IPO). During the El Niño years of the ENSO circulation ocean currents carry significantly less water masses in the deep sea, thus the temperatures of the water at the sea surface and the atmospheric ground layer above the sea surface to rise more.
The unknown depth: here Hides perhaps the missing warming?
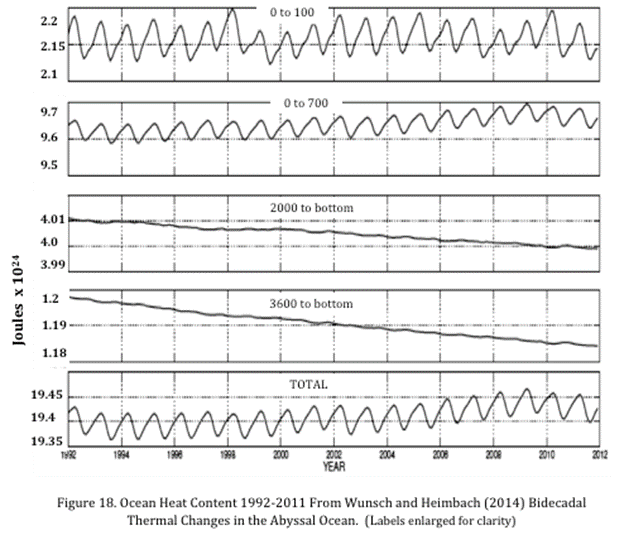
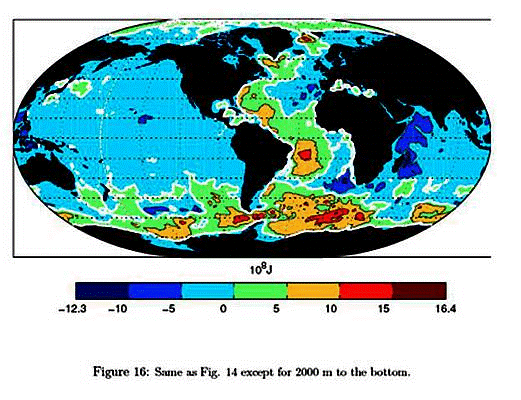
It is becoming increasingly clear that the failed at the surface warming has not redirected in the upper half of the ocean. The now available up to 2000 m depth measurement data suggest rather to the fact that has weakened the heating here, may come to a halt even for nine years. That leaves the deep water below. Here Hides perhaps the missing warming? The data situation is poor, as the Argo buoys not penetrate into this area. Nevertheless, there are also in this investigation and evidence to OHC development. So published Carl request from Harvard University with Patrick Heimbach Massachusetts Institute of Technology (MIT) this year (2014) in the Journal of Physical Oceanography a paper that deals with the Abyssal, ie the lower floors of the oceans. The conclusion is made ​​clear: the water masses below 2000m have cooled in the last 20 years (Figure 12 ). No trace of the ominous heat that had hypothesized here are some IPCC researchers close. In summary, the authors write:
A dynamically consistent state estimate is used for the period 1992-2011 to describe the changes in oceanic heat content and temperatures applications, with emphasis on deterministic mining to the noise background in the abyssal (below 2000 m) depths.Interpretation requires close attention to the long memory of the deep ocean, and meteorological forcing of implying did Decades to Thousands of years ago shoulderstand be silent Producing trend-like changes in abyssal heat content. Much of the deep ocean volume Remained unobserved. At the present time, warming is seen in the deep western Atlantic and Southern Ocean , Roughly consistent with Those regions of the ocean expected to display the earliest responses to surface disturbances.Parts of the deeper ocean, below 3600 m, show cooling. Most of the variation in the abyssal Pacific Ocean is comparativelyfeatureless , consistent with the slow, diffusive, approach to a steady state expected there.

Figure 12: OHC development over the last 20 years. The deep water below 2000m has apparently cooled steadily during this period. Figuredesire & Heimbach 2014 .

Figure 13: OHC change from 1993 to 2011 for water layers below 2000m. With the exception of the western Atlantic and the Southern (zirkumantarktischen) Ocean just cooling down is recorded. Figure desire & Heimbach 2014 .
Desire and Heimbach indicate in the discussion part of the paper that the data are more likely to speak against the model of intermediately stored in the deep ocean heat:
The Uncertainties ... REMAIN too large to rationalize eg, the apparent "pause" in warming
The situation is similar Judith Curry , who wrote in her blog in January 2014:
All in all, I do not see a very convincing case for deep ocean sequestration of heat.
As early as 2012 had Mauritzen et al. in in Nature Geoscience reports published study by cooling of the deep water in the northern North Atlantic for the period 1953-2007. Also Roemmich et al. 2012 appear on a global scale indication of this have been found. The comparison with the Challenger data from 135 years ago suggests a cooling below 1500m down (Figure 3 here ).
Changes in the oceanic heat content in the context of the last 10,000 years
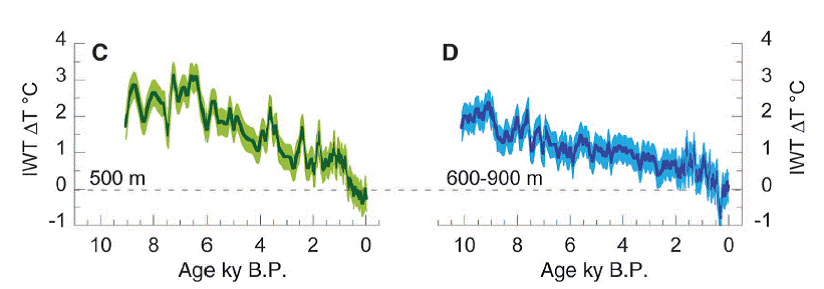
Finally, take a look at the long-term context of the development of ocean temperatures. In November 2013, a team led by Yair Rosenthal of Rutgers University published in the journal Science a reconstruction of the OHC development in the Pacific during the last 10,000 years. On the basis of temperature-sensitive foraminifera from cores they reconstructed the temperature history of a water layer of "medium depth" at about 500-1000m, the so-called North Pacific Intermediate Water '. The result is spectacular: Interestingly, the tested waters were significantly warmer than today during most of the last ten thousand years ( Figure 14 ). Thus, temperatures were in the North Pacific 9000-6000 years before present at the time of mittelholozänen optimum whole 2 ° C above the present value. And during the Medieval Warm Period 1,000 years ago it was still just one degree warmer than today, as the authors write in the abstract of their paper:
Observed Increases in ocean heat content (OHC) and temperature are robust indicators of global warming falling on the past several Decades. We used high-resolution proxy records from sediment cores to extend synthesis observations in the Pacific 10,000 years beyond the instrumental record. We show did water masses linked to the North Pacific and Antarctic intermediate waters were warm by 2.1 ± 0.4 ° C and 1.5 ± 0.4 ° C, respectively, falling on the middle Holocene thermal maximum than over the past century. Both water masses were ~ 0.9 ° C warmer falling on the Medieval Warm period than falling on the Little Ice Age and ~ 0.65 ° warmer than in recent Decades.
Figure 14: Temperature evolution of the North Pacific Intermediate Water (IWT) for water depths of 500m (left) and 600-900m (right). The zero line this corresponds to the average of the outgoing Little Ice Age from 1850 to 1880. Source: Rosenthal et al. 2013 .

A bitter blow to the theory of impending heat disaster: Rarely, if ever it was cooler than today during the last 10,000 years! The authors were obviously to do with the fear and created together with the press office of the Lamont-Doherty Earth Observatory quickly a press release that had hardly anything to do with the paper. As a focal point of the press release, curiously enough, the threat of global warming has been selected. They wanted it apparently with the IPCC clique and the lush research funding sources associated not forfeit. While the main result of the study - that is, the long-term cooling of the Pacific - was well hidden in the middle of the text, emphasizes the message, especially on something quite different from: Supposedly the study would show that parts of the Pacific in recent decades 15 times have warmed faster than any time in the last 10,000 years. Excerpt from the press release of 28 October 2013:
Parts of Pacific Warming 15 Times Faster Than in Past 10,000 Years
[...] over the load 60 years, water column temperatures applications, averaged from the surface to 2,200 feet, Increased 12:18 degrees C [...]. That might also SEEM small in the scheme of things, but it's a rate of warming 15 times faster than at any period in the load 10,000 years, Said [co-author Braddock Linsley, a climate scientist at Columbia University's Lamont-Doherty Earth Observatory]. [...] The study's long-term perspective Suggests did the recent break in global warming june just reflect random variations in heat going in between atmosphere and ocean, with little long-term, importance, says  Drew Shindell , a climate scientist with joint appointments at Columbia's Earth Institute and the NASA Goddard Institute for Space Studies, and a lead author on the latest IPCC report. 
Wonderful to see how the study is wrong in the press release in its complete opposite. The klimaalarmistische Press began its function played ball on only too happy. In Spiegel Online was the moderate Axel Bojanowski probably just on vacation, so that the IPCC friend Markus Becker had free rein. In a written by him message from November 1, 2013 he made ​​it but actually to mention the long-term cooling of the Pacific Ocean to the Today time not a syllable (excerpt):
Climate change: have oceans heat storage greatly accelerated
[...] A team led by Yair Rosenthal of Rutgers University in the U.S. state of New Jersey has the temperatures of the oceans now reconstructed for the last 10,000 years. The result:., The heat absorption is recently risen dramatically As the researchers in the journal "Science" writing, the average depth layers of the oceans have warmed 15 times faster in the past 60 years than at any natural variation in the past 10,000 years. [...] The results are robust to the researchers for quite worrying, as they suggest that the oceans could have the effect of human greenhouse gas emissions even more attenuated than previously thought. "We may have underestimated the efficiency of the oceans as a reservoir for heat and energy," says Rosenthal. "This could give us more time. But how much, I do not know. "
Similar reports appeared in U.S. newspapers, including the New York Times . The renowned climate scientist Judith Curry immediately realized that something was not right. In a post on 1 November 2013, it explained that the rate of warming in recent decades is not at all comparable with the historical data of the study. Apparently apples are compared to oranges here, because the resolution of the temperature curve in the Rosenthal-work is not enough by far closer to those of the modern measurements. Rapid heating or Abkühlereignisse would not be visible in the historical curve. Judith Curry writes :
... We have the very high rate of increase at the end of the time series, but It Seems did the temporal resolution is pretty low, century resolution at best. Thus, if the signal from AGW is say since 1970, this Seems well below the resolution of the analysis, so I am not sure how significant this rapid rate of increase in context of AGW attribution. [...] The key issue for AGW detection is to get paleo proxy resolution at decadal timescales. If the temporal resolution of the paleo time series is a century or lower, but sees an 'uptick' at the end of the time series, to me this does not say anything about AGW detection, Which at best is detectable since about 1975.
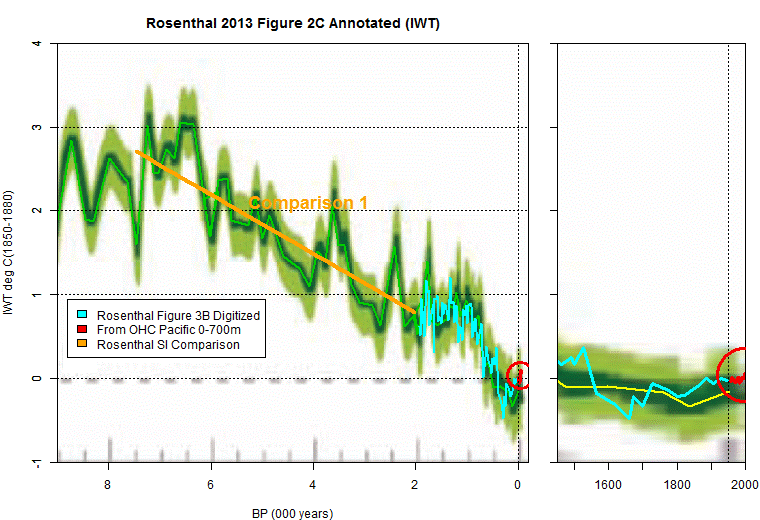
But it gets even better. Steve McIntyre has made ​​on Climate Audit the effort and to investigate the temperature curves shown by Rosenthal and colleagues in the work on heating rates down. It turned out this is that there have been a number of phases revealed in the last 10,000 years, have been achieved in the heating rate to that of the last decades were similar to or even exceeded ( Figure 15 ). The claim that " the average depth layers of the oceans [have] heated 15 times faster in the past 60 years than at any natural variation in the past 10,000 years "is simply wrong. Should actually follow up on Spiegel Online schnellstmöglch a correction message. One has the readers staked a bear, presumably to convey the klimaalarmistische movement.
Figure 15: Temperature evolution of the North Pacific Intermediate Water (green curve, Figure 2c from Rosenthal et al 2013.). Steve McIntyre has completed the development of the last 2000 years (light blue, Fig 3b from Rosenthal et al., 2013) as well as modern OHC measurements (red). Source: Climate Audit .
We close this brief introduction to the fantastic world of ocean heat content. Maybe one or the other the synopsis allows the now effectively enter into the public debate and to better distinguish fiction from truth. In the event that you once himself with the OHC data from the National Oceanographic Data Center (NODC) want to experiment NOAA, you can find them well prepared online at the KNMI website (under the heading "Heat Content").