Showing posts sorted by date for query uhi. Sort by relevance Show all posts

Sunday, July 27, 2014

A Very Unsettled Science: Just a few of the most urgent unsolved questions in climate science

A recent paper published in Frontiers in Earth Science briefly describes twelve of the "grand challenges" in atmospheric research over the next several years. According to the author, this "non-exhaustive" list only mentions "a few of the most urgent unsolved questions and naturally remains incomplete."

The few of the most urgent unsolved questions include climate forcings, feedbacks, data series of adequate length to determine trends and correlations, better representation of errors, the carbon cycle, representation of clouds & deep convection, the complex dynamics in urban areas, closure of the surface energy and heat balance with observations, effect of aerosols, extending weather forecasts beyond 2-7 days, non-linear fluid dynamics and chaotic interactions, understanding of the nature of the interaction between atmospheric and land surface processes, climate sensitivity to CO2 and other greenhouse gases, the hydrological cycle, the dynamics of deep convection, the role of the tropopause in atmospheric dynamics, development of mesoscale models, improvement in the parameterizations used in the wave-based models of weather and climate, remote sensing of the regional and global cycles of clouds and precipitation necessary for climate monitoring & verification of model outputs, establishment of source-sink relationships for atmospheric water vapour, the effects of the main modes of climate variability on the variability of the moisture regions, how the transport of moisture occurs in a changing climate, a more complete picture of solar forcing in climate models, etc., etc.

And these are only a few of the grand challenges of understanding the atmosphere, not to mention any of the more exhaustive list of grand challenges of understanding the oceans, which control the atmosphere. 


The next time someone naively suggests that the infant field of climate science is "settled" or able to claim 95% or 97% confidence in climate prognostications, show them this "non-exhaustive" list of deep challenges that must be "settled" first. Likewise, when anti-science alarmists claim skeptics are "climate science deniers," ask them specifically which of these "unsolved questions" in climate science you "deny".


Emphasis added:

SPECIALTY GRAND CHALLENGE ARTICLE

Front. Earth Sci., 29 October 2013 | doi: 10.3389/feart.2013.00001

Grand challenges in atmospheric science

EPhysLab, Facultade de Ciencias, Universidade de Vigo, Ourense, Spain


As a subject of study, the atmospheric sciences encompass all the processes that occur in the atmosphere, together with its links with other systems, mainly the hydrosphere, cryosphere, lithosphere, biosphere, and outer space. As such it is an extensive discipline and the task of describing the main challenges is not an easy one, and entails a fair degree of overlap with some of the other grand challenges in the earth and environmental sciences. As a special overlapping could occur with climate sciences it is worth to remember that atmospheric processes differ from climate ones in the temporal scale, being the latter those occurring over long periods, typically higher than 30 years, but in any case long enough to produce meaningful averages. Atmospheric processes are central to configure the state of the climate but also to many of the forcings and feedbacks that determine the magnitude of climate change and its possible impacts. Additionally, there has been impressive progress of late in the atmospheric sciences in terms of the benefits provided to individuals and organizations. The flow of atmospheric “information” is of considerable importance in decisions related to health, agriculture, energy, power, and the environment. This “Grand Challenges” article focuses on the atmosphere, although the strong interaction with other parts of the earth and its environment, together with the societal implications involved, is a common theme in all the challenges described.

Over the next few years, progress in the atmospheric sciences is essential if understanding of the basic processes and their modeling is to improve; this will require genuine advances in observational, conceptual, and technological approaches. For this reason the following non-exhaustive list of 12 selected challenges includes those related to observations and data assimilation, those covered within the traditional disciplines (atmospheric physics and chemistry, atmospheric dynamics and weather forecasting), those concerned with the interactions between the atmosphere and its boundaries, and those related to the atmospheric component of climate studies.

Challenge 1: Data Assimilation


The challenges in terms of data assimilation for earth observation over the next years relate to technical and general thematic aspects, as well as to the ability to take advantage of new and exciting opportunities in earth observation systems. The benefits of addressing these challenges are likely to include improvements to reanalyses, improvements to weather forecasting, an improved observational system, and an improved foundation on which the elements of climate models can be built. Among the technical challenges, five areas are most significant: (1) the assimilation of coupled data to account for links between different elements of the earth's system; examples include the coupling of the atmosphere and the ocean, of the ocean and the cryosphere, and of the atmosphere and the land; (2) assimilation of ensemble data to account for natural variability and/or to represent errors in the earth system—here, the technical effort will focus on the design of realistic ensembles; (3) performing data assimilation at increased spatial resolutions, representing the earth system at finer scales (mesoscale and finer), including theoretical developments to account for changes in balance conditions; (4) better representation of errors (random and bias) in the observations and models used in data assimilation, including the representation of forecast errors, model errors and online bias correction; (5) extension and consolidation of the joint state estimation and the inverse modeling approach in order to study biogeochemical cycles (e.g., the carbon cycle). The overarching challenge here is the consolidation and integration of the community data assimilation efforts of the meteorological and space agencies, of research and operational activities, and from in situ and satellite observational platforms, including all continental and global collaborations, and the effective application of these efforts toward the development of new missions in earth observation.

Challenge 2: Small Scale Processes in the Atmosphere

Several challenges are apparent in terms of our fundamental understanding of small scale processes and related applications, many of which are in currently being actively debated and studied. First, increased computational power allows the more detailed simulation of fluid mechanics problems, thus, even stably stratified flows are now modeled by direct numerical simulation. At the same time, these advanced computational techniques also require a new generation of parameterization schemes for numerical weather prediction (NWP) and climate modeling. At high resolutions, for example, the complex dynamics that occur in urban areas cannot be neglected and specific NWP schemes to represent these are required. At smaller grid sizes the so-called gray zone of turbulence is approached in NWP, and the impact of this must be understood and quantified. There is some room for improvement in terms of the representation of clouds and of the diurnal cycle of deep convection, and the same also applies to the physical processes that govern the stable boundary layers and the diurnal cycle, and the intermittent nature of turbulence, especially under calm conditions. In addition, higher resolutions also require more advanced techniques to allow the interpretation of the observations made. In boundary-layer meteorology, the closure of the surface energy balance and the heat budget in field observations requires further attention. Finally, the data challenges facing meteorology will also increase, due in particular to the greater availability of both professional and crowd-sourced observations (Muller et al., 2013).

Challenge 3: Air Pollution Chemistry

The key components of a program to address the most important challenges for researchers in air pollution chemistry may be described under the following three headings: (1) Indoor Pollution and health: given the tendency for people to remain largely indoors for work, school, and leisure, it is important to study the impact of indoor pollution on human health as a result of indoor emissions and/or the infiltration of the external ambient air. In recent years the processes that govern indoor air quality have changed markedly as result of modifications to building regulations with the aim of better energy efficiency. There are still considerable unknowns in relation to the sources, compounds and processes that affect indoor air quality and its impact on human well being. (2) Dust and air quality: with continuous improvements in the characteristics of vehicle emissions, the effects of aerosol pollution in urban areas can now increasingly be traced to other sources of emissions, such as the transport of natural dust and the resuspension of road dust, mainly in southern European areas with drier climates in areas affected by the transport of dust from the deserts of North Africa. An understanding of these impacts and the application of mitigation measures (for road dust resuspension) are both areas of future research. (3) Biomass burning: with climate change and concerns about the impact and cost of fossil fuels, biomass combustion is now commonly used for domestic heating in Europe. In many urban areas, principally in winter, domestic biomass has been found to be an important source of air pollution by particulates. Ar present some emphasis is being placed on the evaluation of the impact of biomass burning in terms of urban air quality as well as in terms of the study of the emission characteristics of biomass burning equipment and installations, as well as on the impact of the composition of biomass burned particles on human health.

Challenge 4: Aerosol-Cloud Interactions

There is no doubt that aerosol particles are actively involved in cloud formation via the supply of cloud condensation nuclei (CCN) and ice nuclei (IN). It has been suggested that changes in aerosol concentrations will alter cloud lifetimes and precipitation efficiency, and hence affect the radiative forcing of the earth system. Great efforts have been devoted to this topic, resulting in rapid developments in terms of knowledge, methodologies, and techniques (e.g., Wang, 2013). Despite this progress, it is still difficult to draw any meaningful conclusions about the climatological effects of aerosols at regional and global scales. In contrast, aerosol-cloud interactions at molecular and microphysical scales have become more and more predictable and its modeling more deterministic. There appears to be a significant gap in our knowledge between the small-scale (molecular and microphysical) processes and the large-scale (regional/global) events in this area. We suggest that there remains a need to synthesize multi-scale results to identify clearly the problems involved and to improve the current set of tools and methodologies required to close the gap.

Challenge 5: Weather Prediction


Phenomena described by fluids are complex, however, the appearance of the laws of fluid motion is deceitfully simple, equations governing these laws are non-linear, what implies multiple (and hard to understand) types of feedback effects. The atmosphere and the temporal evolution of its state does not deliver from this problem. In any case one of the flagships of the body of research on atmospheric sciences over the last few decades has been the establishment of reliable forecasting in the 2–7-day range, in view of the enormous potential economic benefits; however, such techniques still suffer from problems derived from the collection and utilization of data, which are mostly collected over the oceans. The use of new data from satellites and ground-based remote sensing could help in this regard, as could the correct maintenance of traditional data sets such as the now some what outdated global rawinsonde network. Improvements in measurements of water vapour and land surface properties are also priorities. The physical challenges continue to be the same as they were when defined more than a decade ago (National Research Council, 1998), namely: a better understanding of the nature of the interaction between atmospheric and land surface processes, the hydrological cycle, the dynamics of deep convection, the role of the tropopause in atmospheric dynamics, a fresh impetus in the development of mesoscale models and an improvement in the parameterizations used in the wave-based models of weather and climate. An example of the importance of these improvements is orographic gravity wave drag, whose parameterization in weather and climate prediction models needs to be updated given the importance of some effects shown to be important in recent research. Among these is the impact of wind shear on both the surface drag and the wave momentum flux (and its dissipation), and the drag produced by trapped lee waves, whose energy propagates, and is dissipated, downstream of their source rather than upwards. The implications of these orographic gravity waves for clear-air-turbulence (CAT), a very serious aviation hazard, have not been satisfactorily quantified. Most CAT forecast methods use empirical predictors not explicitly linked to gravity waves, but it is well known that directional shear (which is ubiquitous in nature) leads to gravity wave breaking, which may be an important source of CAT. The trapping of gravity waves in the lee of mountains or hills leads to the formation of unsteady, turbulent, closed circulations known as rotors, which are also a serious aviation hazard. Our understanding of the conditions necessary for the onset of these flow structures is incomplete, and will no doubt benefit from recent advances in mountain wave theory.

Challenge 6: Remote Sensing for Meteorology and Climate

Ground-based and satellite remote sensing has provided major advances in our understanding of both the weather and the climate systems, as well as the changes in these (Yang et al., 2013), by allowing the quantification of the processes and spatio-temporal states of the atmosphere, land, and oceans. The intensive use of satellite imagery in meteorology, and spatial patterns of sea level rise, provide good examples of this. The duration of the time series concerned are usually too short to allow their use for capturing long term trends of many climate variables, so one major challenge is to extend the durations of these time series. Remote sensing of the regional and global cycles of clouds and precipitation is also necessary for climate monitoring and the verification of model outputs. There are two notable challenges in atmospheric physics; the first is to design innovative studies focusing on cloud microphysics and the relationship with the physics of lightning discharge, together with all aspects related to the observation and measurement of atmospheric electricity, and the second is to develop new passive radiometer and radar studies to help us to understand the structure of clouds and precipitation with special emphasis on tropical warm rain processes, mid-latitude light precipitation, snowfall, cloud liquid and ice water content, precipitable water and water vapour profiles. One hydrometeorological challenge is to extend and improve our observations and modeling of the atmospheric and continental parts of the water cycle in order to allow its closure (e.g., mountain areas, polar regions).

Challenge 7: The Atmospheric Branch of the Hydrological Cycle


Among the many challenges related to the hydrological cycle, those concerned with the atmospheric transport of moisture must receive special mention because of their existence entirely within the realm of the atmospheric sciences. Here we consider the most pressing of the challenges described in the recent review of Gimeno et al. (2012). The diagnosis of moisture sources has become a major research tool in the analysis of extreme events (e.g., floods, droughts), and can be thought of as a basic tool for regional and global climatic assessments; it is therefore, necessary to check the consistency of the different approaches used to establish source-sink relationships for atmospheric water vapour. Of key importance is the improvement of our understanding of how sources of moisture affect precipitation isotopes; this is important in and of itself but it is also crucial for correctly interpreting the most prominent paleoclimatic archives including ice cores and cave sediments. A further challenge is the better understanding of the role of the transport of moisture as the main factor responsible for meteorological extremes (heavy rainfall via structures such as low level jets and atmospheric rivers, or drought via the prolonged diminished supply of water vapor from moisture source regions). In order to assess whether the moisture source regions have remained stationary in past years, it is necessary to understand the effects of the main modes of climate variability on the variability of the moisture regions, and how the transport of moisture occurs in a changing climate. These unsolved questions constitute a substantial challenge for climate scientists.

Challenge 8: Interaction of Scales in Climate Simulation


The interaction among various spatial and temporal scales results in what we call climate. (Lorenz 1967) was among the first to emphasize the importance of scale interactions in explaining some of the key characteristics of climate observed in various regions. The non-linear character of most of these scale interactions has made them difficult to model, and as a consequence this still constitutes a source of uncertainty in climate simulations. Some empirical methods have been proposed to downscale the output from climate models but these are still somewhat controversial (Pielke and Wilby, 2011), particularly when used to interpret long term climate projections at a regional scale. The use of boundary conditions from an global model in which coupled interactions among all the major subsystems of the climate system (atmosphere, ocean, biosphere, and cryosphere) are predicted has a number of problems as the retention of large-scale climate errors in the global models, its great dependence on the lateral boundary conditions or the lack of two-way interaction between the regional and global models. The role of small scale atmospheric processes, usually in short lived phenomena, turns to be highly relevant particularly in tropical regions, where mesoscale convective systems interact with large scale circulations, and are of crucial importance in the hydrological cycle. For example, tropical cyclones may result in very wet or dry years in some regions depending on their activity and trajectory. This element is rather difficult to simulate in climate models, but its contribution to regional climate is beyond doubt and must be better understood in order to incorporate it into climate modeling systems.

Challenge 9: Extreme Events


In recent years the effects of different meteorological and climate phenomena have gained in importance in the eyes of the media and the population as a whole, partly as a consequence of extreme events such as the heatwaves in Europe (2003), Russia (2010), or USA (2011), or the deadly and extremely costly hurricanes that have hit densely populated areas in recent years, including New Orleans (Katrina, 2005) and the Metropolitan area of New York (Sandy, 2012). Likewise, prolonged periods of drought have caused severe problems for cereal producers, including in southern Australia (2002–2010), or the south-western USA, or via the increased likelihood of forest fires (Amazonia, 2005 and 2010). Some of these extreme events are closely related to the occurrence of vigorous circulation patterns such as the North Atlantic Oscillation (NAO), or to blocking and the displacement of storm tracks and the jet stream. By definition, extremes are rare in a time series, there is therefore, a pressing need, linked to the analysis of extreme events, to extend the climatic series as far as possible, and for this reason reconstructions of the past climate based on instrumental, historical and proxy data continue to be indispensable. The recent IPCC report (IPCC, 2013) shows that this growing interest in climatic extreme events must be addressed within the wider context of climate change, given that the expected changes in global, regional and even local climates are most likely to be felt through changes in the magnitude and frequency of extreme events.

Challenge 10: Solar Influence on Climate

It has been estimated that about 8% of recent global climate change can be attributed to solar variability, but this figure must be treated with caution given that a number of aspects of solar forcing and the mechanisms coupling solar variability to the earth's climate system remain poorly understood (Gray et al., 2010). With the increasing complexity and sophistication of atmospheric and climate models, and the need for increased accuracy of the predictions made, it is important to able to include a more complete picture of solar forcing in these models. Sources of solar forcing can be divided into radiatively and particle driven components. The scientific focus for the radiatively driven forcing is currently shifting from the global to the regional responses as driven by variations in solar spectral irradiance (SSI). A number of questions remain about the nature of the variations in SSI, how these should be implemented in models, and how they will change in future solar cycles if the sun moves away from its current grand maximum of solar activity toward a new maunder minimum. The particle driven component is further divided into energetic particle precipitation (EPP) and cosmic ray (CR) effects. The EPP effect initially influences the upper stratosphere and lower thermosphere. While the chemical effects of EPP on the atmosphere are now well understood, there is a pressing need to understand further dynamical effects, as well as the potential mechanisms and magnitudes in terms of the earth's climate. The potential influence of EPP on climate is an emerging research area, and is one that is assuming a greater importance now that climate models are extending to higher altitudes that are more directly influenced by EPP. EPP provides one of the key transport pathways from the lower thermosphere down to the stratosphere and beyond, down to the troposphere via stratosphere-troposphere coupling in the polar regions. The effect of EPP could also become more pronounced in the near future as radiative forcing becomes more influenced by a move to maunder minimum types of solar activity. The CR driven component is currently considered to be the least well understood of the sources of solar forcing, although dedicated ongoing international research efforts are being made to address this question. Resent results have suggested that although CRs may stimulate aerosol nucleation, in global terms these effects are not great, and questions remain on the physical mechanisms linking CRs and aerosol nucleation.

Challenge 11: Urban Weather and Climate


The urban heat island (UHI) is perhaps the best known effect of the presence of cities on the local microclimate; the air temperature in a city at night can be much higher (up to 10°C or more) than in the surrounding area. Urban Climate, an emerging branch of meteorology 20 years ago, is now a mature field of research. It covers a range of topics, from fundamental theoretical studies to more applied research, having as its main goal the application of climatic knowledge to the better design of cities around the world. Micrometeorology has always been a core area of interest in urban studies because of the scales involved. Urban climatology instrumentalists have pioneered the continuous development of instrumentation and process analysis ever since the 1970s. The processes leading to the formation of the UHI (mostly physical in nature due to the 3D shape and the materials that make up the urban fabric), emerged from these early studies. Today, a number of challenges remain in relation to the measurement of this rather complex urban boundary layer. New short-range teledetection instruments are being used to gain a specialist view of the physical processes involved. Such instrumental developments will inevitably continue. Urban climate was only tackled by atmospheric modellers when the atmospheric models reached a sufficiently high resolution (a few km) to be able to represent cities explicitly. The first models representing the exchanges of energy and water between urban surfaces and the atmosphere appeared in the early 2000s (see reviews inMasson, 2006 and Martilli, 2007), and are now being used more and more in numerical weather forecasting models. The first international intercomparisons of urban models (Grimmond et al., 2010,2011) discussed some obvious means of improvement, for example in the representation of urban vegetation. In addition, approximately 15 years later than atmospheric models, regional climate models now have spatial resolutions compatible with urban scales. This of course presents a new challenge in the proper representation of cities in climate models. Similarly, urban meteorology studies cannot be limited to physics or chemistry, but must take account of the behavior of the inhabitants. Although biometeorological studies already exist, especially in terms of levels of human comfort, the interactions between the meteorological and social worlds, both in terms of human comfort but also in terms of meteorologically dependant energy use, for example, still form one of the main challenges for urban meteorologists.

Challenge 12: Ozone Depletion and Recovery

Although stratospheric ozone concentration minima are still seen in many regions, signs of recovery are beginning to be perceived. In the Antarctic stratosphere the concentration of halocarbons peaked around the year 2000 and then began to diminish. Current projections suggest that complete recovery could occur around the year 2050. This means that one of the major challenges is to ensure the continued monitoring both of ozone and of ozone-depleting gases in order to guarantee the recovery. Improvements in the basic understanding of processes, and simulations thereof, are especially important in the context of a changing climate. Both directions must be simulated, i.e., how a changing climate will affect the ozone layer, and how the recovery of the ozone will affect weather and climate. The so-called climate-chemistry models (CCMs, Lamarque et al., 2013) appear to be of key importance in this case.

The foregoing list of challenges for the next few years in atmospheric sciences research relates only to a few of the most urgent unsolved questions and naturally remains incomplete. The challenges described herein must not be considered to be the likely principal research topics in Frontiers in Atmospheric Science; any interesting work linked to the umbrella of atmospheric science should find accommodation in the journal.

Friday, May 16, 2014

Skeptic paper rejected because computer models trump the 'new technology' of satellite observations

In response to the Times of London front page news on the clime syndicate's rejection of Dr. Lennart Bengtsson's skeptical paper, Environmental Research Letters has published a review of the paper, which includes among several frivolous reasons for rejection:
The IPCC "AR5 has not put so much weight on these satellite observations, due to still persisting potential problems with this new technology"
Paraphrasing, satellite observations are newfangled [35 year old] technology that still can’t be trusted, but climate models are golden. 
"the models are calculating true global means, whereas the observations have limited coverage"
Paraphrasing, only computer models [which have already been falsified at confidence levels of 95% to 98%+] can determine the "true" global temperature, not satellite observations. 


Dr. Roy Spencer comments on the Bengtsson paper rejection today,
"this seems to be the direction the IPCC is going, too. If the models and the observations disagree, the observations must be wrong."
A host of other frivolous and political reasons for rejecting the paper are in the full review below with added comments and emphasis.

COMMENTS TO THE AUTHOR(S)  
The manuscript uses a simple energy budget equation (as employed e.g. by Gregory et al 2004, 2008, Otto et al 2013) to test the consistency between three recent "assessments" of radiative forcing and climate sensitivity (not really equilibrium climate sensitivity in the case of observational studies).

The study finds significant differences between the three assessments and also finds that the independent assessments of forcing and climate sensitivity within AR5 are not consistent if one assumes the simple energy balance model to be a perfect description of reality.[Doubtful that Bengtsson's paper would claim any model was a "perfect description of reality"]

The overall innovation of the manuscript is very low, as the calculations made to compare the three studies are already available within each of the sources, most directly in Otto et al. [What's wrong with a paper that reviews compiles data/models from different studies to show consistencies & inconsistencies? There are tens of thousands of such published papers in the scientific literature]

The finding of differences between the three "assessments" and within the assessments (AR5), when assuming the energy balance model to be right, and compared to the CMIP5 models are reported as apparent inconsistencies.[Again doubtful that Bengtsson made the claim that any model was "right" or a 
"perfect description of reality"]

The paper does not make any significant attempt at explaining or understanding the differences, it rather puts out a very simplistic negative message giving at least the implicit impression of "errors" being made within and between these assessments, e.g. by emphasising the overlap of authors on two of the three studies. [In other words, Bengtsson's paper did not actually accuse any other authors of errors, and this "implicit impression" is the opinion of the reviewer]

What a paper with this message should have done instead is recognising and explaining a series of "reasons" and "causes" for the differences. [why the quote marks around "reasons" and "causes"? These would be mere speculation anyway given the black box nature of climate models]

- The comparison between observation based estimates of ECS and TCR (which would have been far more interesting and less impacted by the large uncertainty about the heat content change relative to the 19th century) and model based estimates is comparing apples and pears, as the models are calculating true global means, whereas the observations have limited coverage. This difference has been emphasised in a recent contribution by Kevin Cowtan, 2013. [Cowtan debunked]
- The differences in the forcing estimates used e.g. between Otto et al 2013 and AR5 are not some "unexplainable change of mind of the same group of authors" but are following different tow different logics, and also two different (if only slightly) methods of compiling aggregate uncertainties relative to the reference period, i.e. the Otto et al forcing is deliberately "adjusted" to represent more closely recent observations, whereas AR5 has not put so much weight on these satellite observations, due to still persisting potential problems with this new technology. [Paraphrasing, satellite observations are newfangled technology that can’t be trusted, but climate models are golden. And as if the tampered, up-justed, UHI contaminated surface thermometer record is superior to satellite observations]
- The IPCC process itself explains potential inconsistencies under the strict requirement of a simplistic energy balance: The different estimates for temperature, heat uptake, forcing, and ECS and TCR are made within different working groups, at slightly different points in time, and with potentially different emphasis on different data sources. The IPCC estimates of different quantities are not based on single data sources, nor on a fixed set of models, but by construction are expert based assessments based on a multitude of sources. Hence the expectation that all expert estimates are completely consistent within a simple energy balance model is unfunded from the beginning.
- Even more so, as the very application of the Kappa model (the simple energy balance model employed in this work, in Otto et al, and Gregory 2004) comes with a note of caution, as it is well known (and stated in all these studies) to underestimate ECS, compared to a model with more time-scales and potential non-linearities (hence again no wonder that CMIP5 doesn't fit the same ranges). [Otto et al finds equilibrium climate sensitivity [ECS] at the top of the atmosphere is only slightly higher [1.3X] than transient climate sensitivity [TCS]]
Summarising, the simplistic comparison of ranges from AR4, AR5, and Otto et al, combined with the statement they they are inconsistent is less then helpful, actually it is harmful as it opens the door for oversimplified claims of "errors" and worse from the climate sceptics media side. [i.e. this rejection is all about politics, not science, and this confirms the clear bias of the reviewer]
One cannot and should not simply interpret the IPCCs ranges for AR4 or 5 as confidence intervals or pdfs and hence they are not directly comparable to observation based intervals (as e.g. in Otto et al).
In the same way that one cannot expect a nice fit between observational studies and the CMIP5 models.[Thus, expecting the models to agree with observed reality is considered to the error of Bengtsson's paper]

A careful, constructive, and comprehensive analysis of what these ranges mean, and how they come to be different, and what underlying problems these comparisons bring would indeed be a valuable contribution to the debate.
I have rated the potential impact in the field as high, but I have to emphasise that this would be a strongly negative impact, as it does not clarify anything but puts up the (false) claim of some big inconsistency, where no consistency was to be expected in the first place.[false, of course there should be at least some consistency between models and observations]
And I can't see an honest attempt of constructive explanation in the manuscript.

Thus I would strongly advise rejecting the manuscript in its current form.

UPDATE: See Steve McIntyre's post today:

IOP: expecting consistency between models and observations is an “error”

Tuesday, March 25, 2014

New paper finds "surprisingly, there are many US weather stations that show cooling" over the past century

A paper published today in the Journal of Climate finds, contrary to popular belief, that US "monthly maximum temperatures are not often greatly changing — perhaps surprisingly, there are many stations that show some cooling [over the past century]. In contrast, the minimum temperatures show significant warming. Overall, the Southeastern United States shows the least warming (even some cooling), and the Western United States, Northern Midwest, and New England have experienced the most warming."

In essence, this paper is saying the weather/climate has become less extreme, with little to no change in maximum temperatures "and even some cooling" of maximum temperatures in some stations, and warming of minimum temperatures. Thus the temperature range between minimum and maximum temperatures has decreased, a less extreme, more benign climate.


According to the paper, the warming in minimum temperatures is regional, with the SE US showing "the least warming (even some cooling)," suggesting that other processes such as ocean and atmospheric oscillations are responsible, rather than a uniform warming from AGW.

Note these results are after the huge up-justments made to the US temperature data and urban heat island [UHI] artificial warming, which could account for all or most of the warming of minimum temperatures. 

http://stevengoddard.wordpress.com/2014/03/15/ncdc-data-tampering-is-one-of-the-biggest-frauds-in-science-history/
UPDATE: Graph from Verity Jones from the cross-post at WUWT showing cooling stations in blue/green in not only the SE US, but nationwide:


Trends in Extreme United States Temperatures

Jaechoul Lee*
Department of Mathematics, Boise State University, Boise, Idaho
Shanghong Li and Robert Lund
Department of Mathematical Sciences, Clemson University, Clemson, South Carolina

Abstract
This paper develops trend estimation techniques for monthly maximum and minimum temperature time series observed in the conterminous 48 United States over the last century. While most scientists concur that this region has warmed on aggregate, there is no a priori reason to believe that temporal trends in extremes and averages will exhibit the same patterns. Indeed, under minor regularity conditions, the sample partial sum and maximum of stationary time series are asymptotically independent (statistically). Previous authors have suggested that minimum temperatures are warming faster than maximum temperatures in the United States; such an aspect can be investigated via our methods. Here, statistical models with extreme value and changepoint features are used to estimate trends and their standard errors. A spatial smoothing is then done to extract general structure. The results show that monthly maximum temperatures are not often greatly changing — perhaps surprisingly, there are many stations that show some cooling. In contrast, the minimum temperatures show significant warming. Overall, the Southeastern United States shows the least warming (even some cooling), and the Western United States, Northern Midwest, and New England have experienced the most warming.

Thursday, February 27, 2014

New paper finds 100% of the trend in number of "hot days" is artificial, due to poor-siting of thermometers, not global warming

A paper published today in Theoretical and Applied Climatology examines the effect of urbanization on extreme temperature readings in North China and finds statistically significant evidence that urbanization [the Urban Heat Island [UHI] effect] is responsible for 100% of the artificial trend in number of hot days, and 94.1% of the artificial trend in extreme maximum temperatures. In other words, 100% of the reported trends in the number of hot days are due to poor-siting of temperature stations, and have absolutely nothing to do with alleged man-made global warming.

The artificial urbanization contributions to overall trends reported by the authors are:

Urbanization contributions to the overall trends:

hot days 100%

cold days 38%

frost days 42.2%

diurnal temperature range (DTR) 40%

extreme maximum temperature 94.1%

extreme minimum temperature 47%


Monday, February 24, 2014

Three new papers find most of the alleged global warming since 1850 is artificial

A family of scientists have submitted for open peer review 3 new papers which demonstrate that almost all of the alleged global warming of 0.7C since 1850 is artificial due to poor-siting of thermometers in urban areas. The authors also examined one of the computer programs designed to remove the "urban heat island" [UHI] bias in global temperature datasets and found errors in the program which actually increased the artificial urban heat bias. 

The papers corroborate prior work by Joe D'Aleo and Anthony Watts, as well as other peer-reviewed publications finding most to all of the alleged global warming over the 20th century may be entirely artificial and inadequately removed by homogenization procedures. 

The same authors have also submitted for open peer review 3 other papers challenging the conventional view of the physics of the atmosphere and the "greenhouse effect."

Summary: “Urbanization bias” – Papers 1-3

December 5, 2013  Our papers,   Temperature records

Many areas around the world have become highly urbanized over the last century or so. Records of weather stations which are located in urbanized areas may show artifical warming trends due to urbanization bias. In this essay, we summarise the main points of our three “Urbanization bias” papers, which we have submitted for peer review at the Open Peer Review Journal.
It has been known since at least the 19th century that urban areas are warmer than rural areas. This is known as the “urban heat island” effect.

This is a serious problem for estimating global temperature trends because many weather stations are now showing warming from an urban heat island, which wouldn’t have been there 100 years ago. That is, gradual urbanization has introduced an artificial warming bias into their weather records. This bias is called “urbanization bias”.

Since the 19th century, and particularly in the last few decades, the world has become increasingly urbanized. Urban areas still only comprise about 1%. So, this doesn’t really have much impact on actual global temperature trends. But, about half of the weather stations used for analysing global temperatures are in urban areas. As a result, the estimated global temperature trends are seriously affected by this bias.

These estimated global temperature trends are the main basis for the claims that there has been “unusual global warming” since the Industrial Revolution. This means that much of the “global warming” that people are worried about is probably just urbanization bias!

Despite that, several studies have claimed that urbanization bias isn’t a problem. So, in Paper 1, we carefully analysed these studies to see if their claims were justified. In all cases, we found that they weren’t! It turns out that the authors of those studies had each made basic errors and/or hadn’t looked at their data carefully enough.

One of the groups using weather records to calculate global temperature trends has developed a computer program which they believe has removed the urbanization biases from their data. However, in Paper 2, we analysed this program in detail and found that it didn’t work. It actually introduced as many biases as it removed!

In Paper 3, we studied the main weather station archives used for calculating global temperature trends, i.e., the Historical Climatology Network datasets.

The U.S. component of the datasets was the most reliable component and most of the U.S. stations were fairly rural. However, we found that urbanization bias had introduced an artificial warming trend of about 0.7°C/century into the urban stations. To put this in context, the “unusual global warming” that has allegedly occurred since the Industrial Revolution is supposedly about 0.8°C/century.

For the rest of the world, the Historical Climatology Network datasets didn’t actually have enough rural stations with sufficiently long records to estimate global temperature trends. Only EIGHT of the rural stations had data for at least 95 of the last 100 years!

This means that the claims that there has been “unusual global warming since the Industrial Revolution” are mostly based on data from urban stations, and much of it is probably an artefact of urbanization bias.


1. Introduction
2. What is the urban heat island problem?
3. Isn’t there other evidence for global warming?
4. Paper 1. Is urbanization bias a negligible problem?
5. Paper 2. An assessment of the NASA GISS urbanization adjustment method
6. Paper 3. How heavily urbanized are the stations used in the global temperature estimates?
7. Conclusions

1. Introduction

The main basis for the claim that there has been “unusual” global warming since the Industrial Revolution arises from the various global temperature estimates constructed from weather station records. Currently there are 5 groups publishing such estimates:


NASA Goddard Institute for Space Studies (New York City, USA)
Climate Research Unit, University of East Anglia (East Anglia, UK).
NOAA National Climatic Data Center (North Carolina, USA)
Tokyo Climate Center, Japan Meteorological Agency (Tokyo, Japan)
Berkeley Earth (California, USA)

A sixth group (originally based in Russia, but now based in USA) also updated their analysis in 2006 – see Lugina et al., 2006, Carbon Dioxide Information Analysis Center (Tennessee, USA).


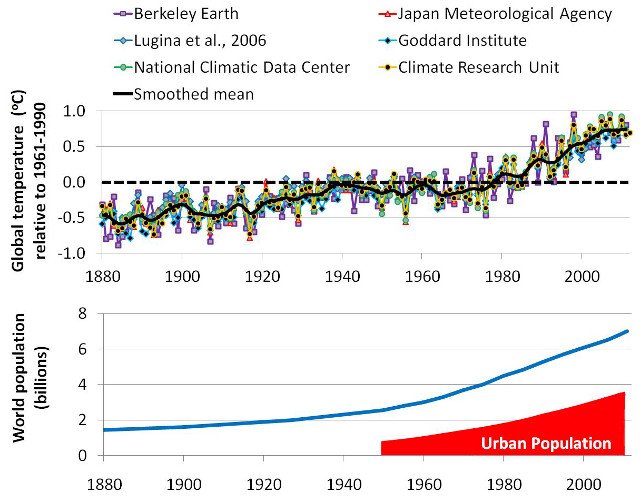
Figure 1. Comparison between the various weather station-based global temperature estimates, relative to 1961-1990. The solid black line represents the smoothed mean of all estimates.

All estimates imply that there has been an almost continuous 'global warming' since 1880. Many people have blamed this on the increase in CO2 concentrations since the Industrial Revolution. However, this period has also seen a dramatic increase in urban population (bottom panel). So, much of theapparent 'global warming' might just be urbanization bias. Click on image to enlarge.As can be seen from Figure 1, all of these global temperature estimates give pretty much the same result. Since the start of each estimate (usually 1880), they all suggest that global temperatures have been fairly steadily increasing by about 0.8°C/century.

Atmospheric carbon dioxide (CO2) concentrations have also been steadily rising since the late 19th century, and man-made global warming theory predicts that increasing carbon dioxide should cause “man-made global warming”. For this reason, many supporters of the theory assume that this apparent “global warming” is the “man-made global warming” their theory had predicted.

This has convinced many people that:
The man-made global warming theory must be correct
The weather station-based global warming estimates must be accurate

However, as we will discuss in this essay, many of the weather station records used for these estimates of global warming contain artificial warming biases, which are not representative of actual global temperatures.

The problem is that most weather station records are not kept for monitoring long term temperature trends. Instead, they are usually used for making more accurate weather forecasts, making farming decisions, helping air traffic control, and other similar short-term decisions.

A consequence of this is that the long-term records contain a lot of “non-climatic biases”. These are temperature changes which are not climatic, but are due to local changes in the station and its environment over the decades and centuries.

For example, if a station is re-located, a new type of thermometer is introduced, or new buildings are built to accommodate the staff, this could alter the temperature of the air in the immediate vicinity of the thermometer. If these local changes are not taken into account when the long-term temperature record is being analysed, this would mistakenly leave the impression that the climate itself had changed. In reality, it is only a change in themeasured temperature, not a change in the actual climatic temperature.

This means that the temperature trends in any weather station record are a combination of:
Actual climatic trends for the region
Non-climatic biases

One of the biggest problems in accurately calculating “global temperature” trends from weather records is in separating the two, and only including the actual climatic trends.

This is not easy. In fact, it is very challenging, e.g., see Mitchell, 1953 (Open access).

Our analysis shows that the 6 groups we mentioned above that have being calculating the “global warming” trends didn’t do a good enough job in accounting for these biases. They seem to have severely underestimated just how tricky a job it actually is.

Chief amongst these non-climatic biases is urbanization bias, and this is the focus of this essay.
On this website, we usually use the U.K. spelling for most words instead of the U.S. spelling, but most of the literature on urban heat islands uses the U.S. spelling, e.g., “urbanization” instead of “urbanisation”. So, in our papers and in this essay, we use the U.S. spelling for urbanization.

In general, urban areas tend to be warmer than rural areas. If you are a car owner and have a thermometer in your car, you may have noticed this, i.e., the temperature generally rises when you drive into an urban area and decreases when you leave an urban area.

As a result of this extra urban warmth, if a weather station becomes urbanized, this introduces an artificial warming bias into the station’s record, i.e., urbanization bias.

If a substantial fraction of all the weather stations from around the world have been affected by urbanization bias, then this could have introduced an artificial warming trend into the “global temperature trend” estimates. That would mean that some (or even all!) of the alleged “unusual global warming” since the Industrial Revolution is just an artefact of urbanization bias!

With this in mind, we decided it was to important to carefully investigate the urbanization bias problem, and check if it had been adequately dealt with. We have written a series of three companion papers describing the results of our investigation, and have submitted them for peer review on the Open Peer Review Journal forum we founded:

Urbanization bias I. Is it a negligible problem for global temperature estimates? – Ronan Connolly & Michael Connolly, 2014a
Urbanization bias II. An assessment of the NASA GISS urbanization adjustment method– Ronan Connolly & Michael Connolly, 2014b
Urbanization bias III. Estimating the extent of bias in the Historical Climatology Network datasets – Ronan Connolly & Michael Connolly, 2014c

Interested readers are welcome to read our three papers for a detailed assessment of the urbanization bias problem. However, each of the papers is quite long and technical, and so we have written this essay to provide a general overview of our main findings and conclusions.

In a nutshell, we found that urbanization bias has seriously affected the various global temperature trend estimates. It seems that most of the “unusual global warming” that we have heard so much about had absolutely nothing to do with our carbon footprint, but was just a consequence of urbanization bias!

The various attempts that have so far been made to deal with the urbanization bias problem have been woefully inadequate. In many cases, they actually seem to have made the problem even worse. The popular belief that the problem has been “dealt with” (e.g.,here, here, here, here, here, or here) just seems to be down to wishful thinking…

However, before we can discuss our findings, let us first consider in a bit more detail exactly what the urbanization bias problem is…

Monday, January 27, 2014

New paper finds adjusted temperature data in China has significantly exaggerated warming

A paper published today in Theoretical and Applied Climatology finds that the data homogenization techniques commonly used to adjust temperature records for moving stations and the urban heat island effect [UHI] can result in a "significant" exaggeration of warming trends in the homogenized record. 

According to the authors, "Our analysis shows that "data homogenization for [temperature] stations moved from downtowns to suburbs can lead to a significant overestimate of rising trends of surface air temperature."

The paper corroborates the prior work of Anthony Watts, Joseph D'Aleo, et al, finding leading meteorological institutions in the USA and around the world have so systematically tampered with instrumental temperature data that it cannot be safely said that there has been any significant net “global warming” in the 20th century.

Theoretical and Applied Climatology February 2014, Volume 115, Issue 3-4, pp 365-373,
Open Access


Effect of data homogenization on estimate of temperature trend: a case of Huairou station in Beijing Municipality

Lei Zhang,
Guo-Yu Ren,
Yu-Yu Ren,
Ai-Ying Zhang,
Zi-Ying Chu,
Ya-Qing Zhou

Download PDF (531 KB)


Abstract

Daily minimum temperature (Tmin) and maximum temperature (Tmax) data of Huairou station in Beijing from 1960 to 2008 are examined and adjusted for inhomogeneities by applying the data of two nearby reference stations. Urban effects on the linear trends of the original and adjusted temperature series are estimated and compared. Results show that relocations of station cause obvious discontinuities in the data series, and one of the discontinuities for Tmin are highly significant when the station was moved from downtown to suburb in 1996. The daily Tmin and Tmax data are adjusted for the inhomogeneities. The mean annual Tmin and Tmax at Huairou station drop by 1.377°C and 0.271°C respectively after homogenization. The adjustments for Tmin are larger than those for Tmax, especially in winter, and the seasonal differences of the adjustments are generally more obvious for Tmin than for Tmax. Urban effects on annual mean Tmin and Tmax trends are −0.004°C/10 year and −0.035°C/10 year respectively for the original data, but they increase to 0.388°C/10 year and 0.096°C/10 year respectively for the adjusted data. The increase is more significant for the annual mean Tmin series. Urban contributions to the overall trends of annual mean Tmin and Tmax reach 100% and 28.8% respectively for the adjusted data. Our analysis shows that data homogenization for the stations moved from downtowns to suburbs can lead to a significant overestimate of rising trends of surface air temperature, and this necessitates a careful evaluation and adjustment for urban biases before the data are applied in analyses of local and regional climate change

Related:

New paper asks: 'Would the 'real' temperature dataset please stand up?'; finds 'We have no ability to know' the true temperature data

It's Official: 2013 was the 4th7th10th107th... warmest year since the Little Ice Age

Would You Like Your Temperature Data Homogenized, or Pasteurized?


[Illustrations, footnotes and references available in PDF version]
Updated August 27, 2010 This paper is, as intended, a work in progress as a compilation of what’s current and important relative to the data sets used for formulating and implementing unprecedented policy decisions seeking a radical transformation of our society and institutions.
Authors veteran meteorologists Joe D’Aleo and Anthony Watts analyzed temperature records from all around the world for a major SPPI paper, Surface Temperature Records – Policy-driven Deception? The startling conclusion that we cannot tell whether there was any significant “global warming” at all in the 20th century is based on numerous astonishing examples of manipulation and exaggeration of the true level and rate of “global warming”.
That is to say, leading meteorological institutions in the USA and around the world have so systematically tampered with instrumental temperature data that it cannot be safely said that there has been any significant net “global warming” in the 20th century.

Tuesday, January 21, 2014

It's Official: 2013 was the 4th7th10th107th... warmest year since the Little Ice Age

Surprisingly, official government temperature records disagree on how much global warming there was in 2013 in comparison other years that are statistically-insignificant-meaningless-hundredths-of-a-degree different. 

One thing is for sure, the globe has fortunately recovered from the Little Ice Age, which coincidentally ended in ~1850 at the start of the instrumental global temperature record, and which shows after UHI-artificial-warming and up-tampered data the temperature rise could have been as much as a whopping 0.7C since 1850. Not only that, the world's oceans have warmed 0.09C over the past 55 years alone!
Related:

A new paper published in Environmental Research Letters examines 8 datasets of temperature & precipitation observations in China over the past 105 years and finds significant unexplained differences between datasets, concluding, 
"Because observations coming from different datasets do have differences, which one we can believe among the various so-called ‘observed climate datasets’? Indeed, we have no ability to know the ‘truth value’"
Indeed, two of the Chinese datasets in the paper show there was essentially no warming in China from 1950-2005.

Furthermore, the paper notes that because we don't know which temperature datasets are correct [if any], climate models based upon flawed temperature data will result in erroneous "tuning" of climate models and therefore biased projections i.e. GIGO]. Excerpt from the conclusion:

All of these results bring about a new challenge in the field of climate change. So-called ‘observed climate datasets’ play important roles in driving hydrologic models, evaluating global circulation models (GCMs) and regional climate models (RCM). Because observations coming from different datasets do have differences, which one we can believe among the various so-called ‘observed climate datasets’? Indeed, we have no ability to know the ‘truth value’; what we need to do is reduce the disagreement among the ‘observed datasets’ and depress their uncertainty.
As lamented in Climategate emails by Phil Jones to James Hansen, if the Chinese stopped their commendable practice of moving thermometers away from contamination by the Urban Heat Island [UHI] effect and instead taken temperature readings contaminated by airport jet exhaust [as the rest of the world did], the Chinese temperature data would have shown more artificial warming.  

One can't deny that temperature data contradictions, contamination, errors and tampering are indeed a worldwide climate phenomenon. 

Related:

Phil Jones calculates 1850 SH temperature to a precision of 0.001, based on a single thermometer in Tasmania