Showing posts sorted by relevance for query 1976 standard. Sort by date Show all posts

Saturday, November 29, 2014

The Greenhouse Equation predicts temperatures within 0.28°C throughout entire troposphere without radiative forcing from greenhouse gases

In this continuing series of posts on the greenhouse equation, we will now calculate and plot the tropospheric temperature profile as a function only of the balance of radiative forcing from the Sun and gravitational forcing upon atmospheric mass, and without any contribution from greenhouse gas radiative forcing. We will see that the greenhouse equation reproduces observations and the 1976 standard atmosphere database within 0.28°C at every height from the surface all the way to the ~11,000 meter average height at the top of the troposphere. 

The greenhouse equation in essence determines the temperature based upon the balance of gravitational potential energy and radiative forcing from the only source of energy, the Sun, and is unique for each height from the surface to top of the troposphere. The greenhouse equation maintains the balance of solar/radiative and gravitational/convective equilibrium, and there is one and only one temperature that maintains this balance for each height in the troposphere. 

Note the only radiative forcing considered by the greenhouse equation is from the Sun, and nothing from greenhouse gases. The solar forcing warms the surface, which causes all gases to convect, rise, and expand, and which keeps the atmosphere inflated against the force of gravity, and these forces balance at every local height to maintain a horizontal local equilibrium at that particular height. Note the overall atmosphere is not in equilibrium, which is what drives this whole process of convection/adiabatic lapse rate/and the tropospheric temperature gradient.   

Thus, the opposing forces of convection and gravitation at each local height are in local equilibrium. The solar radiative forcing causes all gases at the surface to warm, rise, and expand against the gravitational force which is constantly pulling all gases back to the surface. Gravitational potential energy increases the higher a gas packet rises and expands, until that gas packet reaches a height where it's temperature is the same as the surrounding air, at which the gravitational potential energy starts to exceed its kinetic energy, then the gravitational potential energy accumulated takes over to make that gas packet subside/fall/compress and warm due to the ideal gas law. Once that gas packet becomes warm enough from compression to once again overcome gravitational potential energy, it starts to rise once again and that whole process continues over and over again ad infinitum. 

This rising/falling and expansion/compression of gas packets is thus driven by two opposing forces:
  • Solar radiative forcing to make gases warm, rise, and expand until they cool to the same temperature as the surrounding air, followed by 
  • Gravitational forcing pulling the now cooled gases back to the Earth
The balance between these two opposing forces is what generates the entire 33C greenhouse effect. Radiation spectra from greenhouse gases are the result, not the cause, of the temperature gradient in the troposphere that these two dominating, very strong, and opposing forces create. (As an example, in an earlier post, we calculated that the effect of gravity on the atmosphere is creating 10,500 kilograms of gravitational forcing per square meter at the surface.)

The greenhouse equation was derived in the recent series of posts: 


The "Greenhouse Equation" calculates temperature (T) at any location from the surface to the top of the troposphere as a function of atmospheric mass/gravity/pressure and radiative forcing from the Sun only, and without any radiative forcing from greenhouse gases. Note the pressure (P) divided by 2 in the greenhouse equation is the pressure at the center of mass of the atmosphere (after density correction), where the temperature and height are equal to the equilibrium temperature with the Sun and ERL respectively.
and I'll now show the unique numeric solutions perfectly reproduce within 0.28C the temperature at every height in the 1976 Standard Atmosphere database from the surface all the way to ~11,000 meters height, after which the atmosphere at < ~0.223 atmospheres (units) becomes too thin to sustain convection and the equation no longer applies. This is near the transition between the troposphere and tropopause, which is where Robinson & Catling, Nature 2014, demonstrated the transition begins due to loss of convection, not greenhouse gas radiative forcing. Above the tropopause transition level (which is isothermal for several km), increased greenhouse gases cause increased cooling

The greenhouse equation solves for the single unique temperature at every height necessary to balance the vertical equilibrium of the atmosphere (since gravitational forcing is vertical only). The atmosphere is in horizontal equilibrium at every height relative to the center of mass at that coordinate. The equation applies as long as the troposphere is capable of sustaining convection, up to ~12,000km in the tropics, but beyond that the atmosphere is too thin to sustain convection and the adiabatic lapse rate, thus the equation is not applicable above this point around 11-12 km average:


We find the greenhouse equation perfectly reproduces (within 0.28C) the standard tropospheric temperature profile (black=Standard Atmosphere, red=the greenhouse equation). Here's the data calculated by Wolfram Alpha for the greenhouse equation, and the 1976 Standard Atmosphere data:


height (km) Greenhouse Equation T in K Std Atmos 1976 T in K
0  288.433 288.15
1 281.933 281.65
2 275.433 275.15
3 268.933 268.65
4 262.433 262.15
5 255.933 255.65
6 249.433 249.15
7 242.933 242.65
8 236.433 236.15
9 229.933 229.65
10 223.433 223.15
11 216.933 216.65
12 210.433 216.65
13 203.933 216.65

1976 Standard Atmosphere:

(Note the greenhouse equation does correct for the change in density with pressure, and the natural logarithmic decay of pressure with altitude)


We annotate the plot which shows the height of the "effective radiating level" or ERL, the height at which the local horizontal equilibrium at that particular height must by definition be where T = equilibrium temperature with the Sun = 255K, at essentially exactly at the center of mass of the atmosphere, which has to coincide with the location where half of the mass is above and half below, where the pressure is one-half the surface pressure after altitude and density correction - both of which are done by the greenhouse equation (and is the reason for the natural logarithms in the equation):


There is nothing in the greenhouse equation which is dependent upon radiative forcing from greenhouse gases, nor greenhouse gas concentrations, nor greenhouse gas absorption/emission spectra, and yet we can perfectly reproduce the temperature within 0.28C anywhere in the troposphere and at the surface. Thus, the absorption and emissions of IR from greenhouse gases are the consequence, and not the cause of the real 33C greenhouse effect. 

Here are some of the numerical solutions from Wolfram Alpha which did the for the one and only unique value T that satisfies the greenhouse equation horizontal equilibrium at a particular height (s) in kilometers above the surface, which is the one and only variable that I changed for each of the these numeric solutions, as you can see from the input and Wolfram Alpha solutions:


Try it yourself: Here's the code for the greenhouse equation to determine the T at height = 0 (i.e. at the surface). I have bolded that 0 in the code below so you can find it. Simply change that variable from 0 to whatever height in kilometers from the surface to calculate the one and only unique local equilibrium at that particular height solution for the greenhouse equation temperature gradient:

T = [1367 (1 - 0.3) / (4*1* (5.6704*10^-8))]^1/4 +((-6.5)*(0-[-[8.31*{[1367 (1 - 0.3) / (4*1* (5.6704*10^-8))]^(1/4)}*log(1/2)]/[9.8*0.029*log(e)]/1000]))

Thursday, December 11, 2014

Why Atmospheric Temperature is a Linear Function of Mass & Gravity, and Not Influenced by Greenhouse Gas Concentrations

In the previous post of this series, we demonstrated why the US Standard Atmosphere Model & Observations Prove Maxwell's Mass/Gravity/Pressure Theory of the 'Greenhouse Effect' is Correct & Falsifies Anthropogenic Global Warming (CAGW).

We now show why the hundreds of rocket and atmospheric scientists, physicists, and aeronautical engineers who created the gold standard and final 1976 version of the US Standard Atmosphere Database (created during the ice age scare of the 1970's and just one decade prior to the global warming scare of the 1980's) in effect were "deniers" of any significant "radiative forcing," "heat trapping," or "radiative imbalance" from any greenhouse gases in their physical chemical calculations of the temperature profile of Earth's entire atmosphere from the surface all the way to the edge of space at ~100 kilometers altitude. 

In fact, the 241 page document provides overwhelming physical proof from physical chemistry and physics that the average annual temperatures at any altitude are controlled solely by molecular density, molecular weights, gravity, mass, pressure, etc. without any consideration of alleged "radiative forcing" or "heat trapping" from either natural or man-made CO2, nor any "radiative forcing" nor radiative considerations from any other gases including water vapor (now alleged to be the so-called 'primary greenhouse gas') whatsoever. The essential-to-CAGW claims of "radiative forcing," "heat trapping greenhouse gases," and "radiative imbalance from greenhouse gases" did not exist in 1976, and first appeared on the scene more than a decade later with James Hansen and the first IPCC 1990 report.

These pioneering atmospheric scientists calculated the effects of CO2 on the basis of the tiny 0.03-0.04% in the atmosphere (and thus contribution to molecular mass of the total atmosphere only ~0.03-0.04%) and found it to be so tiny and insignificant, that they removed CO2 from their 1-D model of the atmosphere completely. Their model was then used to calculate the US Standard Atmosphere database at every altitude from the surface to 100 km, and then overwhelmingly verified with millions of observations from weather balloons, research flights, rocket launches, etc. and found to accurately reproduce the temperatures on an annual basis at every altitude 0-120km within Earth's atmosphere, while completely omitting any mass, radiative, or any other effects from CO2 whatsoever.

In physics, the Stefan-Boltzmann equation is essential to calculate radiative emissions as a function of temperature (to the fourth power), but does not appear even one single time in any of the calculations in the 241 page US Standard Atmosphere description document or in their atmospheric model calculations. The Stefan-Boltzmann constant, which is absolutely essential to any radiative calculations from greenhouse gases or any gases or solid bodies also does not even appear once in the extensive tables of constants and definitions used in all of the calculations of the standard atmosphere, proving radiative considerations from any greenhouse gases are completely unnecessary to determine the average temperatures anywhere from the surface to the edge of space, and also that greenhouse gases have no radiative influence whatsoever upon the ~7 different lapse rates that occur in each of the ~7 different levels of the atmosphere from the surface to space. 

The Standard Atmosphere document indicates the only effect of water vapor upon the troposphere lapse rate is to reduce it from 9.8C/km to 6.5C/km on average, solely due to the high heat capacity Cp (1.865 Joules per gram per degree Kelvin) of water vapor compared to all of the other atmospheric gases. Per the lapse rate equation 

dT/dh = -g/Cp

where

dT = change in temperature with height
dh = change in height/geopotential altitude
g = gravitational acceleration constant = 9.8 meters/sec/sec
Cp = heat capacity at constant pressure (1 atmosphere constant pressure at the surface)

the temperature at any height or geopotential altitude is a function of and inversely related to heat capacity Cp. Thus any increase of Cp from water vapor will decrease the lapse rate and thus temperature at any height including at the surface (up to 25.5C as we previously calculated). This has absolutely nothing to do with "radiative forcing" from any greenhouse gases including water vapor itself. 

The first 6 of these linear lapse rates are shown in figure 3 below, and calculated entirely on the basis of geopotential altitude (a measure of gravitational potential energy PE) vs. molecular-scale temperature [defined in the scan below of page 9 as the mean molecular weight at that geopotential altitude], which has absolutely nothing to do with any alleged "heat trapping" or "radiative forcing" from any greenhouse gases:


Fig. 3 from the 1976 US Standard Atmosphere document below. Note the "Molecular-scale temperature is a function of the geopotential altitude." Thus, the kinetic temperature of the particular molecular masses and compositions of the atmosphere is a function of the geopotential height (which is the gravitational potential energy (PE) accumulated at that height) which adiabatically sets the pressure at that geopotential height. This is another way of saying temperature is a function of atmospheric mass/gravity/pressure, which is exactly what the Maxwell atmospheric mass/gravity/pressure 33C greenhouse effect claims, not "radiative forcing" from greenhouse gases. 

And we previous demonstrated with the greenhouse equation that we can exactly duplicate the 1976 US Standard Temperature database and model without even knowing anything about the surface temperature or greenhouse gases in advance, entirely based upon solar radiation at the Earth's surface, gravity, mass, and pressure of the atmosphere, proving no measurable effect from CO2. 
The "Greenhouse Equation" calculates temperature (T) at any location from the surface to the top of the troposphere as a function of atmospheric mass/gravity/pressure and radiative forcing from the Sun only, and without any radiative forcing from greenhouse gases. Note the pressure (P) divided by 2 in the greenhouse equation is the pressure at the center of mass of the atmosphere, where the temperature and height are equal to the equilibrium temperature with the Sun and average "Effective Radiating Level" or ERL, respectively. 
Fig 3 from the 1976 US Standard Atmosphere description document below, with added annotations showing how the center of the tropospheric lapse rate is "triangulated" by the known constants of mass and the center of mass, the height where the center of mass can be calculated which is where the mass above is 1/2 of the total mass and the Pressure (1/2 atm) is 1/2 of the surface pressure (1 atm), and the known constant of equilibrium temperature Te between the Earth and Sun. This is the exact location of the ERL, where the temperature must equal the equilibrium temperature with the Sun. By determining the height of the ERL, the greenhouse equation then extends the linear adiabatic lapse rate up to the top of the troposphere at ~12,000 meters and down to the surface at 0 meters, from which the entire tropospheric temperature profile from the top of the troposphere to the ERL to the surface temperature can be determined by only knowing the constant equilibrium temperature with the Sun = Te = 255K. 

Some commenters still doubt this is possible and conveniently claim [without any mathematical or observational proof whatsoever] as a last resort that greenhouse gases somehow control the lapse rates in each atmospheric layer. The US Standard Atmosphere and millions of confirming observations prove this is false, demonstrated by the linear kinematic velocity graph shown from the US Standard Atmosphere report below (from page 19 also scanned further below), which shows an almost perfect linear relationship between geopotential altitude and kinematic velocity from the surface to space, calculated entirely without any radiative forcing whatsoever and confirmed by observations. 

Greenhouse gas concentrations of the primary greenhouse gas water vapor and other greenhouse gases including methane, ozone, (and even CO2 to some extent) vary tremendously from the surface to the ~100 km edge of space, thus if "radiative forcing" from water vapor or any other greenhouse gases had anything to do with the cause of temperatures at any altitude, the kinematic viscosity would be nonlinear instead of linear, and the dynamic viscosity profile would not match the temperature profile (but the standard atmosphere shows it does). 


And the physical definitions and units below show radiance has nothing to do with any of these physical calculations nor interrelationships:

Physical definitions and units of kinematic viscosity, dynamic viscosity, mass density, weight and how they are related. None are defined on the basis of radiance or "radiative forcing"

This proves that only kinematic viscosity effects, not radiative effects, of any gases including greenhouse gases, are what determine the kinematic temperatures at all locations, not "greenhouse gas radiative forcing."  The only true source of radiative forcing is the Sun, not greenhouse gases which are mere passive IR-radiators & heat sinks, which help to cool the atmosphere by radiative loss to space, just like a bigger heat sink on your microprocessor does. 

After all of the above calculations were made by the US Std Atm scientists, the final calculation of the coefficient of thermal conductivity in W/(mK) was as their final step and determined solely as a function of geometric altitude/mass/density/viscosity. The document specifies below (page 20) that their ultimate calculation of the coefficient of thermal conductivity was the effect and not the cause of geometric altitude/mass/density/viscosity exclusively, and thus not "radiation trapping" nor any radiative calculations from any greenhouse gases whatsoever. The profile of these curves also nearly match the US Std Atmosphere temperature and dynamic viscosity graphs above indicating their direct relationship as gravity/mass the cause of and not the effect of any radiative forcing whatsoever.
Therefore, this provides the ultimate physical and observational proof that Maxwell's (33C) mass/pressure/gravity "greenhouse theory" of the (7) atmospheric temperature gradients is absolutely correct, thus falsifying the radiative greenhouse theory that is essential to the CAGW hypothesis. 


It is now absolutely clear that the greenhouse-gas radiative "greenhouse" theory has simply confused cause with effect. The Maxwell mass/gravity/pressure 33C "greenhouse theory" was proved physically and verified with the millions of observations of the 1976 US Standard atmosphere physical and modelled derivation and confirming observations, proving that temperatures everywhere from the surface to space are due to solar radiation plus the effect of atmospheric mass/gravity, thereby excluding any significant radiative effects from greenhouse gases (other than radiative cooling effects essential for the atmosphere to lose heat to space, i.e. the opposite of "trapping heat"). Only one of these two competing 33C "greenhouse effect" theories can be true, you simply cannot have it both ways, because if you did, the Earth would be 33C warmer at the surface than the present (in addition to multiple violations of physical laws). 

In our next post we will show why the radiation spectra of Earth seen from the ground and space are the effect of and not the cause of the entire atmospheric and surface profiles. 


CO2 and water vapor concentrations to number/mass density of the atmosphere are both so small they were calculated and then removed from consideration in the 1-D model of the atmosphere that perfectly reproduces the observations all the way to space.

1976 version of the US Standard Atmosphere

This is the most recent version and differs from previous versions only above 32 km:
Subscript bGeopotential
altitude above MSL[3]
Static pressureStandard temperature
(K)
Temperature Lapse Rate
(m)(ft)(pascals)(inHg)(K/m)(K/ft)
00010132529.92126288.15-0.0065-0.0019812
111,00036,08922632.16.683245216.650.00.0
220,00065,6175474.891.616734216.650.0010.0003048
332,000104,987868.0190.2563258228.650.00280.00085344
447,000154,199110.9060.0327506270.650.00.0
551,000167,32366.93890.01976704270.65-0.0028-0.00085344
671,000232,9403.956420.00116833214.65-0.002-0.0006096
Us standard atmosphere model.png
The conventional radiative theory cannot explain why the linear lapse rates in each of the ~7 atmospheric layers defined in the US Std Atmosphere table above vary from positive to zero to negative on the basis of greenhouse gas radiative forcing, since the concentrations of the various greenhouse gases at each of these 7 levels varies tremendously in each level, often in the opposite direction to the concentrations of the composition and amounts of greenhouse gases in each level. It is frankly impossible for each greenhouse gas to magically have the opposite warming and cooling (or no) effects simply dependent upon the altitudes of the 7 different layers. In addition, the only greenhouse gases above level 4 above are CO2 and O3, which somehow are claimed by radiative proponents to magically warm the stratosphere and thermosphere, but cool the mesosphere. How can CO2 magically change it's radiative effects between layers of allegedly cooling 3 layers, having no effect on 3 layers, and the opposite warming effect on other layers? It cannot. CO2 and other greenhouse gases can only have the same passive IR absorbers/emitters in all 7 layers, increasing radiative surface area and thus cooling of the entire atmosphere to space.
Additional scans from the US Std Atmosphere proving all of the points above:


Thursday, December 4, 2014

US Standard Atmosphere Model & Observations Prove Maxwell's Mass/Gravity/Pressure Theory of the 'Greenhouse Effect' is Correct & Falsifies CAGW

Early in the "space race" of the 1950's, US Air Force Research Laboratory meteorologist and "rocket design climatologist" Norman Sissenwine "recognized the urgent need for complete data on the properties of the atmosphere" and thus became "a catalyst between the aerospace and meteorological community" to develop the US Standard Atmosphere physical model of Earth's atmospheric pressure, density, and temperature profile by altitude from the surface all the way up to the edge of space at ~100,000+ meters altitude.

This massive effort was critical to the entire space program and aeronautics, and hundreds of rocket scientists, physicists, meteorologists, aeronautical engineers, and atmospheric scientists contributed to this project necessary to physically model and then verify with millions of observations from weather balloons, research flights, and rocket launches, that their physical 1-D vertical model of the atmosphere was correct. The 1958 first edition of the US Standard Atmosphere was followed by revisions, mostly of the far upper atmosphere at the edge of space, as more data became available from the space program, with revisions published in 1962, 1966, and the final 1976 version still widely used as the gold standard today. 

This effort to model the atmosphere for NASA, NOAA, and the US military during the cold war began long before the field of 'climate science' or 'climatologists' even existed, long before anyone ever thought or knew about alleged "radiative forcing from greenhouse gases" causing "catastrophic man-made global warming or climate change," and twenty years before the first 'climatologists' gave us the ice age scare of the 1970's, immediately followed by the global warming scare of the 1980's that is still haunting us today [but now called 'climate change' since it's not warming]. 

These early atmospheric scientists began this effort to model the atmosphere with the basic physics of gases and air known since the 1800's from the ideal gas law, 1st Law of Thermodynamics, Newton's second law of motion (F=ma=mg), the physical chemistry of molecular weights, partial pressures of each gas, heat capacities of individual gases and air at both constant pressure and constant volume, the gravitational acceleration constant, barometric formulae, Boltzmann's constant, Avogadro's number, mean atmospheric molecular weights, number density of individual species, total number density, atmospheric mass density, mole volume, scale height, geopotential height of gravitational potential energy (PE), mean air-particle speed, mean free-path of air molecules, mean collision frequency, calculated speed of sound, dynamic viscosity, kinematic viscosity, coefficient of thermal conductivity, and on and on...

And never once used any "radiative forcing" from any IR-active greenhouse gases or any radiative calculations from any greenhouse gases whatsoever to produce an accurate 1-D model that could calculate Earth's entire pressure, mass density, temperature, and molecular-scale temperature as a function of geopotential altitude (geopotential height ~ geopotential altitude ~ gravitational potential energy (PE)) profile from the surface to the edge of space. 


Fig. 3 from the 1976 US Standard Atmosphere document below. Note the "Molecular-scale temperature is a function of the geopotential altitude." Thus, the kinetic temperature of the particular molecular masses and compositions of the atmosphere is a function of the geopotential height (which is the gravitational potential energy (PE) accumulated at that height) which adiabatically sets the pressure at that geopotential height. This is another way of saying temperature is a function of atmospheric mass/gravity/pressure, which is exactly what the Maxwell atmospheric mass/gravity/pressure 33C greenhouse effect claims, not "radiative forcing" from greenhouse gases. 

The entire US Standard Atmosphere physical model was derived from physical laws assuming a completely dry atmosphere without any water vapor (the so called primary greenhouse gas) or any natural or man-made CO2 whatsoever (since CO2 at 0.03-0.04% contributes negligibly to atmospheric mass). It was only after the entire dry atmosphere model was finished that the average water vapor in Earth's atmosphere was added back in solely by changing one essentially constant parameter (on an annual & global basis):

the heat capacity of air at constant pressure (Cp) (on a global annual average basis)

of the atmosphere to calculate the tropospheric lapse rate, since water vapor has a high heat capacity more than double that of N2, O2, and CO2 (which are all lower and close to the same). This is the primary means (other than clouds) by which water vapor cools the Earth surface and atmosphere, since by the lapse rate equation

dT/dh = -g/Cp

where 

dT = change in temperature
dh = change in altitude
g = gravitational acceleration constant
Cp = heat capacity at constant pressure

the change in temperature dT is inversely related to a change in heat capacity (Cp). Note also that temperature T is a function of the constants gravity (g) and (Cp), and that neither g or Cp (within the temperature range of Earth's atmosphere) are a function of temperature (T). 

Since water vapor increases heat capacity (Cp) in the lapse rate equation, it decreases the temperature (T) at any altitude (h) including the surface where (h) = 0, and decreases the lapse rate by half from the dry rate 9.8 C/km to the wet rate of 5 C/km if the atmosphere is fully saturated with water vapor. 

The scientists involved with the US Standard Atmosphere calculated the global average lapse rate of 6.5 K/km on the basis of the known heat capacity constants of water vapor and measured global average water vapor concentrations, to calculate and confirm with observations that it is ~6.5 C/km, intermediate as expected between the dry and wet fully saturated adiabatic lapse rates, and thus this is the value used to calculate the global annual average temperature, pressure, and density profile of the Standard Atmosphere. We now know from weather balloon and satellite measurements that the global average total water vapor is quite constant, and there is little agreement about whether it has stayed the same or slightly increased or decreased over the past 35 years of the satellite era. 

The tiny 0.03-0.04% of CO2 in the atmosphere does not contribute in any significant way to atmospheric molecular mass, molecular density, partial pressures, heat capacity (Cp), etc., thus in the multiple versions of the US Standard Atmosphere models, the calculated CO2 effect on the atmospheric temperature was so negligible that the atmospheric scientists thereafter completely discarded CO2 from their model calculations of the atmosphere. The same potential effects were calculated for what is called today the "20 times stronger greenhouse gas than CO2" methane; these atmospheric scientists found the mass contribution and heat capacity to the atmosphere from methane was far too negligible to consider, thus, it was also discarded from the model along with CO2.

Thus, these hundreds of scientists were in effect "deniers" of the man-made CO2 global warming hypothesis that would come much later, and didn't recognize any "radiative forcing" from any "greenhouse gases" at the time they provided an accurate physically derived & straightforward model of the atmosphere. Hansen's (falsified) climate models and the CAGW hypothesis scare didn't arrive until ~30 years later. These atmospheric scientists never once used any radiative calculations of "back-radiation" or "radiative forcing" from IR-active greenhouse gases or clouds, or any absorption/emission spectra from greenhouse gases, all of which are the absolutely essential and critical underpinnings of the entire 33C Arrhenius radiative greenhouse theory a.k.a. the catastrophic man-made CO2 global warming theory.

Why not?

Because they knew, as did scientists including Maxwell in 1872, that the atmospheric temperature gradient is a function of atmospheric mass/gravity/pressure, not the other way around. Temperature is calculated in their model as a function of geopotential height (gravitational potential energy (PE)) and molecular mass of the constituents in each atmospheric layer, from which atmospheric pressure, density, etc. are calculated using the geopotential height (gravitational potential energy (PE) at a given height). After these intermediate parameters are calculated, then the temperature at a particular altitude is calculated as a function of mass/gravity/pressure, not the other way around. The only assumption about temperature made in their atmospheric model was that global surface temperature is, by international agreement and definition, 15C.

Ah, you say, they assumed the surface temperature and thus everything else is a function of that!

It's true that the only assumption made about temperature in their model is the surface temperature, by definition 15C. They, of course, had to do so because that is the surface temperature by definition from international agreement, and also because there were no satellite measurements at that time from the Sun and Earth to determine Earth's equilibrium temperature with the Sun. Therefore, they used 15C by definition as the starting point at the surface, and then calculated the entire remainder of the atmosphere as a function of the geopotential height (gravitational potential energy (PE) at a given height), and given the mass and molecular weights of the constituents of the air observed at each level of the atmosphere (without the greenhouse gases water vapor and CO2).

Now that satellite measurements make it possible to determine the Earth's equilibrium temperature with the Sun (Te = 255K), we can now use the greenhouse equation to bootstrap onto this huge effort by these pioneering atmospheric scientists, and thereby calculate the average global temperature at any altitude (geopotential height) in Earth's atmosphere all the way from the surface to the edge of space at ~100,000 km altitude, entirely without any radiative forcing from greenhouse gases whatsoever, and based only upon the mass/gravity theory of the greenhouse effect (first described by the famous physicist Maxwell in 1872), and calculated atmospheric center of mass, and without knowing the surface temperature or any other atmospheric temperature other than the constant equilibrium temperature with the Sun in advance.

The "Greenhouse Equation" calculates temperature (T) at any location from the surface to the top of the troposphere as a function of atmospheric mass/gravity/pressure and radiative forcing from the Sun only, and without any radiative forcing from greenhouse gases. Note the pressure (P) divided by 2 in the greenhouse equation is the pressure at the center of mass of the atmosphere, where the temperature and height are equal to the equilibrium temperature with the Sun and average "Effective Radiating Level" or ERL, respectively. 
Fig 3 from the 1976 US Standard Atmosphere description document below, with added annotations showing how the center of the tropospheric lapse rate is "triangulated" by the known constants of mass and the center of mass, the height where the center of mass can be calculated which is where the mass above is 1/2 of the total mass and the Pressure (1/2 atm) is 1/2 of the surface pressure (1 atm), and the known constant of equilibrium temperature Te between the Earth and Sun. This is the exact location of the ERL, where the temperature must equal the equilibrium temperature with the Sun. By determining the height of the ERL, the greenhouse equation then extends the linear adiabatic lapse rate up to the top of the troposphere at ~12,000 meters and down to the surface at 0 meters, from which the entire tropospheric temperature profile from the top of the troposphere to the ERL to the surface temperature can be determined by only knowing the constant equilibrium temperature with the Sun = Te = 255K. 

The calculation of not only the entire troposphere temperature profile by the greenhouse equation, but also the calculation of the temperature profiles of all remaining levels of the entire atmosphere all the way to space at ~100,000 meters, by bootstrapping onto this seminal gravito-thermal model of the 1976 US Standard Atmosphere above the troposphere, will be the topic of the next post in this series.  

The entire 241 page 1976 US Standard Atmosphere document and database (which still remains the gold standard today and has not changed despite 39 years of greenhouse gas emissions) is posted below. It is an absolute goldmine of detailed information on the physical derivation of the standard atmospheric model and confirmatory observations. It thus provides overwhelming physical proof and overwhelming observational evidence that the Maxwell gravito-thermal mass/gravity/pressure theory of the 33C "greenhouse effect" is correct, and would necessarily falsify any significant "radiative forcing from greenhouse gases" affecting the lapse rates or various atmospheric temperature gradients, and thus as well negate the theory of catastrophic anthropogenic global warming. Only one of these two competing greenhouse theories can account for the 33C greenhouse effect, since if both were true, the Earth would be an additional 33C warmer than present. 


Tuesday, July 22, 2014

US Naval Research Lab models atmospheric temperatures without using CO2

Interesting, the US Naval Research Laboratory's empirical, global model of the Earth’s atmospheric temperature profile from ground to space is based only upon atmospheric mass densities, solar flux, and molecular composition sans CO2, with no input or consideration of CO2 levels or CO2 'radiative forcing'. Could it possibly be that atmospheric mass, pressure, gravity and solar flux determine the temperature profile of the atmosphere, not radiative forcing from CO2?

Reblogged from Malaga Bay:

Atmospheric Science: US Standard Atmosphere 1962

A sad example of the Mushroom Management that is endemic in Wikipedia is the breathtaking inclusion of a diagram [in their Atmosphere of Earth article] based upon the 1962 US Standard Atmosphere.
Evidently, Wikipedia thinks Atmospheric Science hasn’t advanced in the last 52 years.
Wikipedia Atmosphere of Earth
US_standard_atmosphere_1962
However, 1962 was a long time ago.
1962 saw the Beatles release their first single in the United Kingdom. 
1962 saw the arrival of the trijet airliner.
1962 saw John Glenn orbit the Earth three times.
1962 saw Europe still enjoying black and white television.
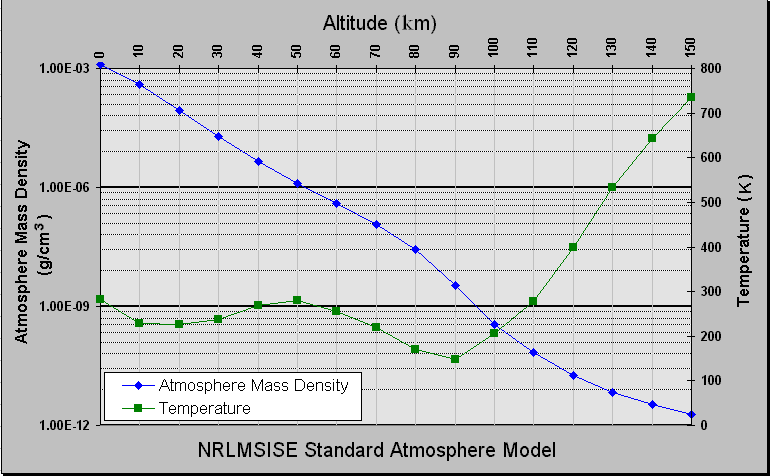
Scrolling down the Atmosphere of Earth article we find that Wikipedia has included a graph from the NRLMSISE-00 standard atmosphere model.
NRLMSISE-00 standard atmosphere - portrait
Temperature and mass density against altitude from the NRLMSISE-00 standard atmosphere model (the eight dotted lines in each “decade” are at the eight cubes 8, 27, 64, …, 729)
NRLMSISE-00 is apparently a model of the “Earth’s atmosphere from ground to space” developed by the US Naval Research Laboratory.
NRLMSISE-00 is an empirical, global model of the Earth’s atmosphere from ground to space. It models the temperatures and densities of the atmosphere’s components. A primary use of this model is to aid predictions of satellite orbital decay due to atmospheric drag. This model has also been used by astronomers to calculate the mass of air between telescopes and laser beams in order to assess the impact of laser guide stars on the non-lasing telescopes.
The model, developed by Mike Picone, Alan Hedin, and Doug Drob, is based on the earlier models MSIS-86 and MSISE-90, but updated with actual satellite drag data. It also predicts anomalous oxygen.
NRL stands for the US Naval Research Laboratory.
MSIS stands for Mass Spectrometer and Incoherent Scatter Radar respectively, the two primary data sources for development of earlier versions of the model.
E indicates that the model extends from the ground through exosphere and 00 is the year of release.
Although NRLMSISE-00 can model the Earth’s atmosphere from ground to space Wikipedia only manages to provide a graph detailing the first 150 kilometres of the atmosphere.
Additionally, the example NRLMSISE-00 graph is not directly comparable with the 1962 US Standard Atmosphere because tucked away on the associated image page we learn that the NRLMSISE-00 graph was produced using the following parameters:
Day = 172
UT(Sec) = 29000
Geodetic Latitude(Deg) = 60
Geodetic Longitude(Deg) = 120
Local Apparent Solar Time(Hrs) = 16
81 day Average of F10.7 Flux = 150
Daily F10.7 Flux for Previous Day = 150
AP=Magnetic Index (Daily) = 4

On the positive side these parameters provide a wonderful insight into what the mainstream currently believe controls the density and temperature profiles of the Earth’s atmosphere.
Intriguingly, the NRLMSISE-00 model doesn’t have a parameter for CO2.
An additional bonus is that the Wikipedia article relating to the U.S. Standard Atmosphere provides a graphic detailing the “composition by volume of Earth’s atmosphere” [excluding water vapour] which is more comprehensive than the table provided by Wikipedia in their Atmosphere of Earth article.
Atmospheric_composition_Langley
Furthermore, this Wikipedia article also provides a link to the 1976 version of the U.S. Standard Atmosphere…
Added: see also the model documentation here, which shows assumptions for the molecular composition of the atmosphere including O3, N2O, O2, Ar, H2O, and N2, but no mention of CO2 anywhere.