Showing posts sorted by relevance for query NAO. Sort by date Show all posts

Friday, May 22, 2015

New paper finds another solar amplification mechanism by which the Sun controls climate

A paper published today in Environmental Research Letters finds another potential solar amplification mechanism by which changes in solar UV activity over 11-year solar cycles are amplified to large-scale effects upon climate via modulations of the North Atlantic Oscillation [NAO]. 

The authors model a mechanism whereby large changes (up to 100%) in solar UV over solar cycles affect heating rates of the upper stratosphere, which in turn affect winds and temperature gradients in the troposphere, and heat storage in North Atlantic Ocean. This results in a lagged effect of 3-4 years in the amplitude of the North Atlantic Oscillation, which in turn affects Arctic sea ice extent, other ocean oscillations, the jet stream, and weather patterns around the globe. The paper corroborates several others demonstrating solar influence upon the NAO, as well as other ocean oscillations. 

According to the authors,
Numerous studies have suggested an impact of the 11 year solar cycle on the winter North Atlantic Oscillation (NAO), with an increased tendency for positive [NAO signals to occur at maxima of the solar cycle, and negative NAO signals to occur at minima of the solar cycle]. Climate models have successfully reproduced this solar cycle modulation of the NAO, although the magnitude of the effect is often considerably weaker than implied by observations.  
A leading candidate for the mechanism of solar influence is via the impact of ultraviolet radiation variability on heating rates in the tropical upper stratosphere, and consequently on the meridional temperature gradient and zonal winds...On reaching the troposphere this produces a response similar to the winter NAO. Recent analyses of observations have shown that solar cycle–NAO link becomes clearer approximately three years after solar maximum and minimum. Previous modelling studies have been unable to reproduce a lagged response of the observed magnitude. 
In this study, the impact of solar cycle on the NAO is investigated using an atmosphere–ocean coupled climate model. We show that the model produces significant NAO responses peaking several years after extrema of the solar cycle, persisting even when the solar forcing becomes neutral. This confirms suggestions of a further component to the solar influence on the NAO beyond direct atmospheric heating and its dynamical response. Analysis of simulated upper ocean temperature anomalies confirms that the North Atlantic Ocean provides the memory of the solar forcing required to produce the lagged NAO response. These results have implications for improving skill in decadal predictions of the European and North American winter climate.

A simulated lagged response of the North Atlantic Oscillation to the solar cycle over the period 1960–2009

OPEN ACCESS

M B Andrews 1, J R Knight 1 and L J Gray 2
Show affiliations

M B Andrews et al 2015 Environ. Res. Lett. 10 054022
doi:10.1088/1748-9326/10/5/054022Published 22 May 2015

Tag this article Create citation alert PDF (1.43 MB)

Abstract

Numerous studies have suggested an impact of the 11 year solar cycle on the winter North Atlantic Oscillation (NAO), with an increased tendency for positive (negative) NAO signals to occur at maxima (minima) of the solar cycle. Climate models have successfully reproduced this solar cycle modulation of the NAO, although the magnitude of the effect is often considerably weaker than implied by observations. A leading candidate for the mechanism of solar influence is via the impact of ultraviolet radiation variability on heating rates in the tropical upper stratosphere, and consequently on the meridional temperature gradient and zonal winds. Model simulations show a zonal mean wind anomaly that migrates polewards and downwards through wave–mean flow interaction. On reaching the troposphere this produces a response similar to the winter NAO. Recent analyses of observations have shown that solar cycle–NAO link becomes clearer approximately three years after solar maximum and minimum. Previous modelling studies have been unable to reproduce a lagged response of the observed magnitude. In this study, the impact of solar cycle on the NAO is investigated using an atmosphere–ocean coupled climate model. Simulations that include climate forcings are performed over the period 1960–2009 for two solar forcing scenarios: constant solar irradiance, and time-varying solar irradiance. We show that the model produces significant NAO responses peaking several years after extrema of the solar cycle, persisting even when the solar forcing becomes neutral. This confirms suggestions of a further component to the solar influence on the NAO beyond direct atmospheric heating and its dynamical response. Analysis of simulated upper ocean temperature anomalies confirms that the North Atlantic Ocean provides the memory of the solar forcing required to produce the lagged NAO response. These results have implications for improving skill in decadal predictions of the European and North American winter climate.

1. Introduction

The variability of the Sun's output influences the heating of the stratosphere via the absorption of ultraviolet (UV) by ozone (Haigh1994, Gray et al 2009). Observational studies of the influence of the 11 year solar cycle show warm temperature anomalies in the equatorial upper stratosphere at solar maximum compared to solar minimum (Frame and Gray 2010, Mitchell et al 2014). Significant changes in the extratropical atmospheric circulation have been linked to these temperature anomalies (Kodera 1995, Kodera and Kuroda 2002), and this is supported by modelling studies (e.g. Matthes et al 2004, 2006, Ineson et al 2011). One of the mechanisms for 'top-down' solar influence (Gray et al 2010) involves equatorial stratospheric warm anomalies at solar maximum which increases the mean meridional temperature gradient, resulting in an increase in the mean Westerly wind in the mid-latitude stratosphere. This positive zonal wind anomaly is then amplified by forcing from planetary waves propagating upwards from the troposphere. Along with meridional advection, this wave feedback causes the poleward and downward migration and amplification of the wind anomaly to the mid- and high-latitude lower stratosphere, where it is able to influence tropospheric circulation. The resulting surface response involves sea-level pressure changes at solar maximum which are very similar to the positive phase of the Arctic Oscillation (AO), with anomalous low pressure over the North Pole bordered by anomalous high pressure in mid-latitudes (Thompson and Wallace 1998). Conversely, at solar minimum, a negative AO response results from reduced stratospheric meridional temperature gradients and the downward and poleward propagation of negative zonal wind anomalies. This top-down mechanism occurs on seasonal timescales since planetary wave propagation in the stratosphere is limited to the winter half-year.

This 'top-down' mechanism cannot explain the recently identified lag of approximately 3 years between solar maximum (minimum) and an increased tendency of a positive (negative) North Atlantic Oscillation (NAO) signal superimposed on the intrinsic year-to-year NAO variability (Gray et al 2013). The ability of the climate system to produce a multi-year lag in the winter NAO response necessitates the persistence of solar signals within the climate system from one winter to the next. Scaife et al (2013) showed that the North Atlantic Ocean is a prime candidate for the source of the lag. Model simulations have demonstrated that the sub-surface North Atlantic Ocean can be influenced by NAO changes related to the internal variability of stratospheric circulation (Reichler et al2012) and changes in multidecadal solar irradiance (Menary and Scaife 2014). On interannual timescales, Scaife et al (2013) presented a mechanism involving coupled atmosphere–ocean feedbacks. The NAO is known to be correlated with a tripole pattern in the North Atlantic sea-surface temperatures (SST), (Visbeck et al 2003), which extends below the surface into the ocean mixed layer. Due to the seasonal cycle in surface heat and turbulent fluxes, the mixed-layer-depth (MLD) is deeper in winter than in summer. This suggests that a winter sub-surface ocean signal, linked to solar variability, could persist by being isolated underneath the shallower summer mixed layer from the modifying influence of surface fluxes from the atmosphere. In autumn, as the summer mixed-layer erodes and the deeper winter mixed layer becomes established, any sub-surface solar signal would reconnect with the surface, giving it the potential to influence the atmosphere. This sequestration and re-emergence of signals from one winter to the next has been shown to operate in other contexts (Alexander et al 1999, Timlin et al 2002, Deser et al 2003, Taws et al 2011), and would give rise to a forcing of the NAO by the ocean (Rodwell and Folland 2002). Hanawa and Sugimoto (2004) identified several regions of re-emergence including areas of the North Atlantic relevant to this study. Scaife et al (2013) argue that a weak solar-related AO/NAO signal could build up over a number of years in the tripole region of the North Atlantic Ocean and feedback onto the atmosphere to produce a peak in the NAO signal after a few years.

Several studies have examined the simulated NAO response to solar forcings. Gray et al (2013) and Mitchell et al (2015) showed that Coupled Model Intercomparison Project Phase 5 (CMIP5) simulations were unable to reproduce the observed NAO response. On the other hand, Ineson et al (2011) were able to simulate a realistic amplitude of the NAO response by imposing a higher level of variability in UV-band irradiance. They reproduced the UV-induced 'top-down' mechanism, connecting the upper-stratosphere and the tropospheric NAO. The simulations from Ineson et al (2011) were further analysed by Scaife et al (2013), who showed that the implied ocean–atmosphere coupling in the model used by Ineson et al (2011) was too weak to produce the observed delay.

In this study we use historical simulations of the period 1960–2009 with CMIP5 evolving forcings to explore the influence of solar variability on the NAO. This is different to the experiments of Ineson et al (2011) which use constant forcings within their solar maximum and solar minimum scenarios. We use two ensembles, the first with solar irradiance held constant and the second with time-varying spectrally resolved solar variability. The difference in response of the ensembles should reveal the influence of the varying solar cycle on the atmosphere and oceans.

...
Figure 1. (a) Time-series of imposed TSI anomaly (black line), and UV-band irradiance anomaly (dashed blue line) with respect to the 1960–2009 mean. (b) Composites of upper stratospheric zonal mean temperature (dashed red line) and DJF NAO-index (black line) as a function of lag with respect to solar maximum minus solar minimum. The upper stratospheric temperature is calculated as the annual average of the region bounded by 0.5–5 hPa (approximately 40–55 km), and 30 °S–30 °N. The NAO-index is defined as the DJF surface pressure difference between the Azores and Iceland. The points where the NAO-index is significant at the 95% level are highlighted with squares.
We have investigated the NAO response to solar variability using a state-of-the-art atmosphere–ocean coupled model. Historical ensembles for the period 1960–2009 were performed with constant and time-varying solar irradiance. Analysis of the differences between the ensembles was performed to identify solar cycle responses in the atmosphere and ocean. The results demonstrate tropical upper stratospheric heating in response to the imposed UV change at solar maximum compared to solar minimum, and confirm the results of Ineson et al (2011), showing a subsequent surface winter NAO response via a 'top-down' mechanism. The response of the NAO peaks 3–4 years following the extreme phase of the solar cycle. This finding is consistent with a recent re-evaluation of observed responses to the solar cycle (Gray et al 2013) which shows the largest NAO signal at a similar lag. The in-phase response of the Aleutian Low is also in agreement with observational analyses.
We diagnose the source of the NAO lag in the model by examining its surface and sub-surface solar responses in the North Atlantic Ocean. We find evidence for amplification of 'top-down' solar-related NAO changes via an ocean feedback over a period of several years, as suggested by Scaife et al (2013). This feedback is analysed by examining solar cycle responses in the different nodes of the North Atlantic tripole SST pattern, as this pattern reflects NAO–ocean coupling. The Northern and Middle nodes of the tripole show temperature responses in the surface and sub-subsurface ocean with a similar lag to the NAO. The Southern node, however, does not show any lag. In the Middle node we find re-emergence of solar signals imprinted on the ocean from the previous winter. By remaining intact below the shallow ocean mixed-layer that forms in summer, these signals can re-emerge in winter and reinforce the 'top-down' forcing of the NAO via coupling with the atmosphere. This mechanism is not evident in the Northern and Southern nodes. The simulated re-emergence in the North Atlantic Ocean causes an accumulation of the solar signal, allowing the NAO to grow over several years. This growth is limited by the reversal of the solar cycle, resulting in a lag approximately equal to one quarter of its period. Although we do not explicitly demonstrate here that the growth in the NAO response arises through feedback from the solar SST signal in the Middle node the existence of this feedback is supported by previous studies (Rodwell and Folland 2002, Timlin et al 2002) that show the influence of tripole SSTs on the NAO.
The NAO (Hurrell et al 2003) is a key mode of regional climate variability that strongly influences the wintertime weather of Northern Europe and Eastern North America. The ability to reproduce the lagged NAO response to solar forcing in atmosphere–ocean coupled models offers the possibility of increased NAO predictability and hence skill in seasonal forecasts (Scaife et al 2014) and decadal forecasts up to a few years ahead (Smith et al 2012).

Thursday, September 15, 2011

New paper shows yet another way the Sun controls climate - via ocean oscillations

A paper recently published in the Journal of Geophysical Research finds a strong positive relationship between solar activity and the North Atlantic Oscillation (NAO) over the past 30 years of the 20th century. The study finds a lagged relationship with changes in solar activity followed by changes in the trend of the NAO a few years later. The NAO in turn has profound effects upon the climate of the Northern Hemisphere, including Arctic sea ice. The IPCC dismisses the role of the Sun on climate by only looking at a single variable - the Total Solar Irradiance (TSI), while ignoring large changes in solar UV and secondary effects such as on cloud formation and ocean oscillations.

Graph (a) is the North Atlantic Oscillation (NAO), smoothed version to right. Graph (b) is the Solar Activity aa index, smoothed version to right. Note the significant increase in solar activity over the 20th century.
JOURNAL OF GEOPHYSICAL RESEARCH, VOL. 116, D16109, 15 PP., 2011
doi:10.1029/2011JD015822
Key Points
  • The nonlinear relationship between the geomagnetic aa index and the winter NAO
  • Multidecadal variation of solar activity and trend changes in the winter NAO
  • The aa-NAO relationship is in the declining phase of even-numbered solar cycles
Yun Li
CSIRO Climate Adaptation Flagship, CSIRO Mathematics, Informatics and Statistics, Wembley, Western Australia, Australia
Hua Lu
British Antarctic Survey, Cambridge, UK
Martin J. Jarvis
British Antarctic Survey, Cambridge, UK
Mark A. Clilverd
British Antarctic Survey, Cambridge, UK
Bryson Bates
CSIRO Climate Adaptation Flagship, CSIRO Marine and Atmospheric Research, Wembley, Western Australia, Australia
The relationship between the geomagnetic aa index and the winter North Atlantic Oscillation (NAO) has previously been found to be nonstationary, being weakly negative during the early 20th century and significantly positive since the 1970s. The study reported here applies a statistical method called the generalized additive modeling (GAM) to elucidate the underlying physical reasons. We find that the relationship between aa index and the NAO during the Northern Hemispheric winter is generally nonlinear and can be described by a concave shape with a negative relation for small to medium aa and a positive relation for medium to large aa. The nonstationary character of the aa-NAO relationship may be ascribed to two factors. First, it is modulated by the multidecadal variation of solar activity. This solar modulation is indicated by significant change points of the trends of solar indices around the beginning of solar cycle 14, 20, and 22 (i.e., ∼1902/1903, ∼1962/1963, and ∼1995/1996). Coherent changes of the trend in the winter time NAO followed the solar trend changes a few years later. Second, the aa-NAO relationship is dominated by the aa data from the declining phase of even-numbered solar cycles, implying that the 27 day recurrent solar wind streams may be responsible for the observed aa-NAO relationship. It is possible that an increase of long-duration recurrent solar wind streams from high-latitude coronal holes during solar cycles 20 and 22 may partially account for the significant positive aa-NAO relationship during the last 30 years of the 20th century.

Related: The Medieval Climate Anomaly and NAO

Monday, September 24, 2012

New paper shows how natural variability controls North Atlantic climate

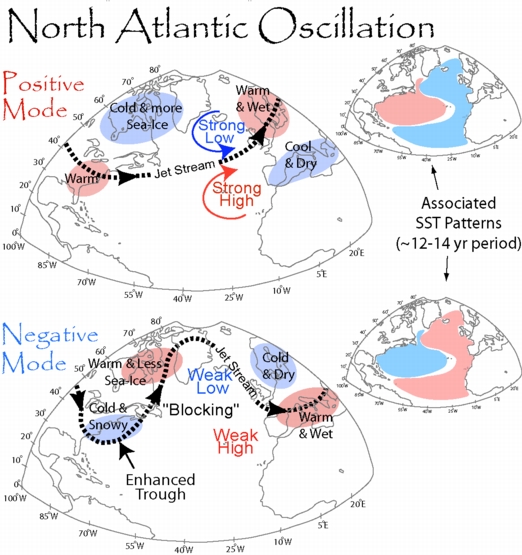
A new paper published in Nature Geoscience reconstructs the North Atlantic Oscillation, a natural climate phenomenon that is the "dominant mode of atmospheric variability" of the North Atlantic region.  The authors find that over the past 5,200 years, when the North Atlantic Oscillation (NAO) index is positive, "Europe and the eastern US are mild and wet, whereas Greenland and northern Canada are cold and dry. A negative index is associated with the reverse pattern." The authors also show that modern measurements of the summer NAO index have been strongly negative since about 2005, and thus, Greenland and northern Canada would be expected to be relatively warm and wet relative to Europe and the eastern US. Once again, natural climatic variations such as the NAO have been shown to dominate climate, not greenhouse gases. 
Summer NAO index (June, July, August or JJA) shown in upper left graph has been strongly negative since ~2005.
NAO index over the past 5,200 years shown in 3rd graph from right with positive index in red and negative in blue. "Greenland warm relative to Europe" shown in far right graph.

Variability of the North Atlantic Oscillation over the past 5,200 years

Nature Geoscience
 
(2012)
 
doi:10.1038/ngeo1589
Received
 
Accepted
 
Published online
 
Climate in the Arctic region and northwestern Europe is strongly affected by the North Atlantic Oscillation1, 2 (NAO), the dominant mode of atmospheric variability at mid-latitudes in the North Atlantic region. The NAO index is an indicator of atmospheric circulation and weather patterns: when the index is positive, Europe and the eastern US are mild and wet, whereas Greenland and northern Canada are cold and dry. A negative index is associated with the reverse pattern. Reconstructions of the NAO have so far been limited to the past 900 years3. Here we analyse a 5,200-year-long, high-resolution lake sediment record from southwestern Greenland to reconstruct lake hypolimnic anoxia, and link the results to an existing reconstruction of the NAO index from tree rings and speleothems3. Using the relationship between the two records, we find that around 4,500 and 650 years ago—around the end of the Holocene Thermal Maximum and the beginning of the Little Ice Age, respectively—the NAO changed from generally positive to variable, intermittently negative conditions. We suggest that variability in the dominant state of the NAO tend to coincide with large-scale changes in Northern Hemisphere climate. However, the onset of the Medieval Climate Anomaly was not associated with any notable changes in the NAO.

Saturday, October 12, 2013

New paper finds natural North Atlantic Oscillation controls Northern Hemisphere temperatures 15-20 years in advance

A new paper published in Geophysical Research Letters finds the natural North Atlantic Oscillation [NAO] controls temperatures of the Northern Hemisphere 15 to 20 years in advance, a lagged effect due to the large thermal inertia of the oceans. The authors find the NAO index can be used to predict Northern Hemisphere mean temperature multidecadal variability and the natural oceanic Atlantic Multidecadal Oscillation (AMO) 15–20 years in advance. A simple linear model based upon this theory predicted the 'pause' of global warming since about 2000 that IPCC models failed to predict, and projects Northern Hemisphere temperatures will "fall slightly" over the 15 years from 2012-2027. 

The NAO, in turn, has been linked to solar activity.
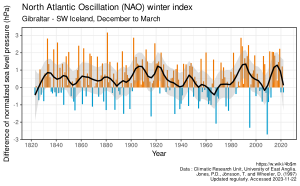
NAO winter index


NAO implicated as a predictor of Northern Hemisphere mean temperature multidecadal variability

Jianping Li 1,*, Cheng Sun 1, Fei-Fei Jin 2

DOI: 10.1002/2013GL057877

The twentieth century Northern Hemisphere mean surface temperature (NHT) is characterized by a multidecadal warming–cooling–warming pattern followed by a flat trend since about 2000 (recent warming hiatus). Here we demonstrate that the North Atlantic Oscillation (NAO) is implicated as a useful predictor of NHT  [Northern Hemisphere Temperature] multidecadal variability. Observational analysis shows that the NAO leads both the detrended NHT  [Northern Hemisphere Temperature] and oceanic Atlantic Multidecadal Oscillation (AMO) by 15–20 years. Theoretical analysis illuminates that the NAO precedes NHT multidecadal variability through its delayed effect on the AMO due to the large thermal inertia associated with slow oceanic processes. A NAO-based linear model is therefore established to predict the NHT, which gives an excellent hindcast for NHT in 1971–2011 with the recent flat trend well predicted. [Northern Hemisphere Temperature] NHT in 2012–2027 is predicted to fall slightly over the next decades, due to the recent NAO weakening that temporarily offsets the [theoretical] anthropogenically induced warming.

Monday, September 16, 2013

Climatologist explains halt of global warming via natural North Atlantic Oscillation, solar activity

Climatologist Dr. Eduardo Zorita, one of the authors of the recent paper rejecting the climate models at a confidence level >98% over the past 15 years, has a new post in which he states that the model vs. real-world discrepancy is even greater during the winter months [Dec-Feb], with only 0.2% of 6,104 climate model runs projecting the observed negative trend in winter temperatures [-0.10 C/decade] over the past 15 years. Climate models instead predicted that the most warming would occur during the winter months, the opposite of observations. 

According to Dr. Zorita, the observed global warming stagnation "does not seem to dovetail with an increased heat uptake by the ocean nor with a driving role of the Tropical Pacific, as suggested by the recently published paper by Kosaka et al." Dr. Zorita instead proposes that the natural North Atlantic Oscillation [NAO] explains the temperature stagnation, possibly via effects on cloud cover. 

Dr. Zorita also notes the NAO may be driven by solar activity: "Shindell et al. found in climate simulations conducted with the GISS model a few years ago that the NAO could also be affected by solar forcing - and this is the interesting link I would like to put forward here... They found that low solar irradiance would nudge the NAO toward a negative state, and this could explain the extreme European cold temperatures during the Late Maunder Minimum. Is this happening now again, albeit in a lesser magnitude? If it is, then a weaker sun would explain a global tendency to weaker temperature trends, with a stronger slow down over Eurasia."


The intriguing stagnation

By Dr. Eduardo Zorita, Die Klimazwiebel, 
September 15, 2013

We are not lacking hypothesis about the recent hiatus - or stagnation- in the global mean temperature: the ocean is taking up more heat, stratospheric water vapour has decreased, the sun has recently weakened and volcanic activity has also gathered a quicker click. A preliminary look at the structure of the stagnation may, or may not, offer some clues about how likely which of these hypothesis, or which combination, may end up being the correct one.

The global mean temperatures observed in the last 15 years are indeed at the very lower edge of the ensemble of trends simulated by climate models. This is the main message of our manuscript and the paper by Fyfe et al.. It has been argued that the starting year in the 15-year period used to compute the trends is misleading because 1998 experienced a very strong El Niño, but by now almost everyone recognizes that, whereas in reality the causes of the hiatus may still very well compatible with the effect of greenhouse gas forcing, current climate models have serious difficulties in simulating such low temperature trends as observed in this period when they are forced by the present external forcings and reasonable extrapolations of this forcing into the future. One important caveat here is that climate projections into the future assume constant solar activity and no volcanic activity, which arguably is not totally realistic.

One intriguing aspect of the stagnation is that it has not been equally distribution across all 12 months of the annual cycle. It has mainly occurred during the months of December, January and February, with the trends in June, July and August over the last 15 years being more similar to the corresponding trends in the period 1980 to 1997.


Figure 1

This means that temperature trends have decelerated much more during the boreal winter months. Actually the trend over the last 15 years in these months is remarkably negative, as can be seen in the following diagrams:
Figure 2

Form the CMIP5 ensemble of climate models that is being used in the 5th IPCC Assessment Report we can derive an ensemble of 15-year periods chosen from the simulations driven by the RCP4.5 scenario from 2005 until 2060 (from a total of 109 simulations, 6104 overlapping 15-year segments) Only 2 per thousand of these 6104 15-year trends are lower than the trends observed during December-to-February in 1998-2012 (HadCRUT4). This occurs in 5% of the trends of the boreal summer season (June-to-August), and in 2 % of the annual means.

What is the spatial 'fingerprint' of the stagnation, or in other words, in which regions are the recent temperature trends more strongly subdued - or even become negative- and in which regions the trends continue unabated ? The following figure tries to give a visual impression of this spatial structure for the December-to-February case. For each grid cell in the HadCRUT4 data set we have computed the linear trend in two periods: 1998-2012 and 1980-1997, and then taken the difference. Negative values indicate the grid-cells where temperature trends have recently slowed ; positive values, where they have recently increased relative to the 'base period' 1980-1997.
Figure 3

This has been also found by Cohen et al. applying slightly different methods. It is obvious that, although trends have recently become smaller in general, the region and the season bearing the brunt of the temperature stagnation is Eurasia in wintertime. We will later call this pattern the DJF [Dec-Jan-Feb] stagnation fingerprint. At first sight this does not seem to dovetail with an increased heat uptake by the ocean nor with a driving role of the Tropical Pacific, as suggested by the recently published paper by Kosaka et al. . It looks to us rather like the effect of the North Atlantic Oscillation on surface temperatures with some additional global contribution. The NAO has shown up in its negative phase in the recent Northern Hemisphere winters, favouring a more meridional circulation and causing polar air intrusions in Eurasia. It is, however, not totally clear how an atmospheric circulation mode, which in principle just shuffles air masses around, can influence global mean temperatures. Wallace et al suggested long ago that the NAO would modify the heat fluxes to the ocean by advecting cold/warm air masses from the continents to the ocean surface. The NAO might also modulate cloud cover that, in turn, could modify the global radiation balance, but this is not widely accepted and, to our knowledge, these lines of research has not be followed up.

Even if the temperature stagnation is indeed related to the NAO, the main question mark in this puzzle still remains : is the stagnation due to internal [natural] stochastic variations or to the external forcings? The NAO is known to be an internal model of climate variability, but it is clearly influenced by the external forcing as well. Future climate projections participating in the CMIP3 project showed that the NAO would tend to shift to a more positive model under greenhouse has warming. Shindell et al. found in climate simulations conducted with the GISS model a few years ago that the NAO could also be affected by solar forcing - and this is the interesting link I would like to put forward here - provided that the climate model includes a well-resolved stratosphere with the corresponding ozone-related chemistry. They found that low solar irradiance would nudge the NAO toward a negative state, and this could explain the extreme European cold temperatures during the Late Maunder Minimum. Is this happening now again, albeit in a lesser magnitude? If it is, then a weaker sun would explain a global tendency to weaker temperature trends, with a stronger slow down over Eurasia. The following figure shows two time series: one describes the strength with which DJF stagnation fingerprint appears in each boreal winter, denoted here stagnation index (in the winters in which the index is strongly positive the spatial fingerprint of the stagnation is particularly strongly represented in the data of that boreal winter); the second time series displays the Total Solar Irradiance. The correlation between both is just suggestive of a weak link, but it is clearly not a definitive proof. Clearly, this fingerprint is expressing itself very strongly in the last few years, but without a corresponding drop in solar activity. Something else is happening that is not captured by this quite preliminary explanation.


Figure 4

Finally, another question mark. Over the past millennium, solar activity and volcanic activity appear statistically anti-correlated. In fact, this is one of the difficulties to disentangle the effect of each of these forcings on surface temperatures in the last centuries. And, intriguingly enough, we see the same phenomenon again in the last 15 years: a weaker sun and more volcanic aerosols. Does anyone dare an explanation ?

Saturday, September 6, 2014

Multiple papers ignored by IPCC document the effect of natural ocean oscillations on climate

Google translation from german (apologies) plus light editing, from Die Kalte Sonne:
IPCC co-founder Bert Bolin had already known the climatic role of the ocean cycles very well
Die Kalte Sonne
A common argument of the IPCC proponents against ocean cycles and their relevance as an important climate factor is that the modern temperature measurements date back only two to three 60-year cycles. Thus, one can not prove the quasi-cyclic nature. This is a nice attempt, but not if considered in light of the supporting literature. Several research teams have reconstructed the various ocean cycles which can now be traced back far into the past. The quasi-cyclic nature is therefore well documented and the attempt to defend the climate alarm goes nowhere. Below we take a look at the latest work on the subject. Additional literature is also mentioned in our book "The cold sun".
Reconstruction of ocean cycles in the past
Deng et al. 2013 : Reconstruction of the PDO since 1853 using corals in the South China Sea
Olafsdottir et al. 2013 : Reconstruction of the AMO and NAO in Iceland for the past 3000 years
Svendsen et al. 2014: reconstruction of the AMO for the last 200 years
Chylek et al. 2012: reconstruction of the AMO for the last 660 years based on ice cores 
excerpt from the Executive Summary: A longer time scale AMO component of 45-65 years, Which HAS BEEN CLEARLY seen in the 20th century SST data, is detected only in central Greenland ice cores . We find a significant difference in between the AMO cycles falling on the Little Ice Age (LIA) and the Medieval Warm Period (MWP). The LIA what dominated by a ~ 20 year AMO cycle with no other decadal or multidecadal scale variability above the noise level. HOWEVER, falling on the MWP preceding- the 20 year cycle what Replaced by a longer scale cycle centered near a period of 43 years with a 11.5 year periodicity Further.
Chiessi et al. 2013: AMO in Brazil during the last 5000 years
Olsen et al. 2012 : NAO the last 5200 years 
excerpt from the Executive Summary: The North Atlantic Oscillation Influences climate in the Arctic region and northern Europe.Reconstructions of circulation patterns associated with the North Atlantic Oscillation from a 5,200-year-long lake sediment record did suggest the atmospheric circulation Responded to significant transitions in Northern Hemisphere climate. See also report in The Hockeyschtick .


Ocean cycles fired heating 1977-1998
A Swedish scientist told us that the IPCC must certainly have known the importance of the ocean cycles in the early phase of his ministry. One of the IPCC's co-founder, who died in 2007, Bert Bolin said to have spoken at a meeting in the establishment phase of the IPCC in the 1980s openly about the 60-year cycle of the ocean cycles. At that time predicted warming Bolin 30 years since the previous 30 years were rather characterized by cooling. The following is the text of the email:
I have heard from a participant at this meeting, with politicians and party Officials, Bolin Explained: The last 30 years we have had a slight cooling. Before 1910-1940 did we had a warming period. Before it did what cooling. It Seems did the temperature is going up and down with a period of 60 years, so it is reasonable to expect the next 30 years did want to be warm. Bolin obviously had some idea of ​​PDO influence on climate already at this time.
30 years heating it then but it was not entirely, but the forecast of the IPCC Bolin was initially planning reliability and credibility among the population. The IPCC would have had a harder many times when he would have been founded around the turn of the millennium, the beginning of the still ongoing temperature plateaus.
Even the art is now becoming increasingly clear that during the heating phase 1977-1998, all is not received with the right things and the alleged power of the CO 2 is to a large extent rather to the account "supporting means", so the warming effect of the ocean cycles. Thus wrote Large & Yeager, 2012 in the Journal of Climate that the warming 1984-2006 of "natural variability" (herewith are probably meant the ocean cycles) was dominated and the long-term climate change played only a minor role.
In March 2014, published research group led by Petr Chylek in the Geophysical Research Letters an important work titled "The Atlantic Multidecadal Oscillation as a dominant factor of oceanic influence on climate". In it, the authors expect to one-third of global warming 1977-1998 the warming positive phase of the AMO-ocean cycle. The work was extensively discussed on WUWT ( here , here , here ). Excerpt from the abstract:
The anthropogenic effects account for about two Thirds of the post-1975 global warming with one third being due to the positive phase of the AMO.
End of May 2014 put a team around Jacques Servain in the journal Climate Dynamics and interpreted according to the warming from 1977 to 1998 in the Atlantic also associated with the warm phase of the AMO.

Ocean cycles prevent further warming since 1998
Gradually it dawns experts also that probably the current warming pause the cooling phase of the ocean cycles is owed. We had already reported several times at this point:

Even the PIK Potsdam Institute mitlerweile recognizes the cooling role of the AMO in connection with the current Erwärmungshiatus (seeSchleussner et al. 2,014 ).
Case studies for climate-influencing effect of ocean cycles are not lacking. In the book of Salomon Kroonenberg ("The thousand-year cycle") is a chapter on the development of water level of the Caspian Sea, which is influenced mainly by the 60-year-old PDO / AMO cycle. The same is also in the Great Salt Lake in Utah is the case, as Wang et al. 2010 documented. And also the climate of Myanmar was under the PDO control, asD'Arrigo and Ummenhofer (2014) were able to show. In February 2014 wrote Mendoza et al. in the journal Atmospheric Research, the climate in Mexico is also controlled by the PDO, with probably the changing Cloud cover plays an important role. In Germany could Lohmann et al. (2013)demonstrate ocean cycles in cave stalactites. The 60-year-old AMO and NAO-cyclicality also appeared in Italy in a snow statistics for the past 300 years, as in Enzi et al. 2014 is read. And the deep-water temperatures in the Arctic Svalbard behaved cyclically, conducted by the NAO ( Ferré et al. 2,012 ).

Possible solar influence on ocean cycles
There is much evidence that the 60-year rhythm of the ocean cycles pulsates freely independently in the climate system. However, there seems to be such studies indicate some interactions with the solar activity and perhaps the planetary orbits. How could Harry van Loon and Gerald Meehl 2014 show in the Geophysical Research Letters, that it does play a role in climate, whether the PDO and NAO occurs in phase with the 11-year solar cycle or in phase opposition.
In February 2014, published group to Mads Knudsen Faurschou in Nature Communications, a work that describes a clear influence of the AMO by solar activity. Here is the short version:
Evidence for external forcing of the Atlantic Multidecadal Oscillation since termination of the Little Ice Age
The Atlantic Multidecadal Oscillation (AMO) Represents a significant driver of Northern Hemisphere climate, but the forcing mechanisms pacing the AMO REMAIN poorly be understood. Here we use the available proxy records to investigate the influence of solar and volcanic forcing on the AMO over the load ~ 450 years. The evidence did Suggests external forcing played a dominant role in pacing the AMO after termination of the Little Ice Age (LIA; ca. 1400-1800), with at instantaneous impact on mid-latitude sea-surface Temperatures did spread across the North Atlantic over the ensuing ~ 5 years. In contrast, the role of external forcing what more ambiguous falling on the LIA. Our study Further Suggests did the Atlantic Meridional Overturning Circulation is Important for linking external forcing with North Atlantic sea-surface Temperatures, a conjecture did reconciles two opposing theories Concerning the origin of the AMO.
And Lin et al. 2014 report in a publication in Climate of the Past of a solar influence of the AMO. Previously had Muthers et al. , such interaction interpreted. A solar context, the NAO with the solar activity was of Boberg & Lundstedt 2002 reports.

Prediction
While it used to always meant the ocean cycles were unpredictable and arbitrary, but it has now recognized that there is a system and forecast possibilities. For the AMO this last set Hazeleger et al. 2013 in the Journal of Geophysical Research tight.
Li et al. 2,013 go in the Geophysical Research Letters even go a step further and developed a temperature forecast for the next 15-20 years based on the NAO and AMO-development. Here is the summary of your work:
NAO implicated as a predictor of Northern Hemisphere mean temperature Multidecadal variability
The twentieth century Northern Hemisphere mean surface temperature (NHT) is Characterized by a multidecadal warming-cooling-warming pattern Followed by a flat trend since about 2000 (recent warming hiatus). Here we demonstrate the North Atlantic Oscillation did (NAO) is implicated as a useful predictor of NHT multidecadal variability. Observational analysis shows did the NAO leads Detrended Both the NHT and oceanic Atlantic Multidecadal Oscillation (AMO) by 15-20 years. Theoretical analysis illuminates did the NAO precedes NHT multidecadal variability through its delayed effect on the AMO due to the large thermal inertia associated with slow oceanic Processes. An NAO-based linear model is established to predict the NHT THEREFORE, Which gives an excellent hindcast for NHT in 1971-2011 with the recent flat trend well predicted. NHT in 2012-2027 is predicted to fall slightly over the next Decades, due to the recent NAO decadal weakening did temporarily offsets the anthropogenically induced warming.
Did you catch the last sentence of the abstract? The temperature of the northern hemisphere is slightly cool to 2027, as the NAO will weaken.Nothing else stood in 2012 in our book "The cold sun" ...

Sunday, April 6, 2014

New paper finds natural ocean oscillations responsible for record cold US winter, not CO2

A new paper published in Environmental Research Letters finds the natural ocean oscillations the Atlantic Multidecadal Oscillation [AMO] and the North Atlantic Oscillation [NAO] may be responsible for the recent resurgence of record cold extreme temperatures in the Eastern US and Europe, and that extreme cold winters in these regions will persist as long as the AMO remains positive. The AMO shifted from negative to positive around the year 2000, along with the "pause" in global warming. A typical AMO cycle lasts ~60-70 years, and thus the current positive phase of the AMO and extreme cold US winters could occur for another ~18 or so years.

According to the authors, "Our statistical analyses suggest that the AMO signal precedes the NAO by 10–15 years with an interesting predictability window for decadal forecasting... As in observations, the positive phase of the AMO results in more frequent negative NAO—and blocking episodes in winter that promote the occurrence of cold extreme temperatures over the eastern United States and Europe. Thus, it is plausible that the AMO plays a role in the recent resurgence of severe winter weather in these regions and that wintertime cold extremes will be promoted as long as the AMO remains positive."


Warmists such as Jennifer Francis have made the silly claim that the record US cold winter was due to man-made global warming causing jet stream blocking, but this paper and many others prove natural cycles are responsible, not CO2. In addition, both the AMO and NAO, as well as other ocean & atmospheric oscillations, have been linked to solar activity. 


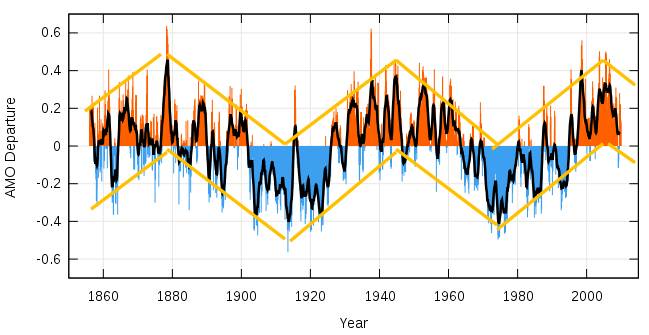
AMO index with a Fourier analysis showing a cycle length of ~60-70 years. The AMO shifted to the positive phase [above zero] around the beginning of the 21st century, so the positive phase has another ~18 or so years to go. 

Wavelet analysis shows predominant periodicity of AMO is ~64 years. How to read wavelet analyses.


Forcing of the wintertime atmospheric circulation by the multidecadal fluctuations of the North Atlantic ocean

OPEN ACCESS


Yannick Peings and Gudrun Magnusdottir

Tag this article PDF (3.18 MB) View article

The North Atlantic sea surface temperature exhibits fluctuations on the multidecadal time scale, a phenomenon known as the Atlantic Multidecadal Oscillation (AMO). This letter demonstrates that the multidecadal fluctuations of the wintertime North Atlantic Oscillation (NAO) are tied to the AMO, with an opposite-signed relationship between the polarities of the AMO and the NAO. Our statistical analyses suggest that the AMO signal precedes the NAO by 10–15 years with an interesting predictability window for decadal forecasting. The AMO footprint is also detected in the multidecadal variability of the intraseasonal weather regimes of the North Atlantic sector. This observational evidence is robust over the entire 20th century and it is supported by numerical experiments with an atmospheric global climate model. The simulations suggest that the AMO-related SST anomalies induce the atmospheric anomalies by shifting the atmospheric baroclinic zone over the North Atlantic basin. As in observations, the positive phase of the AMO results in more frequent negative NAO—and blocking episodes in winter that promote the occurrence of cold extreme temperatures over the eastern United States and Europe. Thus, it is plausible that the AMO plays a role in the recent resurgence of severe winter weather in these regions and that wintertime cold extremes will be promoted as long as the AMO remains positive.