Showing posts sorted by relevance for query arctic sea ice winds. Sort by date Show all posts

Tuesday, September 16, 2014

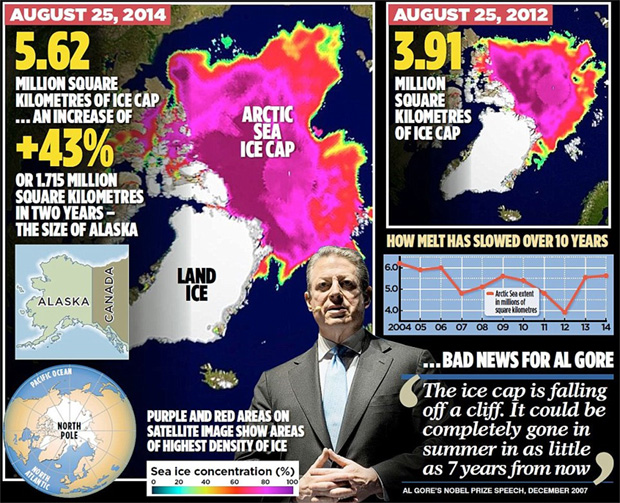
Preliminary Arctic sea ice summer minimum up 48% since 2012 minimum

According to a report from the NSIDC released today, Arctic sea ice extent at the end of the summer melt season stood at 5.07 million square kilometers as of yesterday, although "weather conditions near the ice edge heavily influence the timing of the minimum, which has occurred as late as September 23. We are now a day past the 1981 to 2010 average minimum date of September 15."

Compared to the Arctic sea ice minimum of 3.41 million square kilometers on September 16, 2012, sea ice extent was ~48% higher at 5.07 million km2 on September 15, 2014. 


The NSIDC also confirms the Northwest Passage remains closed at the end of the melt season, despite Al Gore's claim "the entire North 'polarized' cap will disappear" by 2013. 


Regardless, much of the intense fixation on Arctic sea ice extent is likely misplaced due to dominant influences of natural variation over AGW on Arctic sea ice extent.


Melt season ending

September 16, 2014  NSIDC

The end of this year’s Arctic sea ice melt season is imminent and the minimum extent will be slightly lower than last year’s, making it the sixth lowest extent in the satellite record. Earlier in the month, a small area of the Laptev Sea ice edge was within five degrees of the North Pole. This appears to be the result of persistent southerly winds from central Siberia. Meanwhile, Antarctic sea ice is poised to set a record maximum this year, now at 19.7 million square kilometers (7.6 million square miles) and continuing to increase.


Overview of Conditions
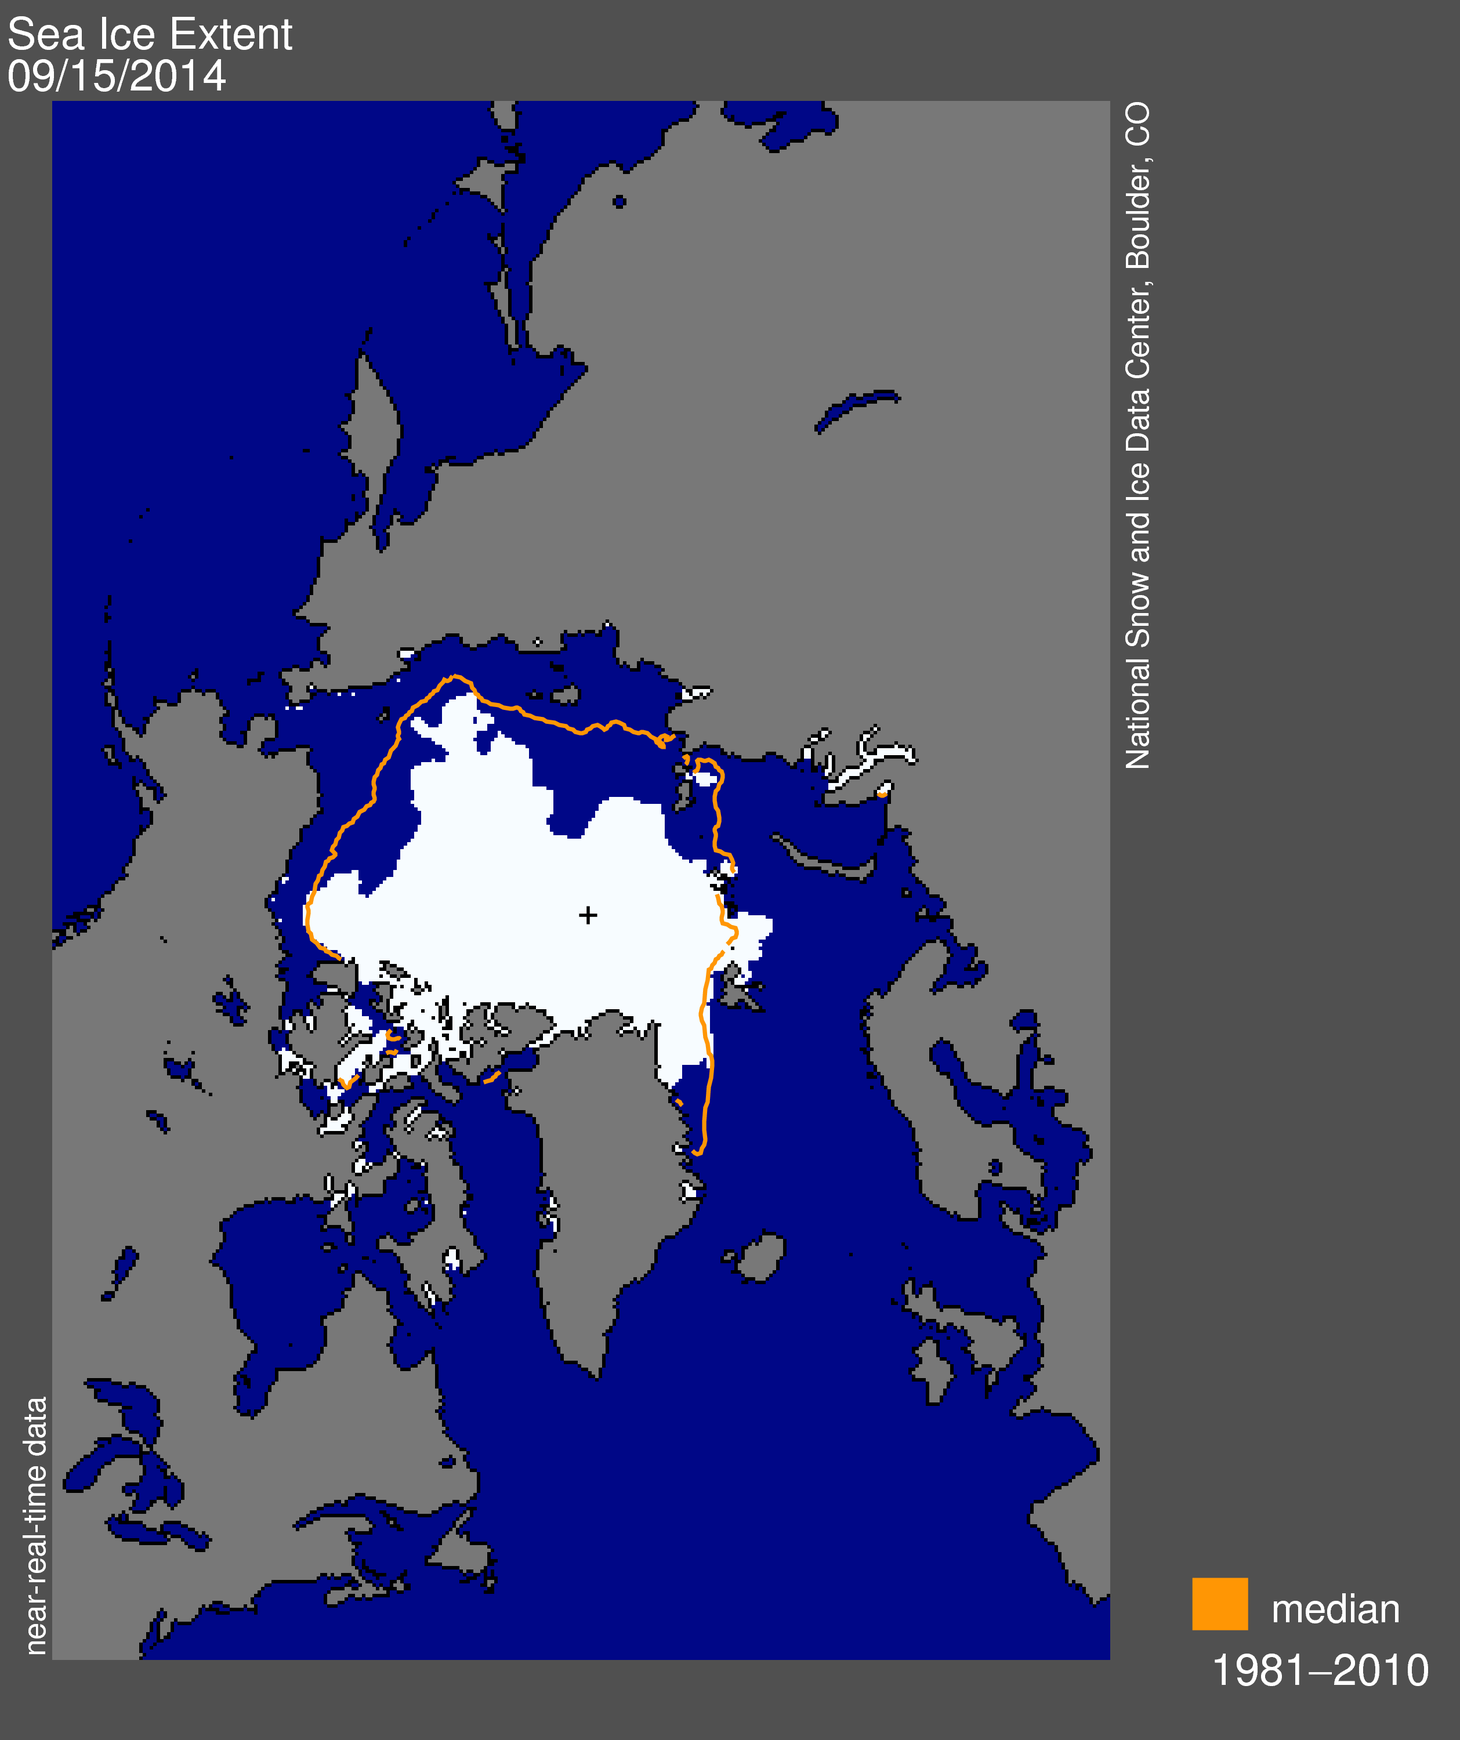

Figure 1. Arctic sea ice extent for September 15, 2014 was 5.07 million square kilometers (1.96 million square miles). The orange line shows the 1981 to 2010 average extent for that day. The black cross indicates the geographic North Pole. Sea Ice Index data. About the data  Credit: National Snow and Ice Data Center High-resolution image

Arctic sea ice extent for September 15 was 5.07 million square kilometers (1.96 million square miles). This is only 30,000 square kilometers (11,600 square miles) below the same date last year, yet sea ice extent remains low compared to the long-term 1981 to 2010 average. As is typical for this time of year, weather conditions near the ice edge heavily influence the timing of the minimum, which has occurred as late as September 23. We are now a day past the 1981 to 2010 average minimum date of September 15.

Conditions in context
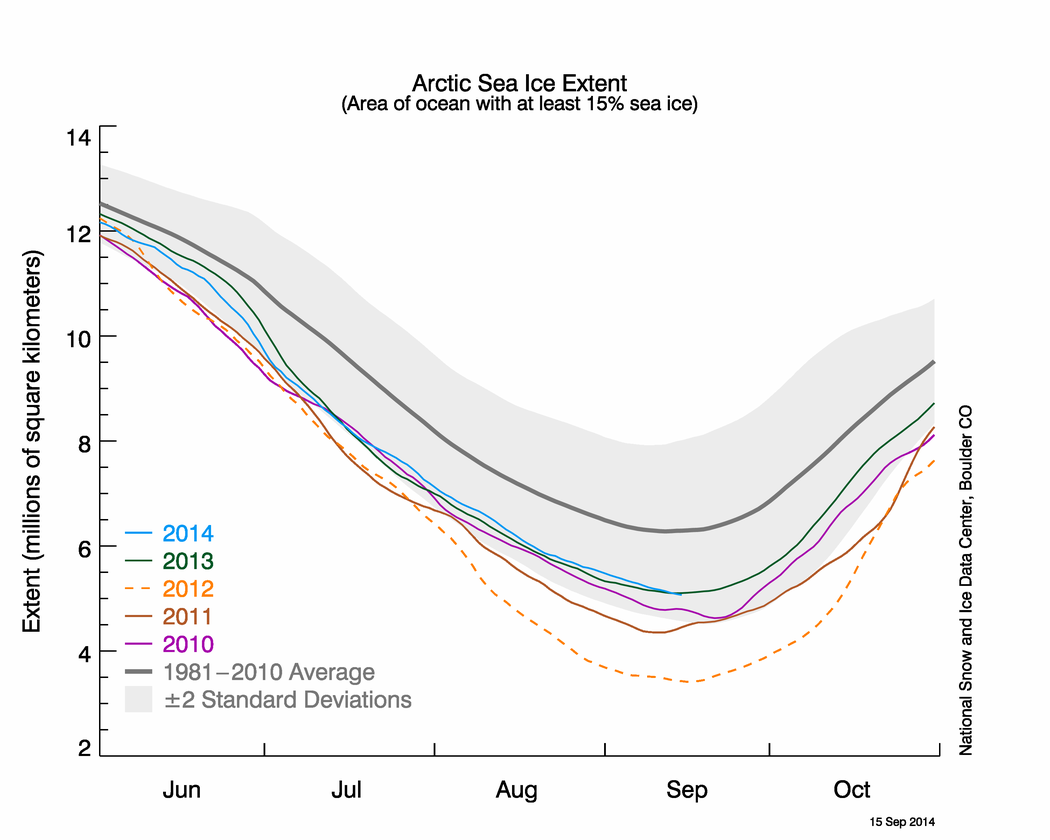


Figure 2. The graph above shows Arctic sea ice extent as of September 15, 2014, along with daily ice extent data for four previous years. 2014 is shown in blue, 2013 in green, 2012 in orange, 2011 in brown, and 2010 in purple. The 1981 to 2010 average is in dark gray. Sea Ice Index data. Credit: National Snow and Ice Data Center High-resolution image

Sea ice extent declined at a rate of 28,700 square kilometers (11,100 square miles) per day through the first half of September. This is nearly twice as high as the 1981 to 2010 average rate of decline for this period of 16,200 square kilometers (6,200 square miles) per day. As was the case for the beginning of the month, extent remains below average in all sectors of the Arctic except for a region in the Barents Sea, east of Svalbard. There are areas of fairly low concentration ice north of the East Siberian and Chukchi seas that may still melt out or compact from wind-driven drifting.

However, as in 2013, a large area in the East Siberian Sea remains ice covered, helping to keep the overall extent higher for this time of year than observed since 2007. Last summer that area was covered by first-year ice that did not melt out under cooler-than-average conditions. This year, a region of second-year ice appears to have helped stabilize ice loss there.

The Northwest Passage remains closed, while the Northern Sea Route is still largely clear of ice.

A new ice edge
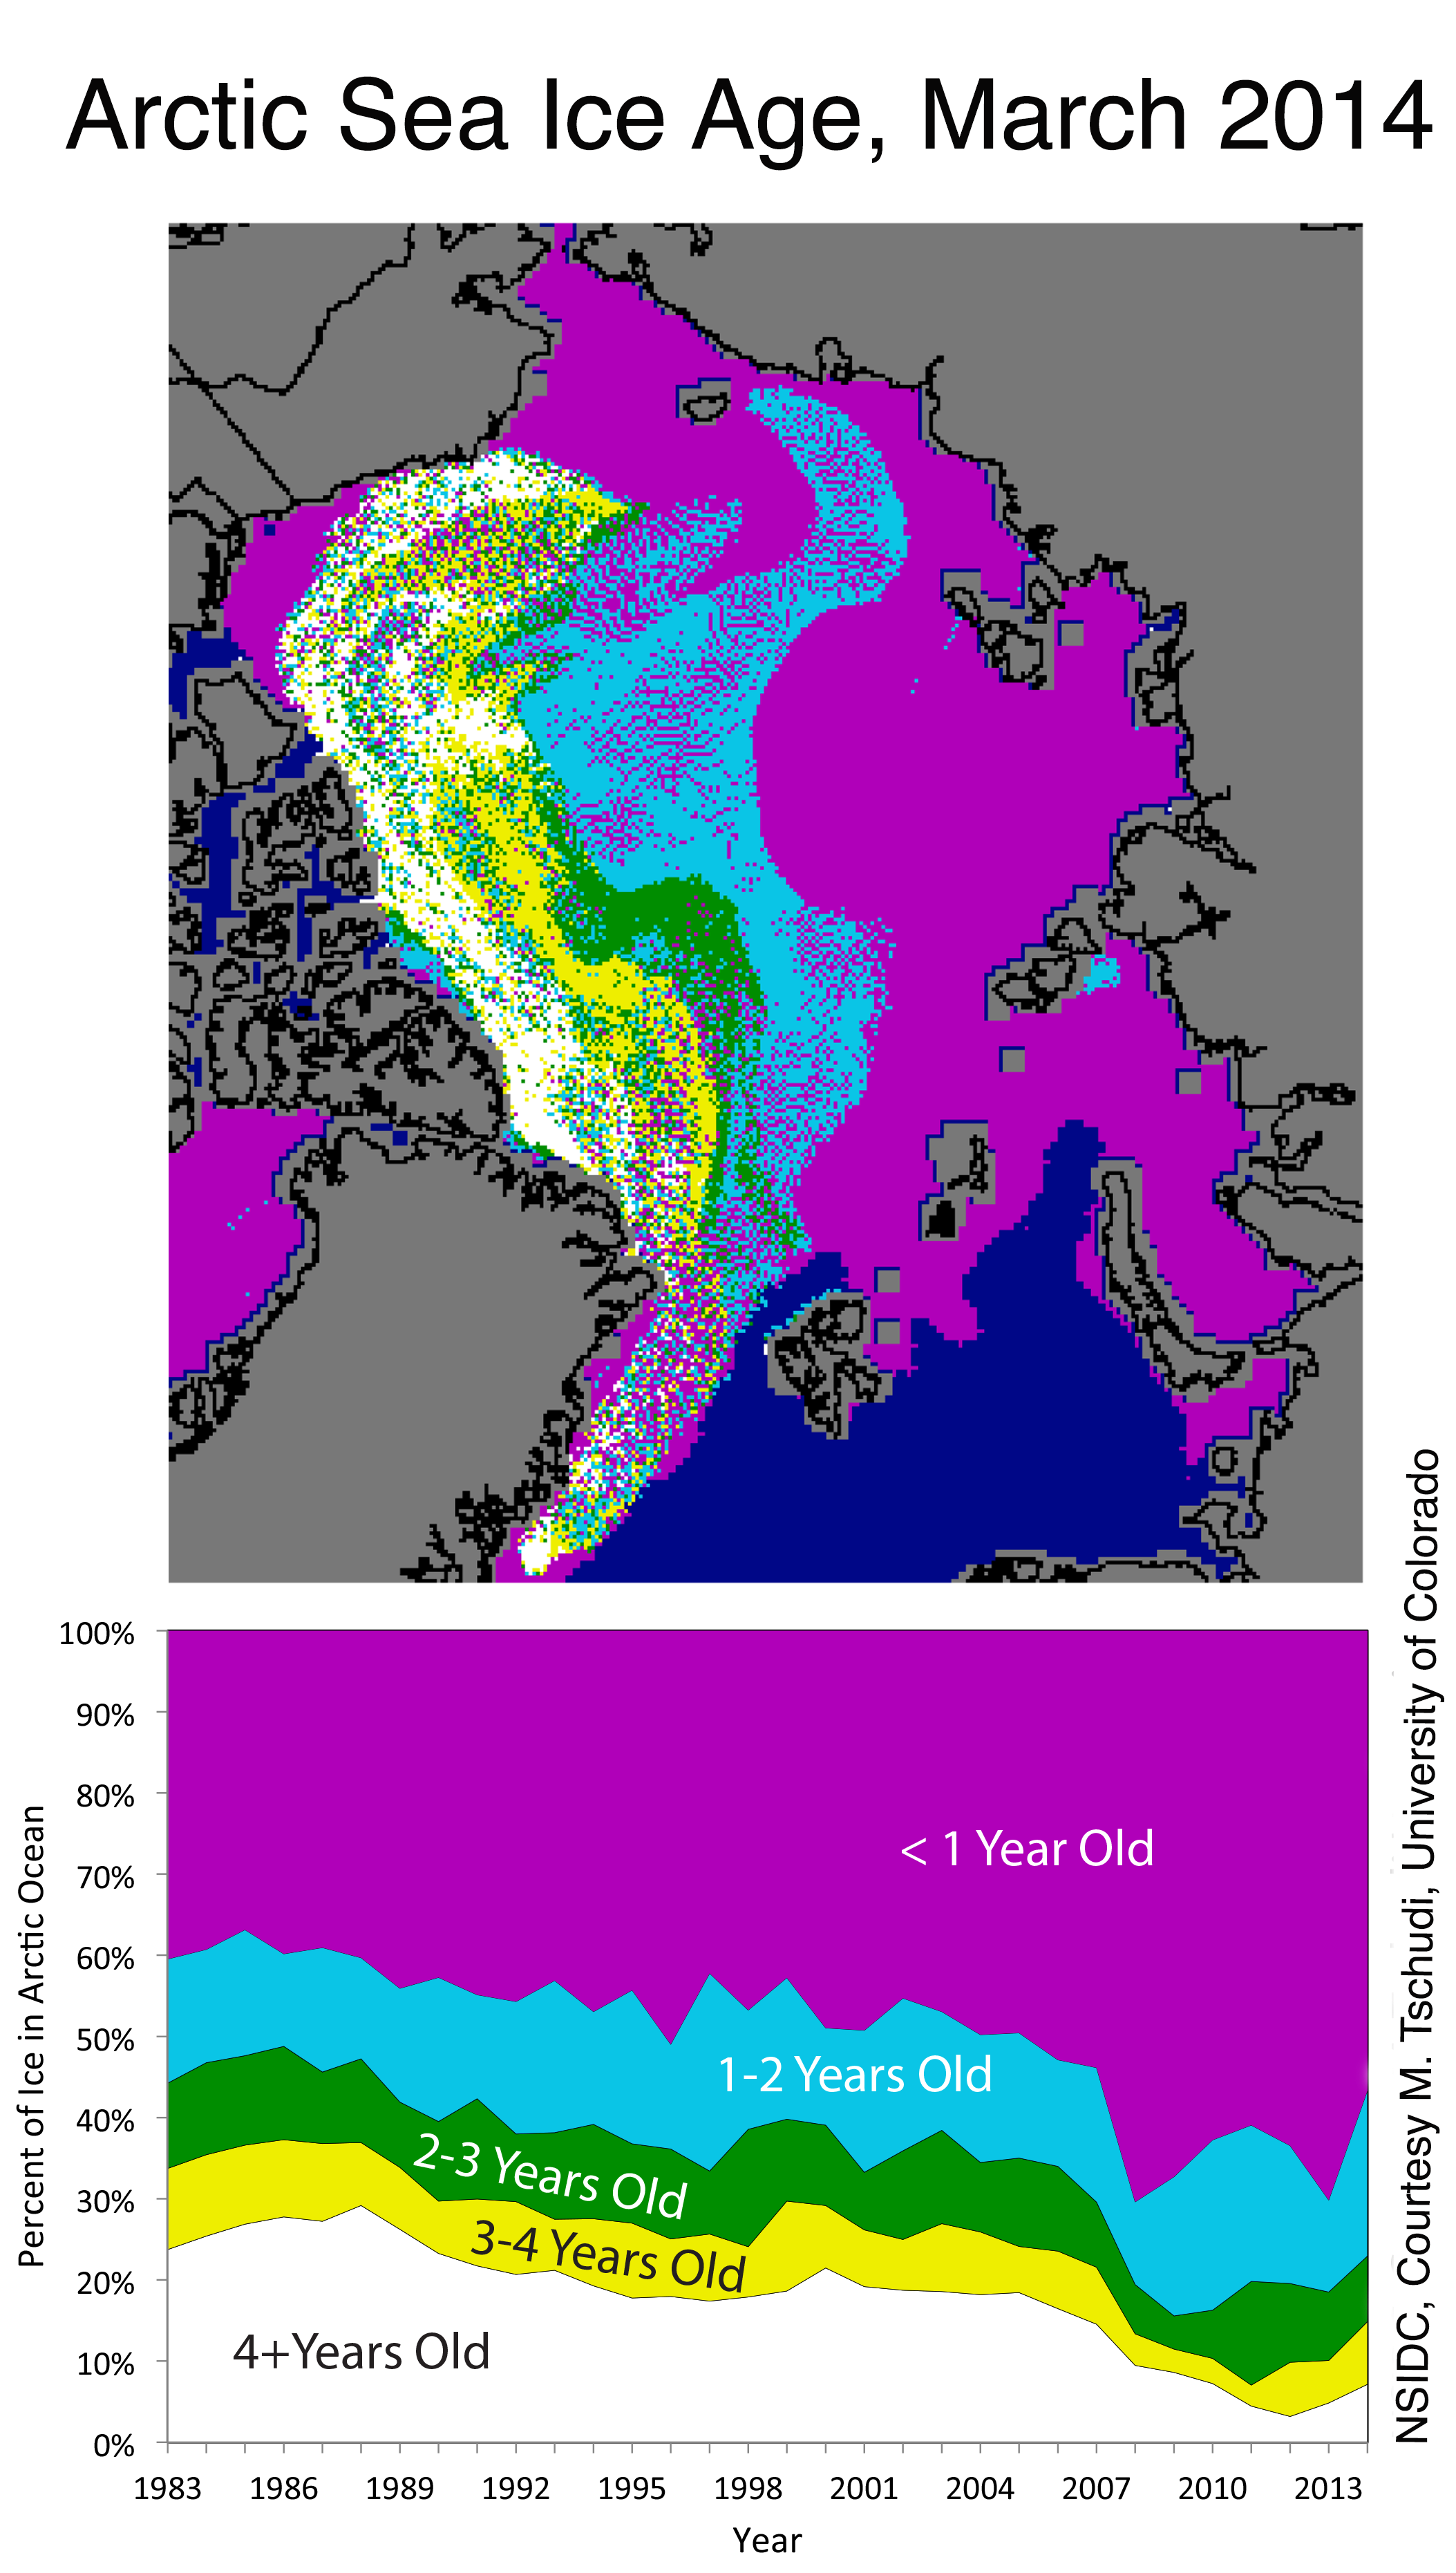

Figure 3a. The map at top shows the ages of ice in the Arctic at the beginning of March 2014; the bottom graph shows how the percentage of ice in each age group has changed from 1983 to 2014 . Credit: NSIDC, courtesy M. Tschudi, University of Colorado High-resolution image

Through the first half of September, the ice edge slowly retreated north of the Laptev Sea and is now within five degrees latitude of the North Pole. This is the most northerly position that the ice edge has been recorded over the period of satellite observations in this region. A large part of this region was also ice free in 2007. The reasons for the strong ice retreat in this sector are, at present, not entirely clear but we offer some initial insights.
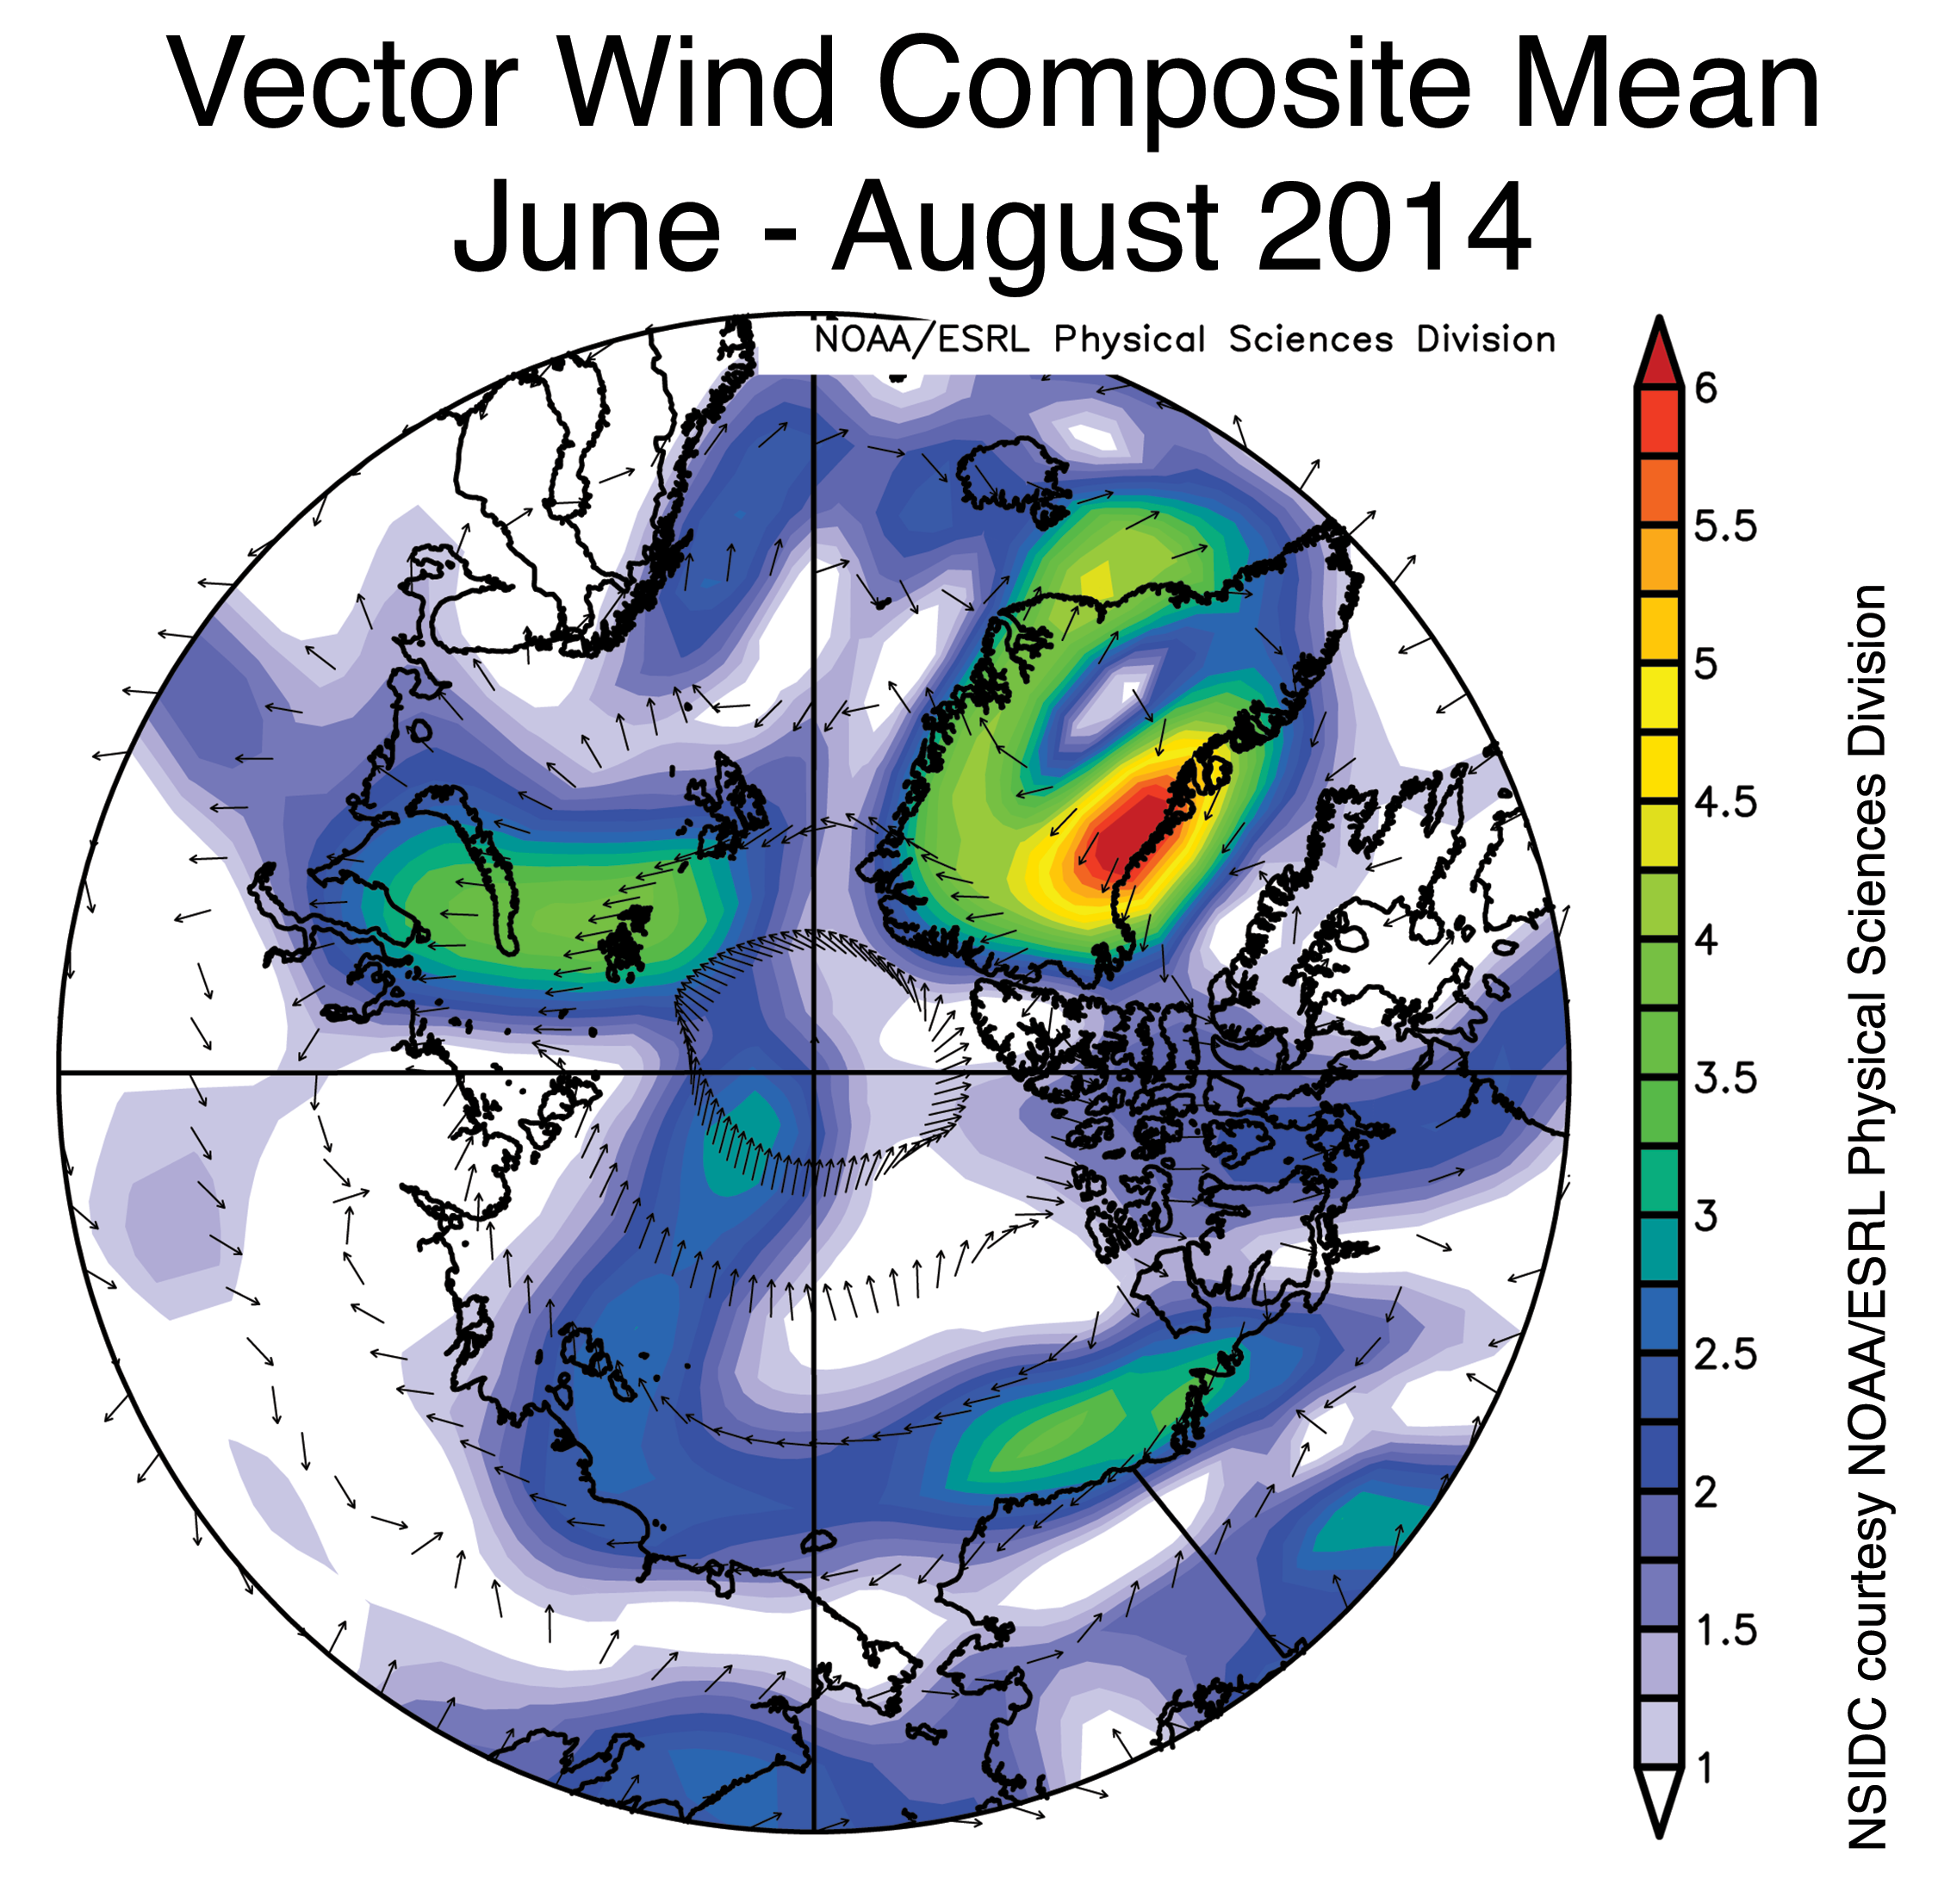


Figure 3b. This map shows surface wind patterns over the Arctic region from June to August 2014. Credit: NSIDC courtesy NOAA/ESRL Physical Sciences Division High-resolution image

In April, we discussed the pattern of ice age across the Arctic as the melt season began. In general, younger ice tends to be thinner ice. Areas of young ice are more likely to melt out during the summer than areas of old ice. The ice age figure from that post, reproduced here (Figure 3a), shows a strong northward extension of ice less than one year of age along the same general longitudes that open water has developed. Given the general circulation of the sea ice away from the Siberian shores, this area of thin ice prone to melting out would have tended to advance further northward through the melt season. Indeed, average sea level pressures this summer featured a pattern of surface winds particularly conducive to transporting thinner ice northward in the Laptev Sea sector (Figure 3b). To the east, winds were calmer and an arm of older, thicker second-year ice there may have helped to limit melt out and northward advection.

Sea surface temperature update


Figure 4. These maps show Arctic sea surface temperatures (left) and temperature anomalies (right) for August 2014, in degrees Celsius. Sea surface temperature data are from the National Climatic Data Center’s OIv2 “Reynolds” data set, a blend of satellite (Advanced Very High Resolution Radiometer) and in situ data designed to provide a bulk or mixed layer temperature. Ice edge data are from NSIDC near-real time passive microwave data. Credit: Mike Steele/University of Washington High-resolution image

As one may expect with an early retreat of sea ice, sea surface temperatures in the Laptev Sea were higher than average by up to 5 degrees Celsius (9 degrees Fahrenheit), with up to 3 degrees Celsius (5 degrees Fahrenheit) anomalies extending north of 80 degrees North for the first time since 2007. Early ice retreat and high sea surface temperatures are not unusual for this area and have appeared every summer since 2007, with the exception of 2008. The date of ice opening in the Laptev Sea is not particularly unusual in 2014 either. Open water and warming ocean temperatures started in early June. However, this summer there was a rapid northward progression of the ice edge in this area, especially along about longitude 140 degrees East, which allowed the sun to warm the resulting open water.

Over other parts of the Arctic, sea surface temperatures were not particularly noteworthy, except for cooler-than-average conditions in the northern Barents and Kara seas where the ice has remained extensive compared to recent summers. This reverses a recent trend toward warming and ice retreat in these areas, noted in last year’s sea surface temperature update. Preliminary analysis indicates that these changes are forced by local meteorological conditions, rather than oceanic heat transport by Atlantic water.
Further reading

Steele, M., S. Dickinson, and J. Zhang. 2014. Seasonal ice loss in the Beaufort Sea: Toward synchronicity and prediction. Journal of Geophysical Research-Oceans. In review.

Thursday, October 25, 2012

New study finds growth of Antarctic sea ice accelerated 53% since 2006


Opposite Behaviors? Arctic Sea Ice Shrinks, Antarctic Grows


September 2012 witnessed two opposite records concerning sea ice. Two weeks after the Arctic Ocean's ice cap experienced an all-time summertime low for the satellite era (left), Antarctic sea ice reached a record winter maximum extent (right). But sea ice in the Arctic has melted at a much faster rate than it has expanded in the Southern Ocean, as can be seen in this image by comparing the 2012 sea ice levels with the yellow outline, which in the Arctic image represents average sea ice minimum extent from 1979 through 2010 and in the Antarctic image shows the median sea ice extent in September from 1979 to 2000. (Credit: NASA/Goddard Space Flight Center Scientific Visualization Studio and NASA Earth Observatory/ Jesse Allen)
ScienceDaily (Oct. 23, 2012) — The steady and dramatic decline in the sea ice cover of the Arctic Ocean over the last three decades has become a focus of media and public attention. At the opposite end of Earth, however, something more complex is happening.

A new NASA study shows that from 1978 to 2010 the total extent of sea ice surrounding Antarctica in the Southern Ocean grew by roughly 6,600 square miles every year, an area larger than the state of Connecticut. And previous research by the same authors indicates that this rate of increase has recently accelerated, up from an average rate of almost 4,300 square miles per year from 1978 to 2006. [an increase of 53% between 1978-2010 vs. 1978-2006 rate]

"There's been an overall increase in the sea ice cover in the Antarctic, which is the opposite of what is happening in the Arctic," said lead author Claire Parkinson, a climate scientist with NASA's Goddard Space Flight Center, Greenbelt, Md. "However, this growth rate is not nearly as large as the decrease in the Arctic."

Earth's poles have very different geographies. The Arctic Ocean is surrounded by North America, Greenland and Eurasia. These large landmasses trap most of the sea ice, which builds up and retreats with each yearly freeze-and-melt cycle. But a large fraction of the older, thicker Arctic sea ice has disappeared over the last three decades. The shrinking summer ice cover has exposed dark ocean water that absorbs sunlight and warms up, leading to more ice loss.

On the opposite side of the planet, Antarctica is a continent circled by open waters that let sea ice expand during the winter but also offer less shelter during the melt season. Most of the Southern Ocean's frozen cover grows and retreats every year, leading to little perennial sea ice in Antarctica.

Using passive-microwave data from NASA's Nimbus 7 satellite and several Department of Defense meteorological satellites, Parkinson and colleague Don Cavalieri showed that sea ice changes were not uniform around Antarctica. Most of the growth from 1978 to 2010 occurred in the Ross Sea, which gained a little under 5,300 square miles of sea ice per year, with more modest increases in the Weddell Sea and Indian Ocean. At the same time, the region of the Bellingshausen and Amundsen Seas lost an average of about 3,200 square miles of ice every year.

Parkinson and Cavalieri said that the mixed pattern of ice growth and ice loss around the Southern Ocean could be due to changes in atmospheric circulation. Recent research points at the depleted ozone layer over Antarctica as a possible culprit. Ozone absorbs solar energy, so a lower concentration of this molecule can lead to a cooling of the stratosphere (the layer between six and 30 miles above Earth's surface) over Antarctica. At the same time, the temperate latitudes have been warming, and the differential in temperatures has strengthened the circumpolar winds flowing over the Ross Ice Shelf.

"Winds off the Ross Ice Shelf are getting stronger and stronger, and that causes the sea ice to be pushed off the coast, which generates areas of open water, polynyas," said Josefino Comiso, a senior scientist at NASA Goddard. "The larger the coastal polynya, the more ice it produces, because in polynyas the water is in direct contact with the very cold winter atmosphere and rapidly freezes." As the wind keeps blowing, the ice expands further to the north.

This year's winter Antarctic sea ice maximum extent, reached two weeks after the Arctic Ocean's ice cap experienced an all-time summertime low, was a record high for the satellite era of 7.49 million square miles, about 193,000 square miles more than its average maximum extent for the last three decades.

The Antarctic minimum extents, which are reached in the midst of the Antarctic summer, in February, have also slightly increased to 1.33 million square miles in 2012, or around 251,000 square miles more than the average minimum extent since 1979.

The numbers for the southernmost ocean, however, pale in comparison with the rates at which the Arctic has been losing sea ice -- the extent of the ice cover of the Arctic Ocean in September 2012 was 1.32 million square miles below the average September extent from 1979 to 2000. The lost ice area is euivalent to roughly two Alaskas.

Parkinson said that the fact that some areas of the Southern Ocean are cooling and producing more sea ice does not disprove a warming climate.

"Climate does not change uniformly: The Earth is very large and the expectation definitely would be that there would be different changes in different regions of the world," Parkinson said. "That's true even if overall the system is warming." Another recent NASA study showed that Antarctic sea ice slightly thinned from 2003 to 2008, but increases in the extent of the ice balanced the loss in thickness and led to an overall volume gain.
The new research, which used laser altimetry data from the Ice, Cloud, and land Elevation Satellite (ICESat), was the first to estimate sea ice thickness for the entire Southern Ocean from space.

Records of Antarctic sea ice thickness are much patchier than those of the Arctic, due to the logistical challenges of taking regular measurements in the fierce and frigid waters around Antarctica. The field data collection is mostly limited to research icebreakers that generally only travel there during spring and summer -- so the sole means to get large-scale thickness measurements is from space.

"We have a good handle of the extent of the Antarctic sea ice, but the thickness has been the missing piece to monitor the sea ice mass balance," said Thorsten Markus, one of the authors of the study and Project Scientist for ICESat-2, a satellite mission designed to replace the now defunct ICESat. ICESat-2 is scheduled to launch in 2016. "The extent can be greater, but if the sea ice gets thinner, the volume could stay the same."

Wednesday, August 3, 2011

New paper finds Arctic sea ice strongly linked to varying storm activity

Warmists often claim changes in Arctic sea ice are a consequence of allegedly-anthropogenic global warming. However, a paper published today in the Journal of Geophysical Research finds that "dramatic interannual changes" in Arctic sea ice extent are due to varying storm activity in the months of May-July, which impacts "cloud cover and ice motion, and consequently sea ice melt." The authors find fewer cyclones in the Arctic Ocean "appear to favor a low sea ice area at the end of the melt season." Thus, the alleged connection between AGW and Arctic sea ice extent becomes all the more elusive.
JOURNAL OF GEOPHYSICAL RESEARCH, VOL. 116, D15105, 10 PP., 2011

Dramatic interannual changes of perennial Arctic sea ice linked to abnormal summer storm activity 

Key Points:

Interannual changes of Arctic sea ice are related to varying storm activity
Fewer summer storms favor low sea ice at the end of the melt season
Storms impact the cloud cover and ice motion, and consequently sea ice melt

James A. Screen et al

The perennial (September) Arctic sea ice cover exhibits large interannual variability, with changes of over a million square kilometers from one year to the next. Here we explore the role of changes in Arctic cyclone activity, and related factors, in driving these pronounced year-to-year changes in perennial sea ice cover. Strong relationships are revealed between the September sea ice changes and the number of cyclones in the preceding late spring and early summer. In particular, fewer cyclones over the central Arctic Ocean during the months of May, June, and July appear to favor a low sea ice area at the end of the melt season. Years with large losses of sea ice are characterized by abnormal cyclone distributions and tracks: they lack the normal maximum in cyclone activity over the central Arctic Ocean, and cyclones that track from Eurasia into the central Arctic are largely absent. Fewer storms are associated with above-average mean sea level pressure, strengthened anticyclonic winds, an intensification of the transpolar drift stream, and reduced cloud cover, all of which favor ice melt. It is also shown that a strengthening of the central Arctic cyclone maximum helps preserve the ice cover, although the association is weaker than that between low cyclone activity and reduced sea ice. The results suggest that changes in cyclone occurrence during late spring and early summer have preconditioning effects on the sea ice cover and exert a strong influence on the amount of sea ice that survives the melt season.

Wednesday, January 29, 2014

NSIDC: 2013 sea ice was at record highs for the satellite era, record high winter extent & summer minimum

An article published today in Nature Climate Change notes, 
"The National Snow and Ice Data Center report that 2013 was above average in sea ice extent — a record, for the satellite era, with the largest winter extent as well as the highest summer minimum. This is on top of a small but increasing trend, 1–4%, in Antarctic sea ice."
The article also says "weather events make the news but shouldn't be confused with climate change impacts," which Nature Climate Change will promptly forget as soon as the next summer heat wave.


Icy times

Nature Climate Change 4, 75 (2014) doi:10.1038/nclimate2131

Published online January 29, 2014

Weather events make the news but shouldn't be confused with climate change impacts.

Recent weather events are being discussed in certain circles as proof that climate change is not happening. The 'Polar Vortex' caused Arctic conditions in the United States but this is thought to be an extreme weather event with weak links to climate change (http://go.nature.com/MDd8oA). [Actually, no links to climate change] A number of ships became 'stuck' in Antarctic sea ice this austral summer over the Christmas–New Year holiday period. Social media and the internet were awash with comments on the irony of heavy ice trapping climate change, or global warming, researchers.
We often hear reports of the declining Arctic sea ice cover but much less attention is given to the Antarctic, which, in contrast to the Arctic, has slightly increasing sea ice cover. But why is there such a difference in climate change impacts on the sea ice at the two polar regions? Consider the different environments — the Arctic Ocean is semi-enclosed by land that provides a becalmed sea on which sea ice forms, whereas the Antarctic continent stands alone with sea ice growing from its edges in the circumpolar Southern Ocean. There the sea ice is more easily broken up by winds and waves from the open ocean and is able to drift away from the continent, north into warmer waters. Antarctic winter sea ice covers up to 18 million km2, which shrinks to around 3 million km2 by the end of the summer. [Thanks Nature Climate Change for just pointing out that climate change should cause a greater decrease in Antarctic sea ice than Arctic, as falsely predicted by climate models, and opposite of observations.]
The National Snow and Ice Data Center report that 2013 was above average in sea ice extent — a record, for the satellite era, with the largest winter extent as well as the highest summer minimum. This is on top of a small but increasing trend, 1–4%, in Antarctic sea ice (http://nsidc.org/arcticseaicenews/, 8 January 2014).
So, was the record ice extent the reason for the ships becoming trapped? Sea ice is a dynamic environment, with winds and ocean currents shifting the ice. Icebergs are an additional hazard to be dealt with. Ships use the best available information to plot a course through this environment, but it can all change very quickly. Katabatic winds, those that flow off the continent to the sea, normally clear the sea ice away from the coast but the wind direction for much of December was from the northeast. This pushed the ice towards the coast in the East Antarctic, where ice flows stacked together to create an impenetrable ice mass.
Working in the polar regions is unpredictable with even the best laid plans at the mercy of the weather. It is essential to our understanding of climate change and its impacts that research is undertaken in this remote and wild region. Hopefully the stranded scientists have gained some valuable data and insights from this experience. 

Monday, November 12, 2012

Winds Drive Growth in Antarctic Sea Ice

Winds Drive Growth in Antarctic Sea Ice

WSJ.COM 11/12/12

Northward winds are driving the record growth of winter sea ice around Antarctica, which stands in contrast to the extensive melting of the Arctic sea ice in recent years, scientists reported Sunday.
Their new research, based on 19 years of daily ice-motion measurements recorded by four satellites of the U.S. Defense Meteorological Satellite Program, highlights how geography, weather and climate patterns are affecting the planet's polar regions in different ways.
Their analysis documented for the first time that long-term changes in the drift of annual sea ice around Antarctica were strongly affected by winds. The area of ocean covered by sea ice grew markedly in regions where the prevailing winds spread out the loosely compacted ice floes, they reported. It shrank in areas where the wind blew the floating ice up against the shore.
The researchers at NASA's Jet Propulsion Laboratory in California and the British Antarctic Survey reported their work Sunday in Nature Geoscience.
"We have evidence now that the wind is driving the ice cover," said JPL senior research scientist Ron Kwok, who led the study. "The expansion and contraction of ice around the continent is largely explained by wind forces, which is very different in the Antarctic than in the Arctic."
Broadly speaking, the Earth's polar regions are mirror opposites.
The Arctic Ocean is largely landlocked, surrounded by North America, Greenland and Eurasia, which limits the amount of sea ice there could be no matter which way the wind is blowing. Earlier this year, scientists reported that the extent of summer sea ice in the Arctic was the lowest since 1979, when satellite monitoring there began.
By contrast, Antarctica—the world's coldest and windiest continent—is covered by an ice cap two miles thick and surrounded by the Southern Ocean. The annual growth of sea ice around Antarctica is the largest seasonal event on the planet.
With the onset of the Southern Hemisphere winter in March, the ice expands at 22 square miles a minute. In 1992, the direction of the drifting sea ice changed, with the spread of the ice doubling in some regions, the satellite measurements showed. Earlier this year, Antarctica's sea ice reached a record expanse of 7.49 million square miles, before the spring thaw began.
In a separate study made public last month, climate scientists at NASA's Goddard Space Flight Center in Maryland reported that winter sea ice surrounding Antarctica has been increasing by about 6,600 square miles every year—an area larger than Connecticut—during the same decades that the Arctic summer sea ice has been shrinking.
The researchers didn't identify what was driving wind patterns around Antarctica. Generally, the annual ozone hole over Antarctica has strongly affected wind circulation throughout the Southern Hemisphere, studies have shown. Wind patterns around Antarctica also are linked to larger climate cycles such as El Niño.
"The larger connection to global climate change and warming is more difficult to say," Dr. Kwok said. "We don't understand that yet."

Tuesday, May 1, 2012

New paper confirms wind controls Arctic sea ice extent

A paper published today in Geophysical Research Letters finds that Arctic sea ice extent is controlled by low-level winds which regulate the flow of ice through the Fram Strait. The findings confirm those of other recent papers showing that Arctic sea ice extent is a significant function of wind and currents, not just temperature.


GEOPHYSICAL RESEARCH LETTERS, VOL. 39, L09704, 6 PP., 2012
doi:10.1029/2012GL051330
Key Points
  • Arctic sea ice in 2010 and 2011 was controlled by summer surface wind forcing
  • Summer atmospheric conditions determine the amount of summer Arctic sea ice
  • Anticyclonic wind anomalies play an important role in the retreat of sea ice
Masayo Ogi
Japan Agency for Marine-Earth Science and Technology, Yokohama, Japan
John M. Wallace
Department of Atmospheric Sciences, University of Washington, Seattle, Washington, USA
Strong summertime anticyclonic wind anomalies over the Arctic Ocean, with anomalous flow toward the Fram Strait, during summer months of 2007 contributed to the record-low the Arctic sea-ice extent observed in September of that year. Had the summer winds over the Arctic during the summers of 2010 and 2011 been the same as those in 2007, September sea ice extent would have reached new record lows in those years as well. By regulating the flow of ice toward and through the Fram Strait, variations in low-level winds over the Arctic have contributed to the month-to-month, year-to-year, and decade-to-decade variability of sea ice extent.

Wednesday, September 1, 2010

Arctic Sea Ice changes mainly due to Geography & not accelerating

A letter to the editor of the Milwaukee Journal Sentinel supporting an AGW-skeptical politician was signed by 8 prominent scientists including Harvard astrophysicist Willie Soon, and mentions a recent paper published in Geophysical Research Letters:
"For example, a paper published Aug. 19 in Geophysical Research Letters by a scientist from the California Institute of Technology shows that even the apparently drastic decrease of summer-autumn Arctic sea ice is not unprecedented but merely an effect of Arctic Ocean geography."
The paper, Geographic muting of changes in the Arctic sea ice cover, undermines the notion that AGW is a primary cause of decrease of Arctic sea ice in summer-autumn by showing that the actual mechanism is related to Arctic geography, which restricts the buildup of winter sea ice and thus shifts the semi-sinusoidal pattern of summer-autumn ice melt northward at a constant (not accelerating) rate of 8km/yr since the beginning of the satellite era in 1979. This explains why September Arctic sea ice extent has declined much more rapidly (1.1%/yr) than March sea ice extent (.26%/yr) since 1979.
March Arctic Sea Ice extent decreasing only 0.26%/yr
Over the past 3 years the summer-autumn Arctic sea ice extent has increased from the low in 2007:
The paper provides further evidence that changes in Arctic sea ice are part of natural patterns dependent upon Arctic winds, geography, solar variability, Milankovitch cycles, ocean oscillations, etc. rather than AGW. A prior post has also demonstrated that it is impossible for 'greenhouse warming' to melt the icecaps from below.

References:
Explanation of the paper (translated from Icelandic)
A paper by the same author finds we are nowhere near a "tipping point" regarding Arctic Sea Ice
Even Tamino thinks the paper is correct

Saturday, October 4, 2014

Observations contradict claim 2007 Arctic sea ice extent was due to greenhouse gases

A new paper published in Earth Interactions finds that satellite observations show the low Arctic sea ice extent of 2007 was associated with a large increase in solar surface radiation and a decrease in infrared radiation from greenhouse gases from 2006 and 2007. Thus, the observations contradict AGW alarmist claims that the 2007 low Arctic sea ice extent was related to man-made greenhouse gases, and instead suggests natural factors such as solar surface radiation [modulated by clouds] were responsible.


Since the 2007 low, Arctic sea ice has greatly recovered to the second highest extent in a decade, and the highest in nine years, again indicating natural variability, not CO2, is the control knob of Arctic sea ice. At the unmentionable South Pole, Antarctic sea ice extents have blown through the highest recorded levels ever for each of the past 5 years, again indicating natural variability, not CO2, is the control knob of polar sea ice.


The authors also find major problems in the "reanalysis" data of downwelling summertime shortwave [solar] radiation and downwelling summertime longwave radiation [IR from greenhouse gases] in comparison to the actual satellite observations, finding,

"large spreads, particularly for downwelling shortwave radiation. In many cases, the differences in significant trends between the 5 reanalysis products are comparable to the estimated trend within a particular product. These discrepancies make it difficult to establish a consensus on likely changes occurring in the Arctic solely based on results from reanalyses fields." 
and that comparing "observations against these reanalysis products present an ambiguity.
Thus, agreement within reanalysis fields needs to be further checked against observations to assess possible biases common to all [reanalysis] products."
In other words, believe the direct satellite observations, but not the data reanalysis "products." And the direct satellite observations show the opposite of what AGW alarmists claim is responsible for Arctic sea ice changes [which is a decrease, not increase of downwelling IR associated with the 2007 low].


An Evaluation of Surface Atmospheric Changes over the Arctic Ocean for 2000-09 Using Recent Reanalyses

Ayan H. Chaudhuri
Atmospheric and Environmental Research Inc, 131 Hartwell Ave, Lexington MA 02421. Email:; Phone: 781-761-2382
Rui M. Ponte
Atmospheric and Environmental Research Inc, 131 Hartwell Ave, Lexington MA 02421. Email: ; Phone: 781-761-2231
Abstract
We examine 5 recent reanalysis products (CFSR, MERRA, JRA-25, ERA-Interim and ASR) for (1) trends in near-surface radiation fluxes, air temperature and humidity, which are important indicators of changes within the Arctic Ocean and also influence sea-ice and ocean conditions, and (2) fidelity of these atmospheric fields and effects for an extreme event, namely the 2007 ice retreat. An analysis of trends over the Arctic for the past decade (2000-2009) shows that reanalysis solutions have large spreads, particularly for downwelling shortwave radiation. In many cases, the differences in significant trends between the 5 reanalysis products are comparable to the estimated trend within a particular product. These discrepancies make it difficult to establish a consensus on likely changes occurring in the Arctic solely based on results from reanalyses fields. Regarding the 2007 ice retreat event, comparisons with remotely-sensed estimates of downwelling radiation observations against these reanalysis products present an ambiguity. Remotely-sensed observations from a study cited herewith suggest a large increase in downwelling summertime shortwave [solar] radiation and decrease in downwelling summertime longwave [greenhouse gas] radiation from 2006 and 2007. On the contrary, the reanalysis products show only small gains in summertime shortwave radiation, if any, however all the products show increases in downwelling longwave radiation. Thus, agreement within reanalysis fields needs to be further checked against observations to assess possible biases common to all [reanalysis] products.

Saturday, March 1, 2014

New paper finds lows of Arctic sea ice in 2007 and 2012 were due to storms

A new paper published in The Cryosphere finds that the 2 recent lows in Arctic sea ice over the past decade during 2007 and 2012 were strongly related to storm activity, rather than a long-term effect of climate change. According to the authors, "Strong summer storms on the Siberian side of the Arctic Ocean may have been important contributions to the recent [Arctic sea ice minimums] in 2007 and 2012." Arctic sea ice strongly rebounded in 2013 by up to 78% in comparison to 2012, suggesting the 2007 and 2012 lows were just natural variation. 

The paper adds to many other peer-reviewed publications finding Arctic sea ice extent is due to natural variability from winds and storms, not AGW.

The Arctic sea ice minimums in 2007 [purple] and 2012 [orange] were strongly related to storm activity, not AGW.

The Cryosphere, 8, 303-317, 2014
www.the-cryosphere.net/8/303/2014/
doi:10.5194/tc-8-303-2014


A. Kriegsmann1,* and B. Brümmer1
1Meteorological Institute, University of Hamburg, Hamburg, Germany
*now at: Climate Service Center, Hamburg, Germany

Abstract. This study investigates the impact of cyclones on the Arctic Ocean sea ice for the first time in a statistical manner. We apply the coupled ice–ocean model NAOSIM which is forced by the ECMWF analyses for the period 2006–2008. Cyclone position and radius detected in the ECMWF data are used to extract fields of wind, ice drift, and concentration from the ice–ocean model. Composite fields around the cyclone centre are calculated for different cyclone intensities, the four seasons, and different sub-regions of the Arctic Ocean. In total about 3500 cyclone events are analyzed. In general, cyclones reduce the ice concentration in the order of a few percent increasing towards the cyclone centre. This is confirmed by independent AMSR-E satellite data. The reduction increases with cyclone intensity and is most pronounced in summer and on the Siberian side of the Arctic Ocean. For the Arctic ice cover the cumulative impact of cyclones has climatologic consequences. In winter, the cyclone-induced openings refreeze so that the ice mass is increased. In summer, the openings remain open and the ice melt is accelerated via the positive albedo feedback. Strong summer storms on the Siberian side of the Arctic Ocean may have been important contributions to the recent ice extent minima in 2007 and 2012.

Saturday, April 27, 2013

New paper finds IPCC models predicted decrease in Antarctic sea ice, which is currently near record highs

A paper published today in the Journal of Geophysical Research - Atmospheres finds "most climate models from the [IPCC] archive simulate a decrease in Antarctic sea ice area over the recent past," however, "average Antarctic sea ice area is not retreating but has slowly increased since satellite measurements began in 1979." Further, the authors find the latest generation of IPCC climate models "have not improved" over the prior generation, and "show an unrealistic spread in the mean state that may influence future sea ice behavior."

The paper, co-authored by Climategate co-conspirator Susan Soloman, attempts to save face for the models, claiming the increase in Antarctic sea ice is still within natural variability. With Antarctic sea ice currently near 'unprecedented' high levels, how long can this IPCC model flimflam persist?


Historical Antarctic mean sea ice area, sea ice trends, and winds in CMIP5 simulations

Irina Mahlstein 1,2,3,*, Peter R. Gent 4, Susan Solomon 5

Abstract

In contrast to Arctic sea ice, average Antarctic sea ice area is not retreating but has slowly increased since satellite measurements began in 1979. While most climate models from the CMIP5 archive simulate a decrease in Antarctic sea ice area over the recent past, whether these models can be dismissed as being wrong depends on more than just the sign of change compared to observations. We show that internal sea ice variability is large in the Antarctic region, and both the observed and modeled trends may represent natural variations along with external forcing. While several models show a negative trend, only a few of them actually show a trend that is significant compared to their internal variability on the timescales of available observational data. Further, the ability of the models to simulate the mean state of sea ice is also important. There presentations of Antarctic sea ice in CMIP5 models have not improved compared to CMIP3, and show an unrealistic spread in the mean state that may influence future sea ice behavior. Finally, Antarctic climate and sea ice area will be affected not only by ocean and air temperature changes but also by changes in the winds. The majority of the CMIP5 models simulate a shift that is too weak compared to observations. Thus, this study identifies several foci for consideration in evaluating and improving the modeling of climate and climate change in the Antarctic region.

Saturday, June 22, 2013

New paper finds another natural mechanism controlling Arctic sea ice extent

A new paper published in the International Journal of Climatology finds 40-79% of the variation in western Arctic sea ice extent is due to natural atmospheric circulation patterns such as the Arctic Dipole (AD), Arctic Oscillation (AO), and Pacific-North American (PNA) pattern. Prior research has shown Arctic sea ice extent is also controlled by natural variation of winds and storm activity, and related to the geography of the Arctic, not alleged anthropogenic global warming. 

Associations between circulation pattern frequencies and sea ice minima in the western Arctic

Thomas J. Ballinger, Scott C. Sheridan

ABSTRACT: In this study, a synoptic climatological approach is employed to assess the relationship between the frequency of circulation patterns (CPs) and the latitude of mid-September sea ice minima in the western Arctic. Fifteen CPs are created via principal component analysis and cluster analysis from daily NCEP/NCAR reanalysis sea-level pressure (SLP) fields across a grid from 50 to 90°N and 150°E–100°W from 1979 to 2011. The frequency of these CPs are statistically compared with the latitude of the sea ice minimum from passive microwave data for each of 11 equally-spaced longitudes (176°W to 126°W) extending into the Chukchi and Beaufort Seas. Monthly frequencies for each of the 15 CPs from March to September, signifying the melt season, for each year are correlated with the ice minimum for that September. These monthly frequencies are then entered into a stepwise multiple linear regression (SMLR) and collectively, CP [
circulation pattern] frequencies explain 40–79% of the total ice retreat variance across the longitudes. The frequency of one cluster, CP 11, representing a broad high pressure area over the Beaufort Sea, is highly correlated with the latitude of the sea ice minima; June and August frequencies of this pattern are the initial predictors at 8 of the 11 longitudes and explain 22–32% of the variance. This pattern has occurred more frequently from 2007 onwards; compared with a June mean occurrence of 9 days during 1979–2006, CP 11 occurred 16 times in June 2007, and on average more than 17 days per month during June 2008–2011. The Arctic Dipole (AD), Arctic Oscillation (AO), and Pacific-North American (PNA) pattern indices are significantly correlated with CPs 11–13 frequencies throughout certain summer months, further indicating strong relationships between summer circulation and sea ice minima in the region.

Wednesday, October 30, 2013

New paper finds natural variability responsible for abrupt Arctic climate change

Natural variability may have driven Arctic climate change

30.10.2013 19:10  ReportingClimateScience.com


TOP: Map of the Eurasian Arctic (Inset: Severnaya Zemlya (SZ) with the drilling point at Akademii Nauk (AN) ice cap) including schematic positions of Icelandic Low and Siberian High as well as the major air-mass transport pathway (dashed arrow) for SZ. Courtesy: Opel et al. BOTTOM: AN isotope record (including linear trends for 900–1760 and 1800–1998) compared to (from top to bottom) ice cores from Austfonna, Lomonosovfonna and the Vetreniy ice-cap, as well as Arctic summer surface atmosphere temperature (SAT) anomalies, Arctic annual SAT anomalies, AN sodium concentrations, and Arctic sea-ice extent records. Abrupt warming and cooling events exceeding the dominant variability of the AN record are marked by a red asterisk. Note the different scale for the Lomonosovfonna record. Courtesy: Opel et al. Click to enlarge

Strong evidence from ice core oxygen isotope analysis suggests that significant climate change in the Arctic over the last 1,000 years has been due to internal [natural] variability. This may have implications for the suggested causal link between human driven global warming and recent changes in the Arctic, indicating that a far more complex set of relationships are at work; and that significant regional climate change is a feature of the Arctic. 

The paper, Eurasian Arctic Climate Over The Past Millennium As Recorded In The Akademii Nauk Ice Core (Severnaya Zemlya), by Thomas Opel, Hanno Meyer and Diedrich Fritzsche from the Alfred Wegener Institute of the University of Bremen was published this month (October 2013) in the open access journal Climate Of The Past.
The authors examined an ice core from the Russian high Arctic in Severnaya Zemlya. They analysed the levels of the δ18 O isotope of oxygen found at various depth in the ice core. Oxygen isotope analysis of ice core samples can be used as a proxy for temperature, since the mix of isotopes in precipitation depends on the temperature at the time. In general, the further along the length of the ice core that a sample is found then the older it is. So this analysis enables a historic record of surface air temperatures at the ice core site to be estimated.
The authors detected evidence of higher temperatures around 900AD and in the 13th century than were found during the 17th century but they found no evidence of "distinct longer-lasting climate epochs" such as the Medieval Climate Anomaly and the Little Ice Age which have been recorded at lower latitudes.
Instead, the authors report that the oxygen isotope record exhibits "several abrupt cooling and warming events" in the 15th, 16th, 18th and 20th centuries. They suggest that these abrupt changes and the resulting cooling and warming periods may be due to internal climate variability relating to changes in prevailing winds and air-mass transport caused by shifts in atmospheric circulation and also to changes in sea-ice feedbacks in the Barents Sea and Kara Sea.
This also suggests that the Arctic area is subject to significant regional climatic variations which do not necessarily follow the pattern of climate changes at lower latitudes.
The implications of these results is that they suggest that the causes of recent changes in the Arctic may be far more complicated than has previously been believed and that a simplistic attribution to human driven climate change might suggest. 

The conclusion to the paper reads:
The results presented in this paper highlight the potential of the AN (Akademii Nauk) ice core as a high-resolution climate archive for the Late Holocene, i.e. about the last three millennia. Beside a long-term decrease due to climate cooling and ice-cap growth the AN δ18 O record shows evidence of major temperature changes over the last millennium that are representative at least of the western Eurasian Arctic, i.e. the Barents and Kara seas region. Of particular importance are several abrupt cooling and warming events leading e.g. to the absolute SAT (surface air temperature) minimum around 1800 and the absolute SAT maximum in the early 20th century, accompanied by significant changes in sodium concentrations. The ETCW (early twentieth century warming) exhibits a specific double-peaked shape typical of the Barents and Kara seas region. Abrupt changes in the last centuries might be caused by internal [natural] climate dynamics related to shifts of atmospheric circulation patterns and corresponding sea-ice feedbacks

The abstract reads:
Understanding recent Arctic climate change requires detailed information on past changes, in particular on a regional scale. The extension of the depth–age relation of the Akademii Nauk (AN) ice core from Severnaya Zemlya (SZ) to the last 1100 yr provides new perspectives on past climate fluctuations in the Barents and Kara seas region. Here, we present the easternmost high-resolution ice-core climate proxy records (δ18O and sodium) from the Arctic. Multi-annual AN δ18O data as near-surface air-temperature proxies reveal major temperature changes over the last millennium, including the absolute minimum around 1800 and the unprecedented warming to a double-peak maximum in the early 20th century. The long-term cooling trend in δ18O is related to a decline in summer insolation but also to the growth of the AN ice cap as indicated by decreasing sodium concentrations. Neither a pronounced Medieval Climate Anomaly nor a Little Ice Age are detectable in the AN δ18O record. In contrast, there is evidence of several abrupt warming and cooling events, such as in the 15th and 16th centuries, partly accompanied by corresponding changes in sodium concentrations. These abrupt changes are assumed to be related to sea-ice cover variability in the Barents and Kara seas region, which might be caused by shifts in atmospheric circulation patterns. Our results indicate a significant impact of internal climate variability on Arctic climate change in the last millennium.

Eurasian Arctic Climate Over The Past Millennium As Recorded In The Akademii Nauk Ice Core (Severnaya Zemlya)
by T.Opel, D. Fritzsche and H. Meyer
doi: 10.5194/cp-2379-2013 Clim.Past. 9-2379-2389, 2013
Read the paper here.

Wednesday, July 17, 2013

Paper finds Arctic climate & sea ice extent related to solar activity

A paper published by the Danish Meteorological Institute finds a remarkable correlation of Arctic sea ice observations over the past 500 years to "the solar cycle length, which is a measure of solar activity. A close correlation (R=0.67) of high significance (0.5 % probability of a chance occurrence) is found between the two patterns, suggesting a link from solar activity to the Arctic Ocean climate." The paper adds to several others demonstrating that Arctic sea ice extent and climate is controlled by natural variations in solar activity, ocean & atmospheric oscillations, winds & storm activity, not man-made CO2.


Solar Cycle Length [SCL] shown by dotted line, Koch sea ice extent index from observations in the Greenland Sea shown by solid line.
Multi-decadal variation of the East Greenland Sea-Ice Extent: AD 1500-2000

Knud Lassen and Peter Thejll

Abstract: The extent of ice in the North Atlantic varies in time with time scales stretching to centennial, and the cause of these variations is discussed. We consider the Koch ice index which describes the amount of ice sighted from Iceland, in the period 1150 to 1983 AD. This measure of ice extent is a non-linear and curtailed measure of the amount of ice in the Greenland Sea, but gives an overall view of the amounts of ice there through more than 800 years. The length of the series allows insight into the natural variability of ice extent and this understanding can be used to evaluate modern-day variations. Thus we find that the recently reported retreat of the ice in the Greenland Sea  may be related to the termination of the so-called Little Ice Age in the early twentieth century. We also look at the approximately 80 year variability of the Koch [sea ice] index and compare it to the similar periodicity found in the solar cycle length, which is a measure of solar activity. A close correlation (R=0.67) of high significance (0.5 % probability of a chance occurrence) is found between the two patterns, suggesting a link from solar activity to the Arctic Ocean climate.

Tuesday, February 24, 2015

Why media hype on AGW shifting the jet stream is "premature"

Science

Vol. 347 no. 6224 pp. 818-821 

DOI: 10.1126/science.347.6224.818
  • Feature

Arctic impact

Weather experts were on high alert in December 2009. A region of high pressure had settled over Greenland, forming a roadblock in the path of the circumpolar jet stream. Thwarted, the jet stream meandered, bending southward into a large loop and shunting cold Arctic air toward the center of the United States. Meteorologists were familiar with this “Greenland block.” It was a climate pattern historically favorable for winter storms—and as if on cue, record snowfalls blanketed the eastern United States over the next few months.
Against the backdrop of “Snowmageddon” and other powerful winter storms that have blasted the United States, Europe, and Asia in the past few years, a different kind of tempest has been swirling within the Arctic science community. Its core is a flurry of recent research proposing that such extreme weather events in the midlatitudes are linked through the atmosphere with the effects of rapid climate change in the Arctic, such as dwindling sea ice. The idea has galvanized the public and even caught the attention of the White House. But some Arctic researchers say the data don't support it or that the jury is at least still out. Even some of its proponents agree that the media hype is premature.
Now, scientists are starting to tackle the issue in earnest. Atmospheric links between the poles and midlatitudes are becoming a marquee topic at Arctic-related conferences. Last December alone it drew researchers to a workshop in Barcelona, Spain, and a dedicated session at the annual American Geophysical Union meeting in San Francisco, California. “A lot of scientists have worked individually, in isolation, pursuing their own ideas,” says Judah Cohen, a climate scientist at the Massachusetts Institute of Technology in Cambridge—one of several researchers who hope that a coordinated effort will measure the reach of the north.
THE IDEA THAT THE ARCTIC could have a regional, even hemisphere-scale impact on the atmosphere represents a paradigm shift for climate scientists. “When I was in grad school, [the thinking was that] the tropics are everything,” Cohen says. “The tropics, the ocean—that was it, there was no other player.”
The Arctic Ocean, after all, is small and cold; the tropical Pacific Ocean is vast and, of course, warmer. To influence the atmosphere on a global scale, very large amounts of heat and moisture must flow from ocean to air. That heat engine is huge in the Pacific and powers the El Niño–Southern Oscillation (ENSO), the planet's dominant interannual climate pattern. ENSO also has a helpful supply chain: Even as heat escapes from the eastern tropical Pacific to the atmosphere, currents flowing in from the western tropical Pacific provide a fresh supply.
But there is a new kind of engine forming in the Arctic. The rapid loss of sea ice in the Arctic Ocean due to global warming—the area of summer ice has shrunk more than 11% per decade since 1979—has created an expanse of dark open water newly available to absorb the sun's energy. This extra energy input and the corresponding flux of moisture and heat to the Arctic atmosphere are helping drive a strong local positive feedback to global warming, called Arctic amplification. As a result, surface temperatures are rising twice as fast in the Arctic as at lower latitudes.
Heavy blizzards that paralyzed Central Europe in February 2012 may have been part of a larger pattern.
PHOTO: © BOGDAN CRISTEL/REUTERS/CORBIS
But is the loss of sea ice influencing more than just local warming? In 2012, climatologists Jennifer Francis of Rutgers University, New Brunswick, in New Jersey and Stephen Vavrus of the University of Wisconsin, Madison, proposed that Arctic amplification driven by sea ice loss could significantly affect midlatitude weather by slowing the jet stream (Science, 18 April 2014, p. 250). The mechanism they suggested was this: A faster warming Arctic means a reduced temperature gradient between the Arctic and midlatitudes, which in turn weakens west-to-east winds. The result is a slowdown of the jet stream, allowing it to meander more and form elongated waves (called Rossby or planetary waves) that jut to the north or south. Among other effects, Francis and Vavrus proposed, the deep waves in the jet stream could enable a winter storm to push farther south and then linger in one location, possibly dumping record amounts of snow.
A handful of newer studies support one key part of this hypothesis: that large-amplitude Rossby waves in the jet stream are indeed linked, statistically, to extreme weather in the midlatitudes. For example, Vladimir Petoukhov of the Potsdam Institute for Climate Impact Research in Germany and colleagues in 2013 correlated summer heat waves in Europe with instances of slow-moving, high-amplitude Rossby waves. And last year, James Screen, a climate modeler at the University of Exeter in the United Kingdom, and Ian Simmonds of the University of Melbourne in Australia co-authored a paper that reported a strong statistical correlation between amplified, slow Rossby waves and months from 1979 to 2012 with extreme weather events. More waviness, they found, made the western United States more susceptible to heat waves and the eastern United States to extreme cold.
But other parts of the hypothesis remain controversial—particularly the part of the chain that links these changes to Arctic amplification. Some evidence supports Francis and Vavrus's idea that a decreasing temperature gradient between the midlatitudes and the Arctic might slow the jet stream and make it wavier.
Yet climate dynamicist Elizabeth Barnes of Colorado State University, Fort Collins, reported in 2013 that she could find no uptick in the instances of Rossby waves in the last couple of decades, the period encompassing extreme sea ice loss and Arctic warming. And in a 2013 study, Screen and Simmonds found no statistically significant changes in these waves from 1979 to 2011, despite a declining north-south temperature gradient.
Some theorists have proposed another mechanism by which dwindling sea ice could shape midlatitude weather: by forcing changes in a multiyear atmospheric cycle called the Arctic Oscillation. In a positive Arctic Oscillation phase, the jet stream is strong and less wavy, and cold air stays in the Arctic. In a negative phase, the jet stream is weaker and wavier, and the cold air spills southward. Some analyses suggest that in the last few decades the Arctic Oscillation has increasingly been in a negative phase, which might drive not just storminess but also longer term cooling in the midlatitudes.
But evidence that the retreat of sea ice has influenced the Arctic Oscillation is scarce. “Since any Arctic effect [on the jet stream] is buried in large random climate [variations], and the record is short,” such a link is simply impossible to prove at the moment, says James Overland, an oceanographer at the National Oceanic and Atmospheric Administration's Pacific Marine Environmental Laboratory in Seattle, Washington.
FRANCIS ACKNOWLEDGES the lingering uncertainty about how the changes in the Arctic could drive bouts of extreme weather farther south. But, she says, as the mystery attracts more researchers, they are finding clues. Last year, climate scientist Masato Mori of the University of Tokyo and colleagues modeled how sea ice loss in the Barents and Kara seas north of Russia could increase blocking events—and the resulting severe winters—over Eurasia. And Baek-Min Kim of the Korea Polar Research Institute in Incheon and colleagues showed in a model how changes in sea ice loss in the Barents and Kara seas could set off a chain of events that produced a negative phase of the Arctic Oscillation.
Another paper published last year, this one by Kazutoshi Sato of the Japan Agency for Marine-Earth Science and Technology in Yokosuka and colleagues, suggests that ice loss in the Barents Sea and cold Eurasian winters are actually part of an even bigger climate pattern originating in the North Atlantic Gulf Stream. Recent observations show that the current is pushing warm water farther to the north. That shift, Sato and his colleagues found, may produce planetary waves that both warm the Barents Sea and cause a cold anomaly over Eurasia.
“That's a pretty robust linkage there,” Francis says. “It's not going to happen every single year, but it's pretty convincing that there are real physical mechanisms disrupting the jet stream.”
IT'S TOO EARLY TO TAKE SIDES about whether the Arctic influence is real, many researchers say. Last December's Barcelona workshop grappled with that “two camps” misconception, Screen says. “I don't like to frame it like that,” he says. “The majority [of people] are somewhere in the middle.” In fact, a few are in an entirely different camp: blaming changes in Eurasian snow cover, rather than the retreat of Arctic ice, for the midlatitude weather extremes (see sidebar, p. 821).
“We have records of sea ice only going back 30 years, with dramatic losses in the last decade or so,” Screen says. A statistical analysis of that brief period of observations, he says, is unlikely to settle the debate. Instead, scientists need to turn to other sources of knowledge, such as models and theory, “to better understand what we might be seeing in the observations.”
Overland, for his part, calls this the “preconsensus period.” He says meetings such as the workshop in Barcelona (which both he and Screen attended) have shown encouraging signs of progress. For one, researchers plagued by inconsistent definitions of terms such as waviness are finally getting a chance to straighten things out. And he felt that the Barcelona workshop did come to at least one consensus: that if there are links between Arctic amplification and midlatitude weather, they're amplifications of already existing and known climate patterns—Greenland blocking and a region of persistent high pressure called the Siberian high—so there's no need to build brand-new physics into the models.
SORTING OUT THOSE “known knowns” is exactly what researchers should be doing, Barnes says. “In my mind, we've put the cart before the horse a bit” by focusing on weather extremes, she says. “We're missing the theory, the dynamics, the mechanistic understanding.” She suggests that the community go back to basics to determine how Arctic warming could influence the jet stream dynamics. “It's certainly not sexy like telling you that we're going to have more extreme cold events—but in terms of the science, it's the way forward.”
One key to success, she says, is teasing out the effects of the Arctic on the jet stream from those of other atmospheric powerhouses, such as the chaotic atmospheric flow at midlatitudes and the ENSO pattern in the tropics. Indeed, researchers need to look beyond the potential impacts of Arctic change, Overland says, and aim for a better picture of atmospheric dynamics as a whole.
“We're just getting into that time where people get interested,” Barnes says. “If you look over the literature in the last 10 years, there's a lot of focus over how tropical warming will influence the jet stream, but not a lot on how Arctic warming will influence it. As a community our eyes were turned to the south, and now we're looking north. That, to me, is what's exciting.”