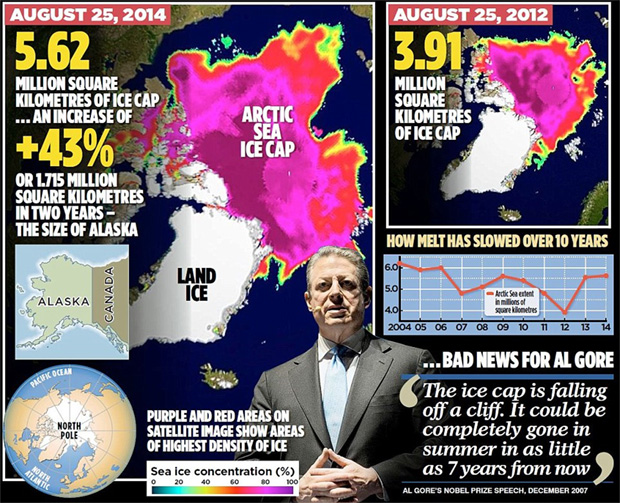
Compared to the Arctic sea ice minimum of 3.41 million square kilometers on September 16, 2012, sea ice extent was ~48% higher at 5.07 million km2 on September 15, 2014.
The NSIDC also confirms the Northwest Passage remains closed at the end of the melt season, despite Al Gore's claim "the entire North 'polarized' cap will disappear" by 2013.

Regardless, much of the intense fixation on Arctic sea ice extent is likely misplaced due to dominant influences of natural variation over AGW on Arctic sea ice extent.
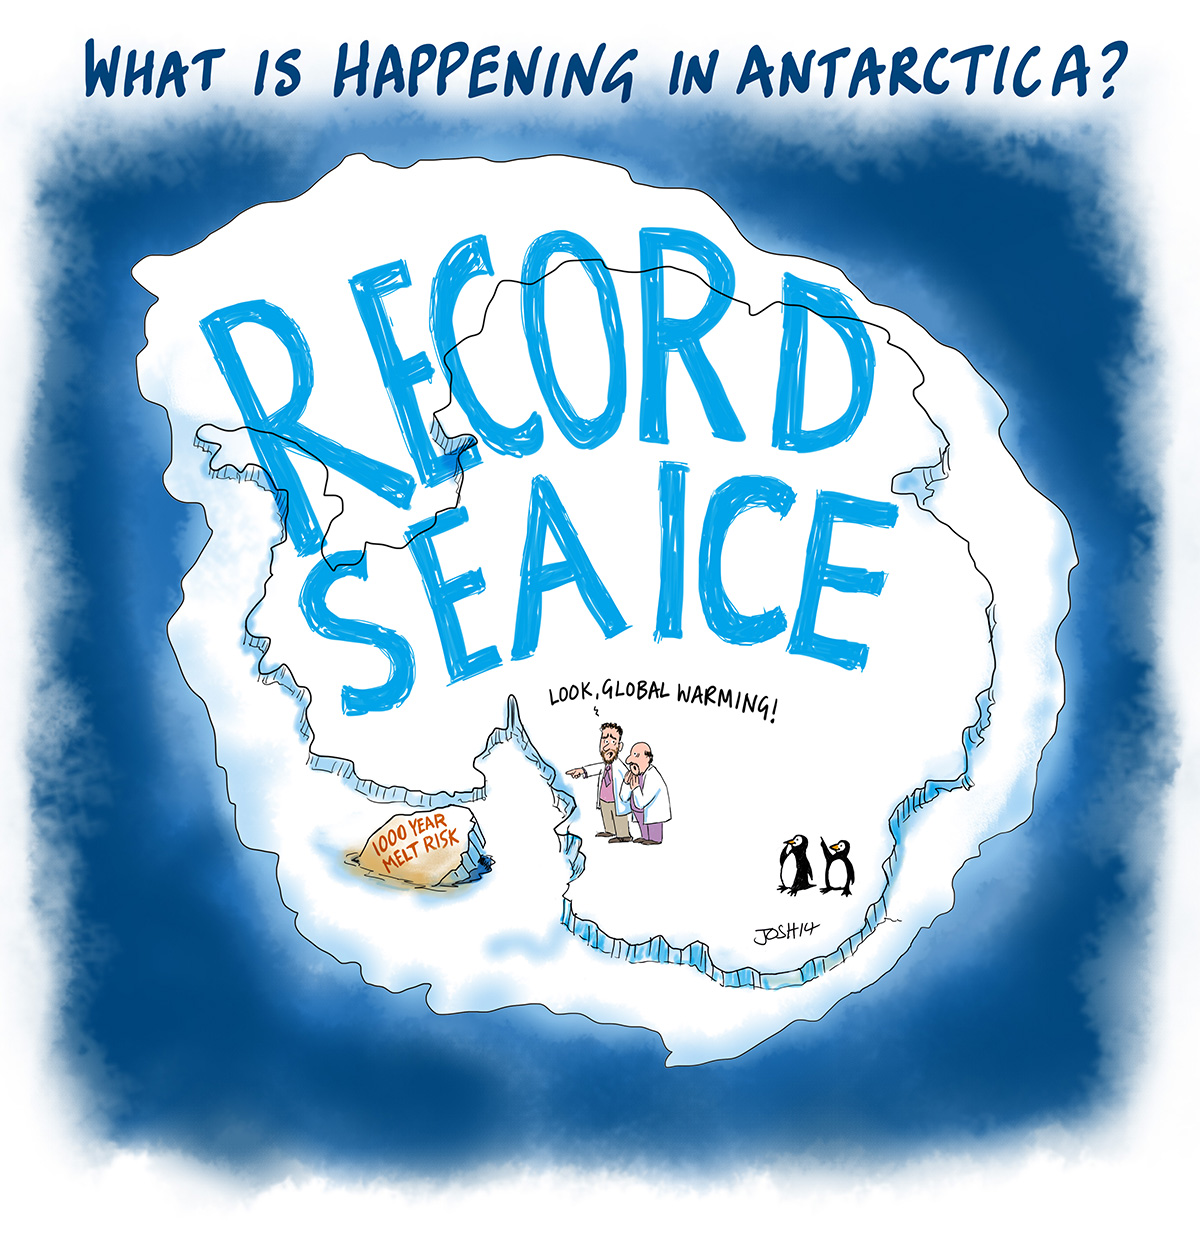
And then, there's also the unspeakable all-time record-high Antarctic sea ice extents blown through each of the past 5 years in a row.
Melt season ending
September 16, 2014 NSIDC
The end of this year’s Arctic sea ice melt season is imminent and the minimum extent will be slightly lower than last year’s, making it the sixth lowest extent in the satellite record. Earlier in the month, a small area of the Laptev Sea ice edge was within five degrees of the North Pole. This appears to be the result of persistent southerly winds from central Siberia. Meanwhile, Antarctic sea ice is poised to set a record maximum this year, now at 19.7 million square kilometers (7.6 million square miles) and continuing to increase.
Overview of Conditions
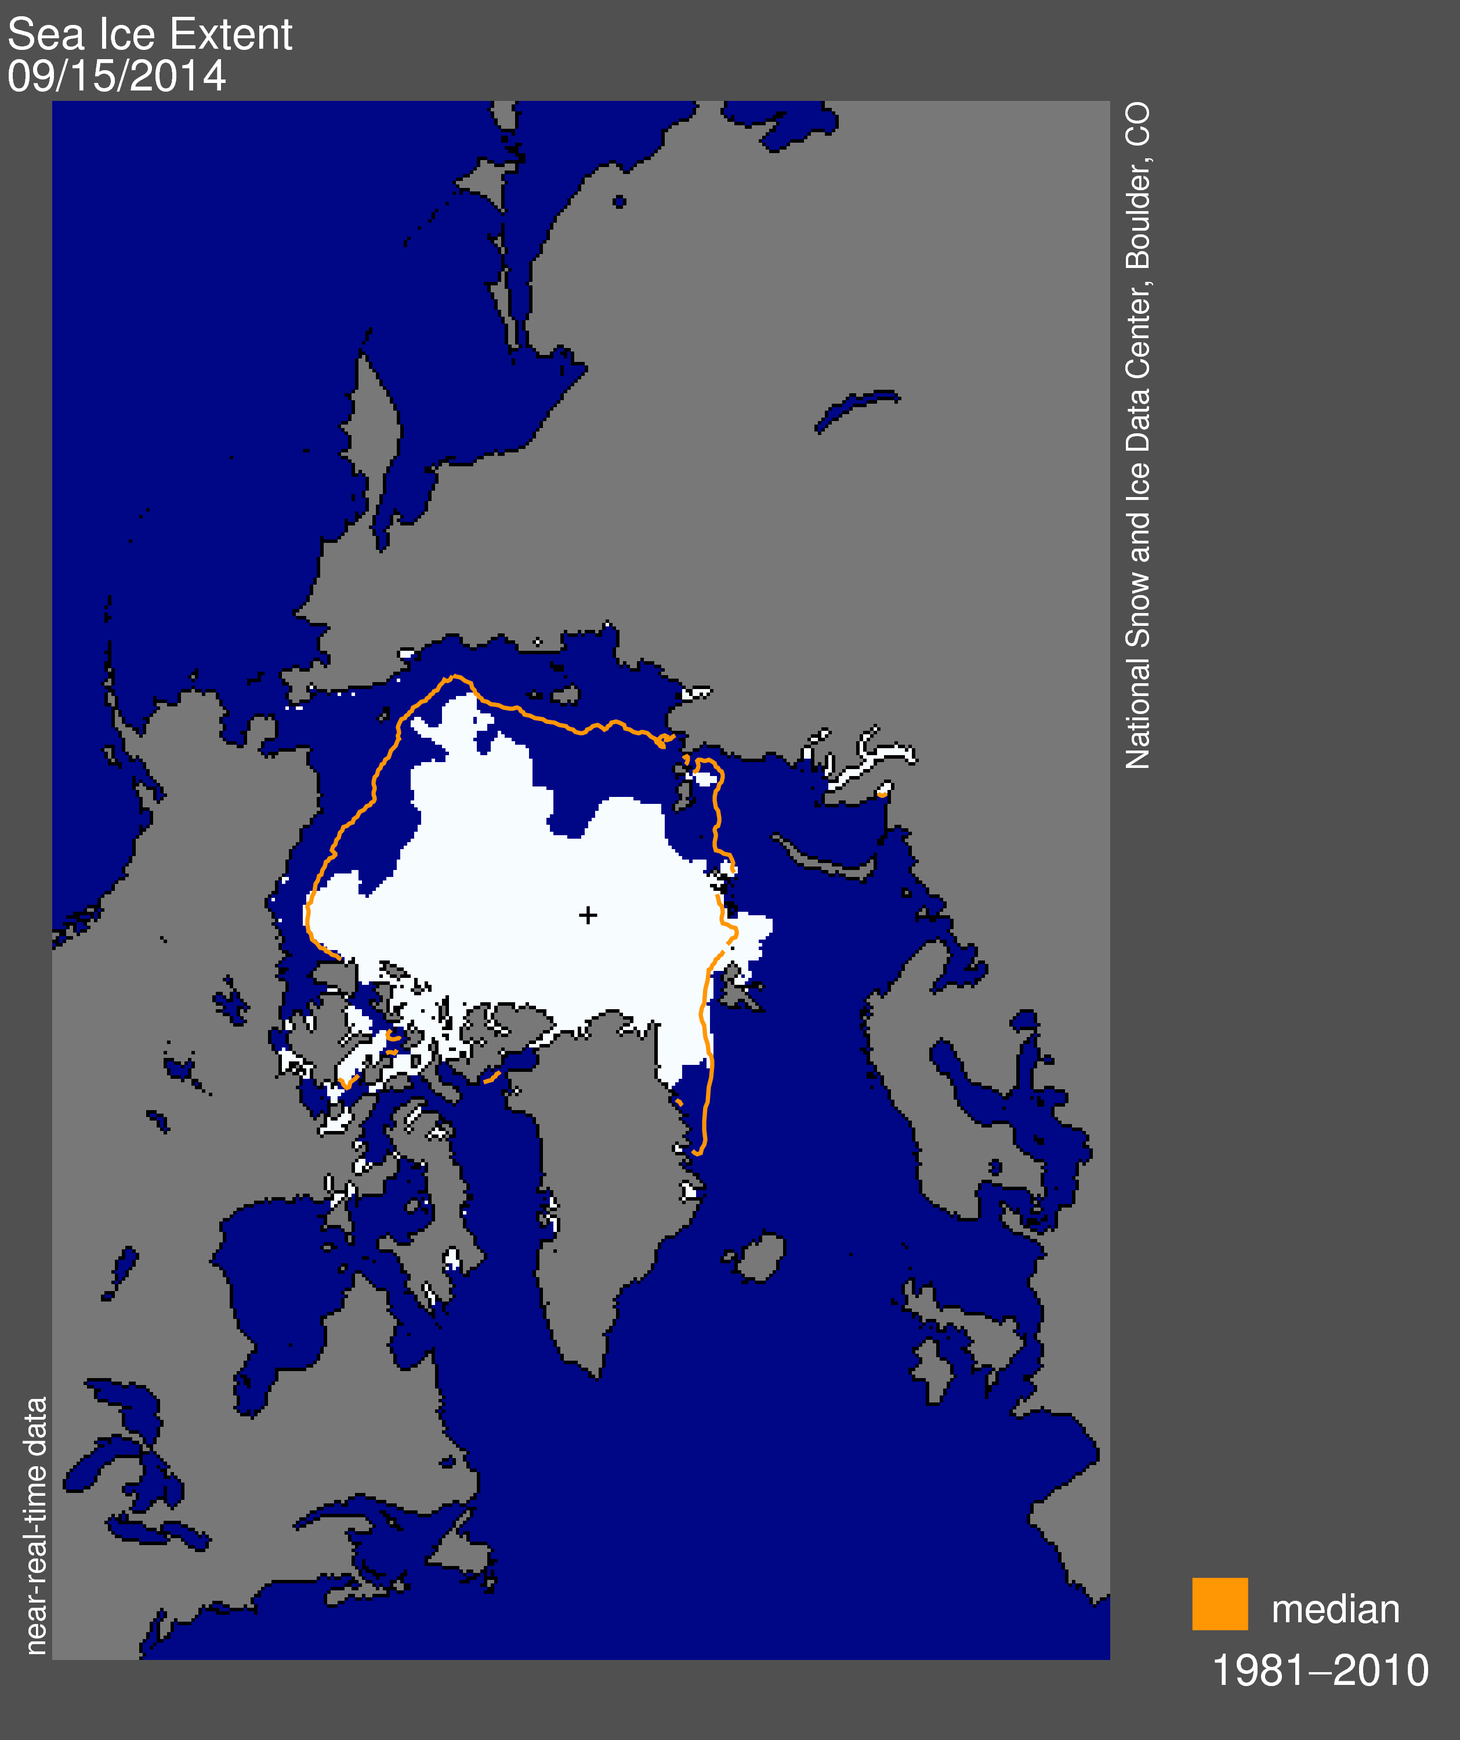
Figure 1. Arctic sea ice extent for September 15, 2014 was 5.07 million square kilometers (1.96 million square miles). The orange line shows the 1981 to 2010 average extent for that day. The black cross indicates the geographic North Pole. Sea Ice Index data. About the data Credit: National Snow and Ice Data Center High-resolution image
Arctic sea ice extent for September 15 was 5.07 million square kilometers (1.96 million square miles). This is only 30,000 square kilometers (11,600 square miles) below the same date last year, yet sea ice extent remains low compared to the long-term 1981 to 2010 average. As is typical for this time of year, weather conditions near the ice edge heavily influence the timing of the minimum, which has occurred as late as September 23. We are now a day past the 1981 to 2010 average minimum date of September 15.
Conditions in context
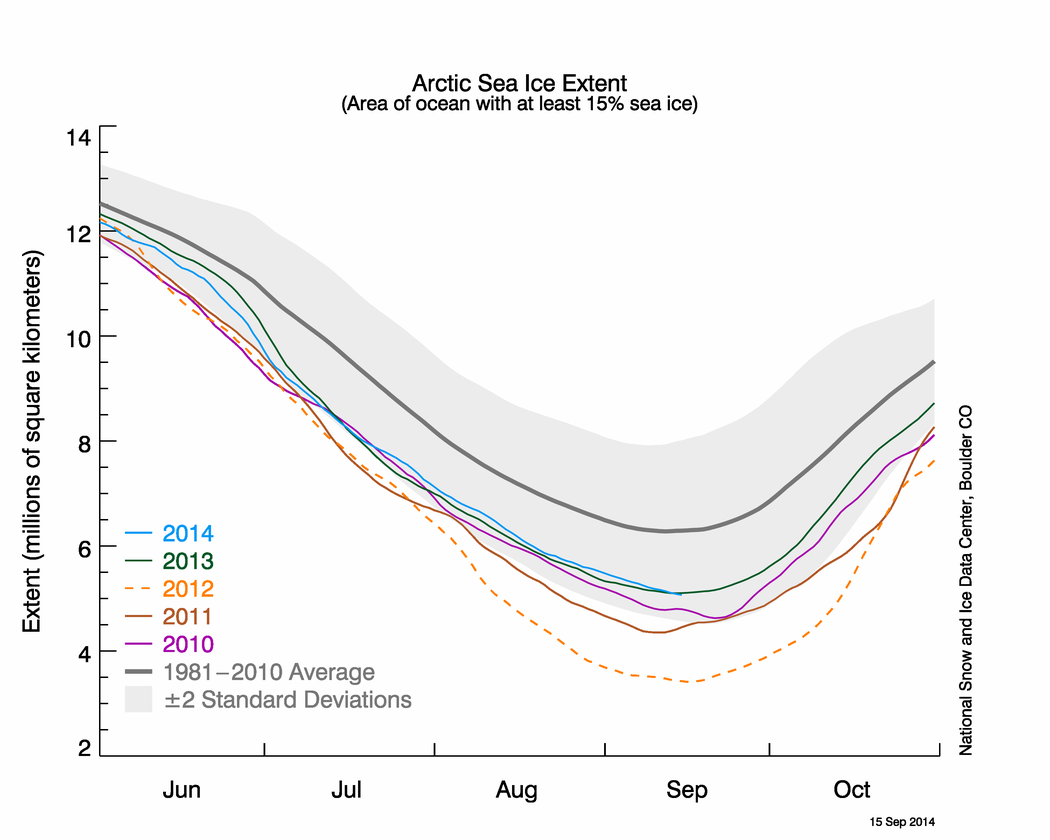
Figure 2. The graph above shows Arctic sea ice extent as of September 15, 2014, along with daily ice extent data for four previous years. 2014 is shown in blue, 2013 in green, 2012 in orange, 2011 in brown, and 2010 in purple. The 1981 to 2010 average is in dark gray. Sea Ice Index data. Credit: National Snow and Ice Data Center High-resolution image
Sea ice extent declined at a rate of 28,700 square kilometers (11,100 square miles) per day through the first half of September. This is nearly twice as high as the 1981 to 2010 average rate of decline for this period of 16,200 square kilometers (6,200 square miles) per day. As was the case for the beginning of the month, extent remains below average in all sectors of the Arctic except for a region in the Barents Sea, east of Svalbard. There are areas of fairly low concentration ice north of the East Siberian and Chukchi seas that may still melt out or compact from wind-driven drifting.
However, as in 2013, a large area in the East Siberian Sea remains ice covered, helping to keep the overall extent higher for this time of year than observed since 2007. Last summer that area was covered by first-year ice that did not melt out under cooler-than-average conditions. This year, a region of second-year ice appears to have helped stabilize ice loss there.
The Northwest Passage remains closed, while the Northern Sea Route is still largely clear of ice.
A new ice edge
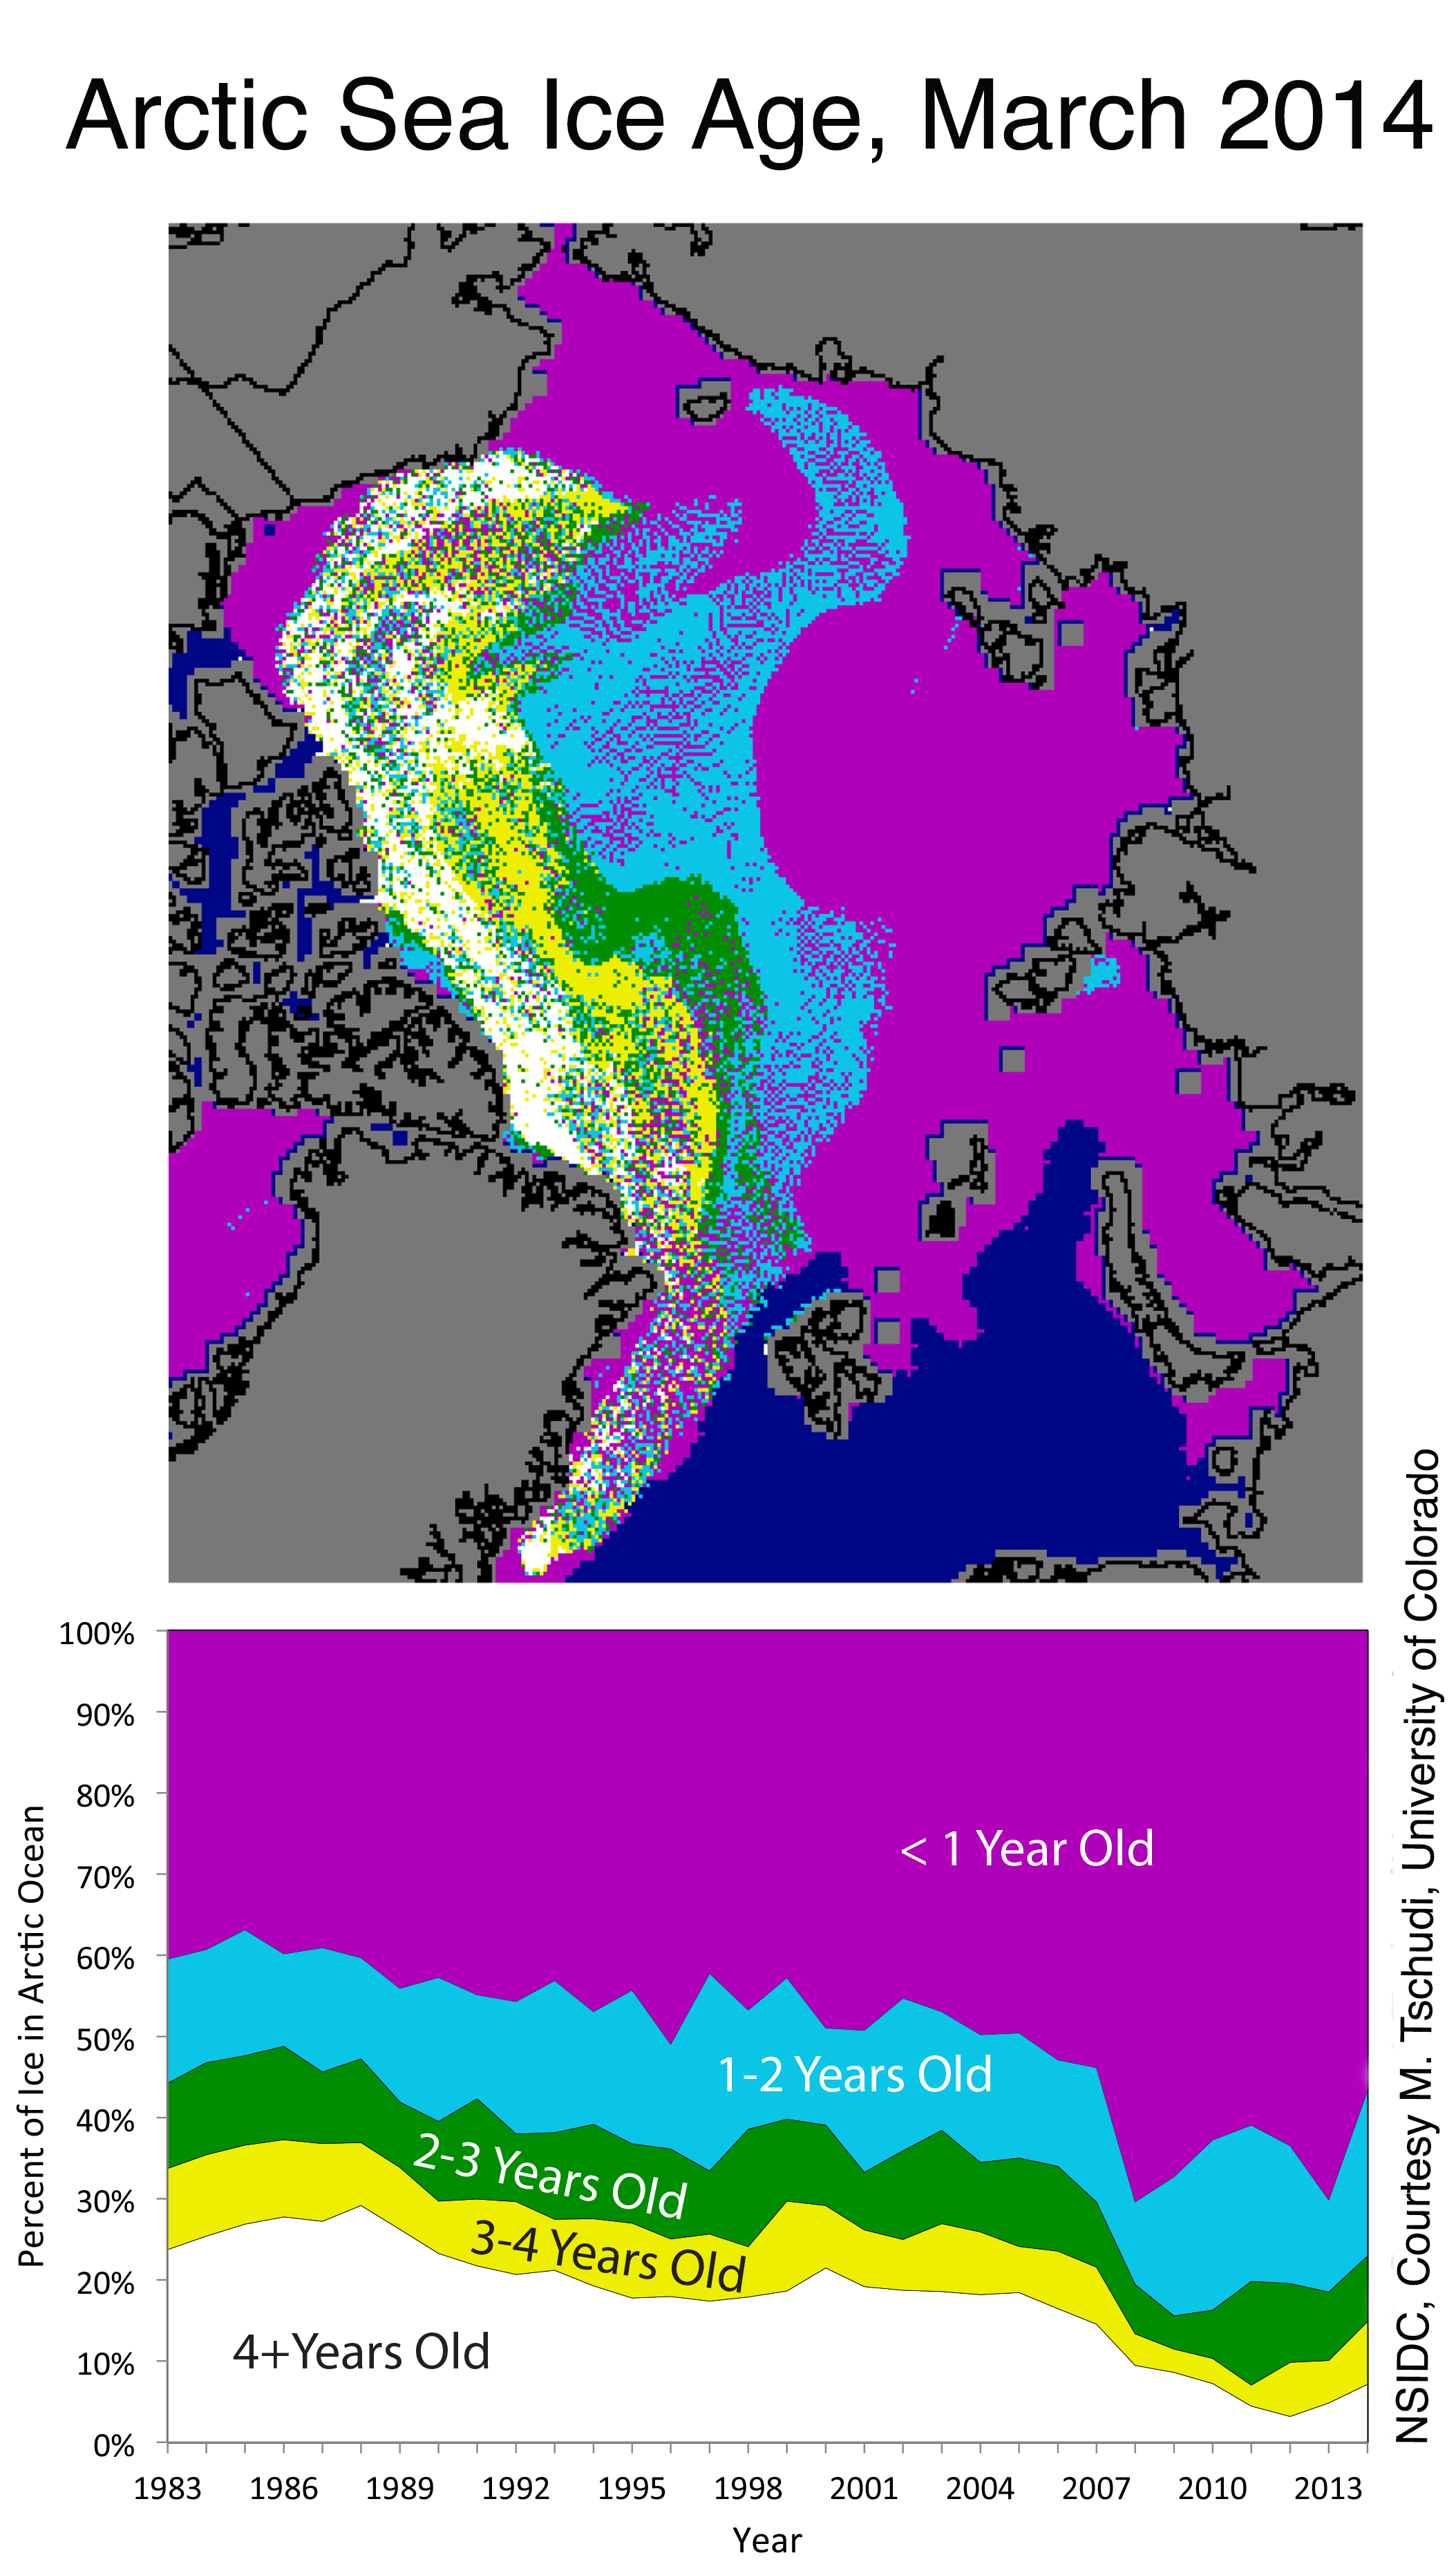
Figure 3a. The map at top shows the ages of ice in the Arctic at the beginning of March 2014; the bottom graph shows how the percentage of ice in each age group has changed from 1983 to 2014 . Credit: NSIDC, courtesy M. Tschudi, University of Colorado High-resolution image
Through the first half of September, the ice edge slowly retreated north of the Laptev Sea and is now within five degrees latitude of the North Pole. This is the most northerly position that the ice edge has been recorded over the period of satellite observations in this region. A large part of this region was also ice free in 2007. The reasons for the strong ice retreat in this sector are, at present, not entirely clear but we offer some initial insights.
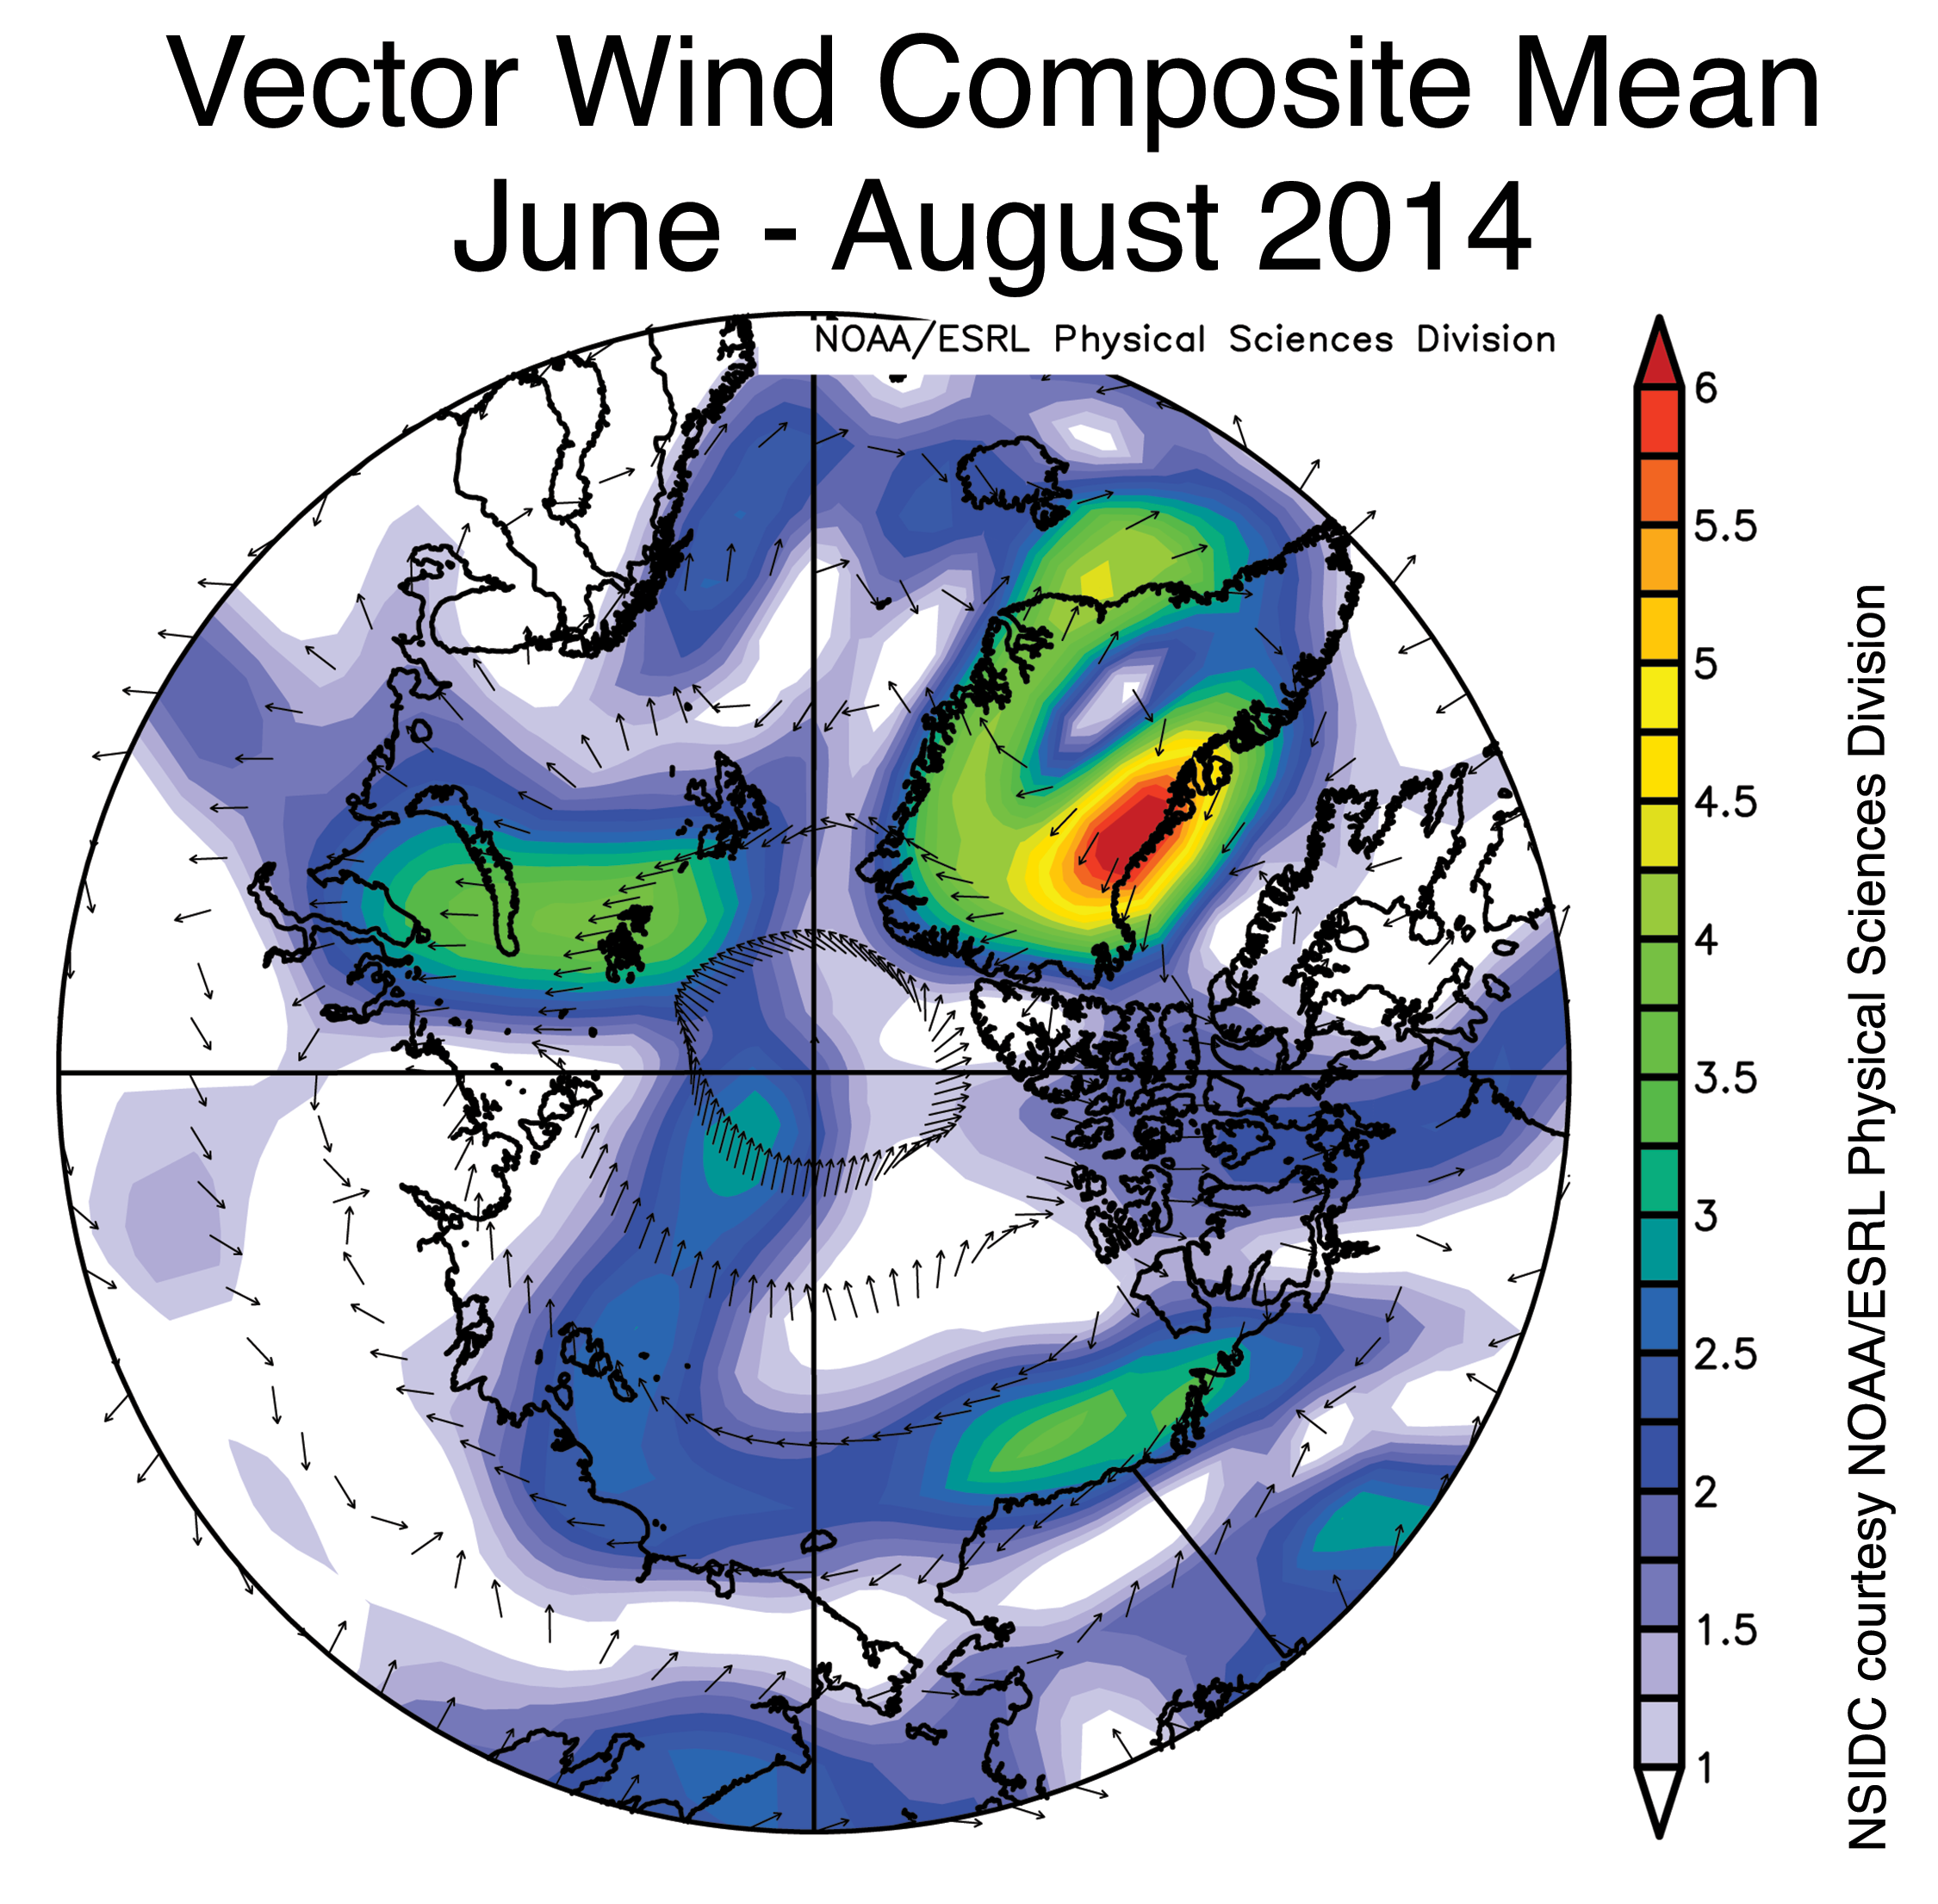
Figure 3b. This map shows surface wind patterns over the Arctic region from June to August 2014. Credit: NSIDC courtesy NOAA/ESRL Physical Sciences Division High-resolution image
In April, we discussed the pattern of ice age across the Arctic as the melt season began. In general, younger ice tends to be thinner ice. Areas of young ice are more likely to melt out during the summer than areas of old ice. The ice age figure from that post, reproduced here (Figure 3a), shows a strong northward extension of ice less than one year of age along the same general longitudes that open water has developed. Given the general circulation of the sea ice away from the Siberian shores, this area of thin ice prone to melting out would have tended to advance further northward through the melt season. Indeed, average sea level pressures this summer featured a pattern of surface winds particularly conducive to transporting thinner ice northward in the Laptev Sea sector (Figure 3b). To the east, winds were calmer and an arm of older, thicker second-year ice there may have helped to limit melt out and northward advection.
Sea surface temperature update

Figure 4. These maps show Arctic sea surface temperatures (left) and temperature anomalies (right) for August 2014, in degrees Celsius. Sea surface temperature data are from the National Climatic Data Center’s OIv2 “Reynolds” data set, a blend of satellite (Advanced Very High Resolution Radiometer) and in situ data designed to provide a bulk or mixed layer temperature. Ice edge data are from NSIDC near-real time passive microwave data. Credit: Mike Steele/University of Washington High-resolution image
As one may expect with an early retreat of sea ice, sea surface temperatures in the Laptev Sea were higher than average by up to 5 degrees Celsius (9 degrees Fahrenheit), with up to 3 degrees Celsius (5 degrees Fahrenheit) anomalies extending north of 80 degrees North for the first time since 2007. Early ice retreat and high sea surface temperatures are not unusual for this area and have appeared every summer since 2007, with the exception of 2008. The date of ice opening in the Laptev Sea is not particularly unusual in 2014 either. Open water and warming ocean temperatures started in early June. However, this summer there was a rapid northward progression of the ice edge in this area, especially along about longitude 140 degrees East, which allowed the sun to warm the resulting open water.
Over other parts of the Arctic, sea surface temperatures were not particularly noteworthy, except for cooler-than-average conditions in the northern Barents and Kara seas where the ice has remained extensive compared to recent summers. This reverses a recent trend toward warming and ice retreat in these areas, noted in last year’s sea surface temperature update. Preliminary analysis indicates that these changes are forced by local meteorological conditions, rather than oceanic heat transport by Atlantic water.
Further reading
Steele, M., S. Dickinson, and J. Zhang. 2014. Seasonal ice loss in the Beaufort Sea: Toward synchronicity and prediction. Journal of Geophysical Research-Oceans. In review.
Steele, M., S. Dickinson, and J. Zhang. 2014. Seasonal ice loss in the Beaufort Sea: Toward synchronicity and prediction. Journal of Geophysical Research-Oceans. In review.
No comments:
Post a Comment