In addition, Gavin's August 2014 anomaly map as of today shows the coldest and warmest anomalies on the planet are only separated by two 2° grid boxes (about 111 km per 1° or a total of only ~444 km). These two extreme cold/warm anomalies in Antarctica are indicated by the arrows below and correspond to a cold anomaly from -4 to -4.6C and a warm anomaly of +4 to +8C, thus a difference between the two of between 8C to 12.6C, over a mere ~444 km distance [276 miles].
Highly unlikely


 |
| 2° grid boxes shown with 1200 km smoothing. Top arrow is over an area currently covered by record-high levels of Antarctic sea ice. |
Related posts from StevenGoddard.wordpress.com yesterday and today:
A Closer Look At Record August Fraud From NASA
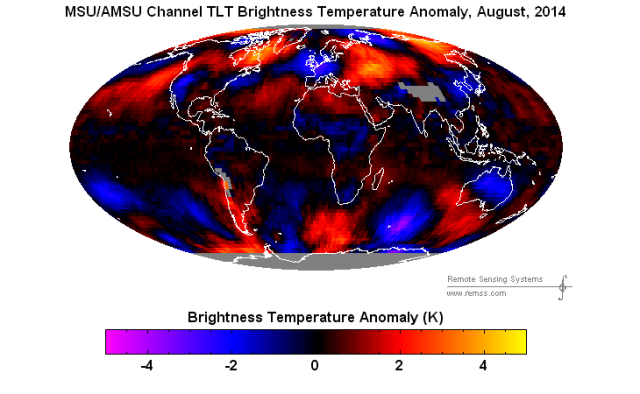
August was cool in the US, western Europe, southern Asia, parts of Siberia, Australia, Africa, South America, Antarctica and the Arctic. It was the first or second coldest summer on record north of 80N.
And NASA says it was the hottest August ever.

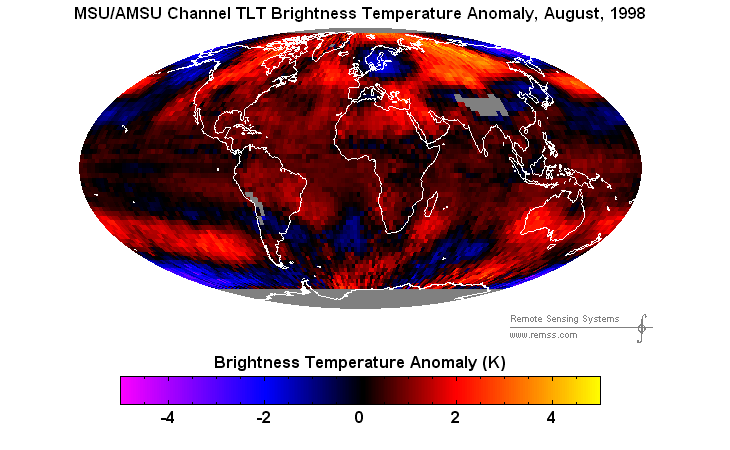
Compare vs. August 1998, when almost the whole world was hot.
August 2014 Is No Longer The Hottest On Record

Yesterday, Gavin told the Huffington Post that August was the hottest on record globally. He seems to have changed his mind since then, because today his map shows August was cooler than 2011 by 0.02 degrees.
2014 0.68 anomaly : Data.GISS: GISS Surface Temperature Analysis2011 0.70 anomaly : Data.GISS: GISS Surface Temperature Analysis
RSS shows that August was seventh coolest and below average since 1997. So how did Gavin create his since reversed scientific flustercluck?
There were three stations in Antarctica on the right side of the 250 km map below which he marked as very hot. Those three stations averaged about -20C. This map has 250km extrapolation, and gives a feel for where the stations are located, and where there is no data.
He extrapolated those three -20C Antarctic stations across a huge area of below normal temperatures on both the lower right and lower left side of the map, and massively skewed his global average anomaly using a large area of fake +6C anomaly, which he declared hot at -20C. This map shows Gavin’s 1200 km extrapolations to smear the earth with non-existent warm data.
But it is much worse than it seems. None of those three stations actually have any temperature data during the 1951-1980 baseline period, so his since recanted (disproven by his own data) claim is a complete fraud. How can he know what the anomaly is, if there was no temperature data during the baseline period? These are the three stations in the region which he has August 2014 temperature data for.


There are all kinds of other things he did wrong, including filling in Africa and South America with fake warm data, when RSS showed them cold. Problems with Australia too, which RSS showed cold.
Now lets look at Gavin’s abuse of the Arctic. DMI showed the area north of 80N as first or second coldest on record. Gavin had no data north of 80N, but filled it in with hot data,

In summary, the claim of record heat has since been disproven by his own data, and was based largely on fake, cold data at the poles – which he declared to be hot.
How could Antarctica have been hot? They have record sea ice extent, indicating the winds are blowing away from the pole, towards the coast.
Something Else That Doesn’t Make Sense
This is today’s version of GISS divergence from RSS graph. Normally during El Nino the gap closes, because the atmosphere warms more than the surface.. This year’s mini-El Nino has done the opposite.
This blog post is one of the many reasons why Hockeyschtick is my favourite blog.
ReplyDeleteClimatology is in such a terrible mess and the posts in this blog reveal why better than any other.
Thanks very much for your kind words, interest, and comments!
DeleteNice one, this. August 2014 the next warmest in 4 years. My comment is otherwise this:
ReplyDeleteAnomaly of +0.62, not very alarming. Long term trends, 17+ and 13+ years, still show cooling. The combined temperature data sets, and a thorough analysis is already out, cortesy of Bob Tisdale. Monthly temperature anomalies are not climate, they are weather, suffering from a high degree of variation and can be explained in any direction You might choose. So there is nothing to be alarmed of here. See this page for a sobering up:
https://bobtisdale.wordpress.com/2014/09/16/august-2014-global-surface-landocean-and-lower-troposphere-temperature-anomaly-update/
The disconnect between the IPCC data models and recorded, observed temperatures, and the 16 years of temperature standstill, despite CO2 rise, continue to be the most alarming issues in climate debate, even if we have had a warm summer.
well said
Delete