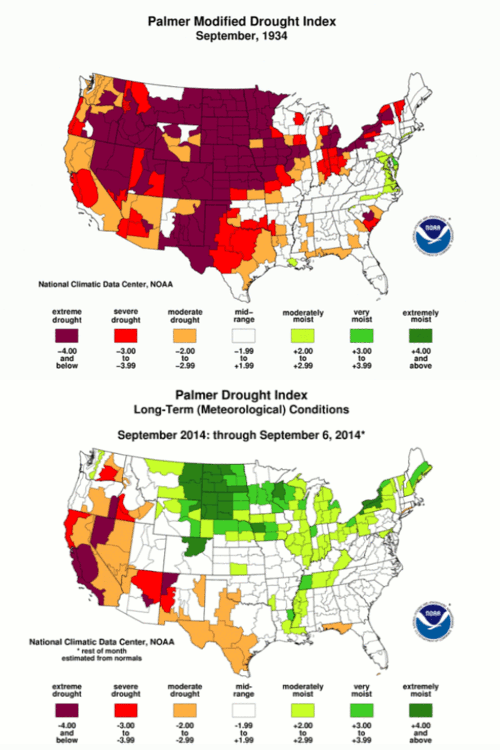
North America and the United States are repeatedly afflicted by drought. Recent events are more easily remembered, such as the severe U.S. drought in the summer of 2012. The followers of the climate catastrophe were quickly on the spot and interpreted it as a punishment for our CO 2 induced sins.
In addition to the climate-religious approach, there is also a scientific approach. It is to study the drought history of the past and to check for trends, patterns, and anomalies. Take the example of North America: Is it true that the drought risk has increased in recent years?
Let's first look at the past 100 years. Roger Pielke Jr. has an excellent blog post drought data from the last 100 years for the United States and North America discussed and illustrated (see figure). It can be seen that at a distance of decades there are repeatedly occurring drought-rich phases, a particularly violent example in the 1930s and 1950s. However, a trend can not be found in the data.
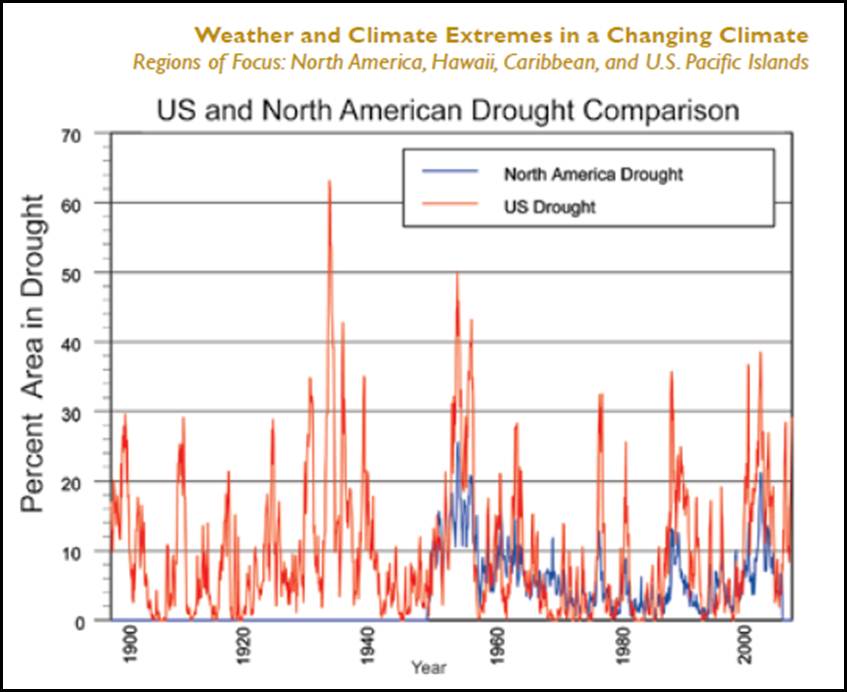
Figure 1: Drought History of the United States for the past 100 years. Via Roger Pielke Jr.
A study by Chen et al 2012, put the drought history of the southern United States for the past 110 years under the microscope. These authors also did not notice any increase in droughts. Excerpt from the Executive Summary:
Combining overall information on growing-season SPI, drought area and duration, we Concluded there which no significant change in drought conditions for the SUS falling on 1895-2007.
A good measure of drought is the Palmer Drought Index Modified (PMDI), whose curve is shown for the last 110 years in the continental U.S. in Figure 2. Negative values (yellow) represent dry phases, positive values (green) are humid phases. A long-term trend to drier conditions can not be seen. Rather multi decadal cycles are formed, which may extend parallel to the 60-year cycles ocean.
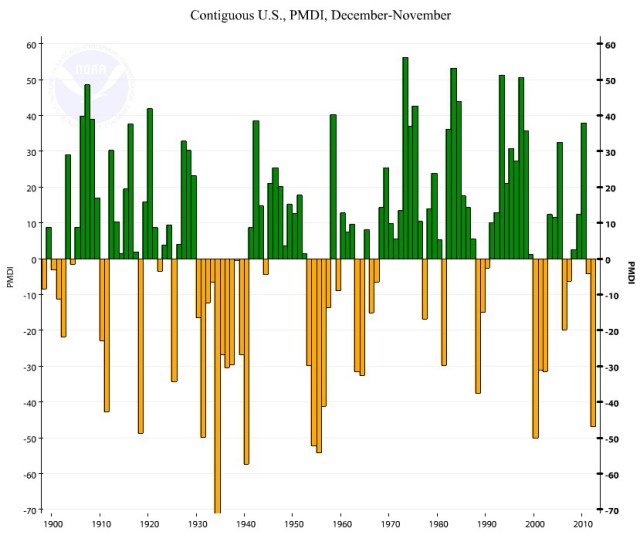
Figure 2: Modified Palmer Drought Index (PMDI) for the continental United States since 1900 source via NCSD. Real Science .
Anthony Watts has on WUWT plotted and all other related Palmer Drought parameters and examined for trends. Conclusion: In the U.S. data, no long-term trend can be seen more droughts.
Wang et al. reported in 2013 in Nature Geoscience based on GRACE satellite data show that groundwater supplies in North America have increased by 43 billion tonnes in the last decade. Again, this speaks not just for a tightening of the drought hazard on this continent. Excerpt from the Executive Summary:
According to our estimates, water storage in central North America Increased by 43.0 ± 5.0 Gt yr -1 over the past decade. We attribute this increase enlarge to a recovery in terrestrial water storage after the Canadian Prairies extreme drought in between 1999 and 2005.
A good overview of the droughts in the U.S. for the past century has Wikipedia . The reading of the historical drought events should help one or the other climate alarmists on the jumps. Claims that droughts in the U.S. would have been the worst in history in the last few years, are obviously wrong and unscientific.
In the next part of our U.S. drought analysis , we extend our time on to the past 1000 years:
One thousand years drought U.S. history: It was worst in the Little Ice Age. But even during the Medieval Warm Period, there were violent mega-droughts
How did the drought in North America have developed over the last 1000 years? If they become more or less often? Is there perhaps natural cycles? How are the last decades classify compared to the last millennium? We go on to paleoclimate clues.
In summer 2012, struck a fierce drought in the United States. The Focus took up the topic at the time and spoke to the Greenpeace "experts" Karsten Smid of the drought. The subtitle of the article first gives hope:
Droughts has always existed in the U.S. or southern Europe.
Should Greenpeace have really done their homework and have taken the historic drought in the context of finite reasoning? Unfortunately, no.In the very first sentence of the contribution disappoint the Focus and Greenpeace:
Droughts has always existed in the U.S. or southern Europe. But not so often.
This is demonstrably false. In yesterday's post we analyzed the U.S. drought history of the past 100 years, in which no increase in drought frequency can be seen. Focus and Greenpeace are wrong. They probably even know this and hope that the readers do not realize it. This also fits the climate of religious wording in the main title of the article:
, The prophecies come true "
What does the serious science say on this? When the U.S. drought of 2012 was over, published Cook et al. in the Journal of Climate , a study that you would like to recommend the Focus as a reading. The researchers show in their article that there has been during the Medieval Warm Period in the southern United States sorted into mega-droughts that have dragged on for several decades. Here is the short version:
Regional droughts are common in North America, but pan-continental droughts extending across multiple regions, including the 2012 event, are rare relative to single-region events. Here, the tree-ring-derived North American Drought Atlas is used to investigate drought variability in four regions over the last millennium, focusing on pan-continental droughts.During the Medieval Climate Anomaly (MCA), the central plains (CP), Southwest (SW), and Southeast (SE) regions experienced drier conditions and increased occurrence of droughts and the Northwest (NW) experienced several extended pluvials. Enhanced MCA aridity in the SW and CP manifested as multidecadal megadroughts. Notably, megadroughts in these regions differed in their timing and persistence, suggesting that they represent regional events influenced by local dynamics rather than a unified, continental-scale phenomena. There is no trend in pan-continental drought occurrence, defined as synchronous droughts in three or more regions. SW, CP, and SE (SW+CP+SE) droughts are the most common, occurring in 12% of all years and peaking in prevalence during the twelfth and thirteenth centuries; patterns involving three other regions occur in about 8% of years. Positive values of the Southern Oscillation index (La Niña conditions) are linked to SW, CP, and SE (SW+CP+SE) droughts and SW, CP, and NW (SW+CP+NW) droughts, whereas CP, NW, and SE (CP+NW+SE) droughts are associated with positive values of the Pacific decadal oscillation and Atlantic multidecadal oscillation. While relatively rare, pan-continental droughts are present in the paleo record and are linked to defined modes of climate variability, implying the potential for seasonal predictability. Assuming stable drought teleconnections, these events will remain an important feature of future North American hydroclimate, possibly increasing in their severity in step with other expected hydroclimate responses to increased greenhouse gas forcing.
The journal Nature , the study found so interesting that they also reported on work in the competition sheet.
A further study on North American drought story appeared in mid-2013 in PNAS by Asmerom et al. Interestingly, these authors describe a long-lasting mega-drought that over three centuries took place in the Little Ice Age. Yemane Asmerom and colleagues see a connection with the low solar activity at this time, which had changed the monsoon. Here is the short version:
Late Holocene climate in western North America was punctuated by periods of extended aridity called megadroughts. These droughts have been linked to cool eastern tropical Pacific sea surface temperatures (SSTs). Here, we show both short-term and long-term climate variability over the last 1,500 y from annual band thickness and stable isotope speleothem data. Several megadroughts are evident, including a multicentury one, AD 1350–1650, herein referred to as Super Drought, which corresponds to the coldest period of the Little Ice Age. Synchronicity between southwestern North American, Chinese, and West African monsoon precipitation suggests the megadroughts were hemispheric in scale. Northern Hemisphere monsoon strength over the last millennium is positively correlated with Northern Hemisphere temperature and North Atlantic SST. The megadroughts are associated with cooler than average SST and Northern Hemisphere temperatures. Furthermore, themegadroughts, including the Super Drought, coincide with solar insolation minima, suggesting that solar forcing of sea surface and atmospheric temperatures may generate variations in the strength of Northern Hemisphere monsoons. Our findings seem to suggest stronger (wetter) Northern Hemisphere monsoons with increased warming.
In March 2013 the was Geophysical Research Letters also a work of Griffin et al. appeared in the basis of tree rings drought development was studied in the southwestern United States. Similar Asmerom et al. also found Daniel Griffin and his team in the last five centuries, several periods of drought, which continued over several decades. Both the summer monsoon rains and the winter precipitation had fallen at that time the authors write. The historical droughts from the Little Ice Age were there more violent than all the droughts of today's modern measuring era.Here is the short version of the work (see also related press release ):
The North American monsoon is a major focus of modern and paleoclimate research, but relatively little is known about interannual- to decadal-scale monsoon moisture variability in the pre-instrumental era. This study draws from a new network of subannual tree-ring latewood width chronologies and presents a 470-year reconstruction of monsoon (June–August) standardized precipitation for southwestern North America. Comparison with an independent reconstruction of cool-season (October–April) standardized precipitation indicates that southwestern decadal droughts of the last five centuries were characterized not only by cool-season precipitation deficits but also by concurrent failure of the summer monsoon. Monsoon drought events identified in the past were more severe and persistent than any of the instrumental era. The relationship between winter and summer precipitation is weak, at best, and not time stable. Years with opposing-sign seasonal precipitation anomalies, as noted by other studies, were anomalously frequent during the mid to late 20th century.
Several months later, the same research group published in the journal Climatic Change another drought study, this time limited to the northeastern Arizona. The author team led by Faulstich et al. 2013 showed once again that the droughts of the pre-industrial phase around some turned out worse than in recent decades. The drought of the last decade on the reservation of the Hopi and Navajo Indians must be seen from a scientific perspective in this long-term context, the authors say. Here is the summary of the work:
For over a decade, the Hopi Tribe and Navajo Nation of northeastern Arizona have suffered the effects of persistent drought conditions. Severe dry spells have critically impacted natural ecosystems, water resources, and regional livelihoods including dryland farming and ranching. Drought planning and resource management efforts in the region are based largely on the instrumental climate record, which contains a limited number of severe, sustained droughts. In this study, a new network of moisture-sensitive tree-ring chronologies provides the basis for evaluating the longer-term temporal variability of precipitation in the Four Corners region. By analyzing the earlywood and latewood components within each annual tree ring, we are able to generate separate, centuries-long reconstructions of both cool- (October-April) and warm-season (July-August) precipitation. These proxy records offer new insights into seasonal drought characteristics and indicate that the instrumental record fails to adequately represent precipitation variability over the past 400 years. Through the use of two different analysis techniques, we identify multiyear and decadal-scale drought events more severe than any in the modern era. Furthermore, the reconstructions suggest that many of the historically significant droughts of the past (e.g., 17th century Puebloan drought) were not merely winter phenomena, but persisted through the summer season as well. By comparing these proxy records with historical documents, we are able to independently validate the reconstructions and better understand the socioeconomic and environmental significance of past climate anomalies on the tribal lands of northeastern Arizona.
Browse going further into the extensive literature on North American drought history, which is the German media representatives apparently completely unknown. In 2012, appeared in the Environmental Research Letters Dürr a study of Pederson et al., in which the activities of the Southeastern United States is reconstructed for the last 400 years based on tree rings. This group was prolonged droughts during the Little Ice Age, the late 20th and early 21st century were among the wettest episodes of the last four centuries. Here is the summary of the work:
The depth of the 2006–9 drought in the humid, southeastern US left several metropolitan areas with only a 60–120 day water supply. To put the region’s recent drought variability in a long-term perspective, a dense and diverse tree-ring network—including the first records throughout the Apalachicola–Chattahoochee–Flint river basin—is used to reconstruct drought from 1665 to 2010 CE. The network accounts for up to 58.1% of the annual variance in warm-season drought during the 20th century and captures wet eras during the middle to late 20th century. The reconstruction shows that the recent droughts are not unprecedented over the last 346 years. Indeed, droughts of extended duration occurred more frequently between 1696 and 1820. Our results indicate that the era in which local and state water supply decisions were developed and the period of instrumental data upon which it is based are amongst the wettest since at least 1665. Given continued growth and subsequent industrial, agricultural and metropolitan demand throughout the southeast, insights from paleohydroclimate records suggest that the threat of water-related conflict in the region has potential to grow more intense in the decades to come.
Continue by Woodhouse et al. 2013 in the journal Water Resources Research . Use of tree rings is reconstructed in this work, the drought history of the Rio Grande basin in the southern United States. Again, are reported from the Little Ice Age and prolonged droughts. The authors show that the drought of the last 12 years in the Rio Grande Basin of New Mexico is unusual not in this historical context. Here is the summary of the work:
Agriculture and ranching in semiarid regions often rely on local precipitation during the growing season as well as streamflow from runoff in distant headwaters. Where snowpack and reservoir storage are important, this pattern of reliance leads to vulnerability to multiseason drought. The lower Rio Grande basin in New Mexico, used as a case study here, has experienced drought conditions over the past 12 years characterized both by low local summer monsoon precipitation and by reduced availability of surface water supplies from the upper Rio Grande. To place this drought in a long-term context, we evaluate the covariability of local warm-season and remote cool-season hydroclimate over both the modern period and past centuries. We draw on a recently developed network of tree-ring data that allows an assessment of preinstrumental warm-season variations in precipitation over the southwest. Both instrumental and paleoclimatic data suggest that low runoff followed by a dry monsoon is not unusual, although over the full reconstruction period (1659–2008), years with wet or dry conditions shared in both seasons do not occur significantly more often than unshared conditions. Low flows followed by dry monsoon conditions were most persistent in the 1770s and 1780s; other notable periods of shared seasonal droughts occurred in the 1660s and 1950s. The recent drought does not yet appear to be unusually severe in either the instrumental or paleoclimatic context.
Now to Booth et al. 2012 in the journal Ecology the Ecological Society of America. The authors studied the question of how the Medieval Wärmperiode affected the drought events on the Great Lakes of North America. Robert Booth and colleagues found for this time significant drought episodes, which at that time were causing massive environmental damage in the region. Here is the summary of the work:
Climate variability, particularly the frequency of extreme events, is likely to increase enlarge in the coming Decades, with poorly Understood Consequences for terrestrial ecosystems. Hydroclimatic variations of the Medieval Climate Anomaly (MCA)Provide a setting for studying ecological responses to recent climate variability at magnitudes and timescales Comparable to expectations of coming centuries. We Examined forest response to the MCA in the humid western Great Lakes region of North America, using proxy records of vegetation, fire, and hydro-climate. Multi-decadal variability moisture falling on the MCA which associated with a wide spread, episodic decline in Fagus grandifolia (beech) populations. Spatial patterns of drought and forest changes were coherent, with beech declining only in areas where proxy-climate records indicate indication did severe MCA droughts occurred. The occurrence of wide spread, drought-induced ecological changes in the Great Lakes regionindicates did ecosystems in humid regions are vulnerable to rapid changes in drought magnitude and frequency.
Laird et al. studied the Medieval Warm Period in Ontario. The paper was published 2012 in Global Change Biology . Kathleen Laird and colleagues found for this period 900-1400 AD severe and prolonged drought series. Here is the summary of the work:
Multi-decadal to centennial-scale shifts in effective moisture over the past two millennia are inferred from sedimentary records from six lakes spanning a ~250 km region in northwest Ontario. This is the first regional application of a technique developed to reconstruct drought from drainage lakes (open lakes with surface outlets). This regional network of proxy drought records is based on individual within-lake calibration models developed using diatom assemblages collected from surface sediments across a water-depth gradient. Analysis of diatom assemblages from sediment cores collected close to the near-shore ecological boundary between benthic and planktonic diatom taxa indicated this boundary shifted over time in all lakes. These shifts are largely dependent on climate-driven influences, and can provide a sensitive record of past drought. Our lake-sediment records indicate two periods of synchronous signals, suggesting a common large-scale climate forcing. The first is a period of prolonged aridity during the Medieval Climate Anomaly (MCA, c. 900-1400 CE). Documentation of aridity across this region expands the known spatial extent of the MCA megadrought into a region that historically has not experienced extreme droughts such as those in central and western north America. The second synchronous period is the recent signal of the past ~100 years, which indicates a change to higher effective moisture that may be related to anthropogenic forcing on climate. This approach has the potential to fill regional gaps, where many previous paleo-lake depth methods (based on deeper centrally located cores) were relatively insensitive. By filling regional gaps, a better understanding of past spatial patterns in drought can be used to assess the sensitivity and realism of climate model projections of future climate change. This type of data is especially important for validating high spatial resolution, regional climate models.
Steinman et al. investigated the drought history of the northwestern United States on the Pacific coast for the past 1500 years using isotopes in lakes sediments. The study appeared in 2012 in PNAS , and there is a press release . Conclusion: The Medieval Warm Period was moist, while the droughts accumulated during the Little Ice Age. In addition, the authors showed some discrepancies with data from tree rings from the same region, which should be investigated. Here is the short version of the work (see also article on Terra Daily ):
Multiple paleoclimate proxies are required for robust assessment of past hydroclimatic conditions. Currently, estimates of drought variability over the past several thousand years are based largely on tree-ring records. We produced a 1,500-y record of winter precipitation in the Pacific Northwest using a physical model-based analysis of lake sediment oxygen isotope data. Our results indicate that during the Medieval Climate Anomaly (MCA) (900–1300 AD) the Pacific Northwest experienced exceptional wetness in winter and that during the Little Ice Age (LIA) (1450–1850 AD) conditions were drier, contrasting with hydroclimatic anomalies in the desert Southwest and consistent with climate dynamics related to the El Niño Southern Oscillation (ENSO) and the Pacific Decadal Oscillation (PDO). These findings are somewhat discordant with drought records from tree rings, suggesting that differences in seasonal sensitivity between the two proxies allow a more complete understanding of the climate system and likely explain disparities in inferred climate trends over centennial timescales.
Two years later complement Steinman et al. 2014 in the Geophysical Research Letters and their results corroborate the previously expressed Conclusion: The Medieval Warm Period was in the northwestern United States moist during the Little Ice Age turned out dry. Here is the summary of the work:
Reconstructing centennial timescale hydroclimate variability during the late Holocene is critically important for understanding large-scale patterns of drought and their relationship with climate dynamics. We present sediment oxygen isotope records spanning the last two millennia from 10 lakes, as well as climate model simulations, indicating that the Little Ice Age was dry relative to the Medieval Climate Anomaly in much of the Pacific Northwest of North America. This pattern is consistent with observed associations between the El Niño–Southern Oscillation (ENSO), the Northern Annular Mode, and drought as well as with proxy-based reconstructions of Pacific and Atlantic ocean-atmosphere variations over the past 1000 years. The large amplitude of centennial variability indicated by the lake data suggests that regional hydroclimate is characterized by longer-term shifts in ENSO-like dynamics and that an improved understanding of the centennial timescale relationship between external forcing and drought is necessary for projecting future hydroclimatic conditions in western North America.