Showing posts sorted by relevance for query michaels. Sort by date Show all posts

Friday, October 31, 2014

New paper finds climate sensitivity to CO2 significantly less than claimed by IPCC; low-sensitivity paper #37

A new paper published in Earth System Dynamics finds equilibrium climate sensitivity [ECS] to doubled CO2 levels is 1.8C, about 44% less than claimed by the IPCC AR5 report. The paper adds to at least 36 other peer-reviewed papers finding climate sensitivity to be significantly less than the IPCC mean modelled estimate of 3.2C [range 1.5 - 4.5C].

Excerpt from globalwarming.org: The IPCC’s 2007 Fourth Assessment Report (AR4) estimated a “likely” ECS range of 2°C-4.5°C, with a “best estimate” of 3°C. Since 2011, however, the warming pause and the growing divergence of model predictions and observed global temperatures have been the impetus for several studies finding that IPCC sensitivity estimates are too hot.

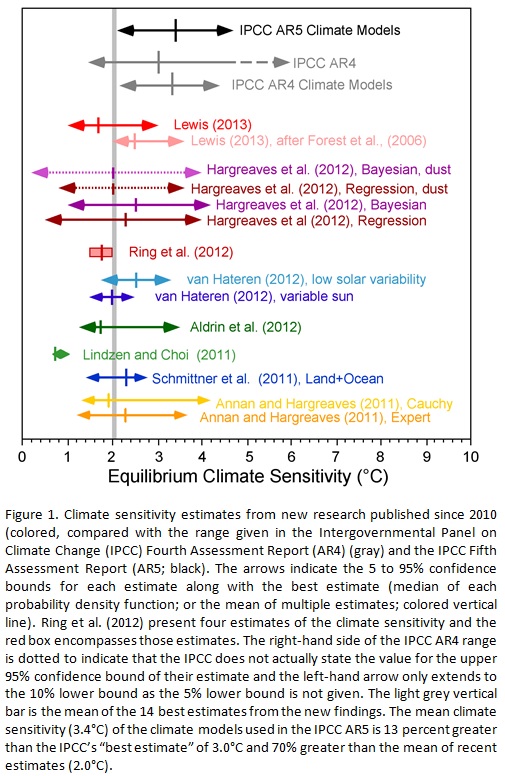
Cato Institute scientists Patrick Michaels and Chip Knappenberger maintain a growing list of such studies, which totaled 18 as of February 2014:


The average sensitivity estimate of the 18 studies compiled by Michaels and Knappenberger is just under 2°C. In other words, the IPCC AR4 “best estimate” of 3°C is 50% higher than the mean estimate of the new studies. That may be why the IPCC’s 2013-2014 Fifth Assessment Report (AR5) declines to offer a “best estimate.”

A new “best estimate” of 2°C would deflate the scary climate change impacts featured elsewhere in AR5, but recycling the same old 3°C “best estimate” would deflate the IPCC’s claim to be an honest broker. So instead the IPCC chose to lower the low end of the “likely” sensitivity range. Whereas the “likely” range in AR4 was 2°C-4.5°C, in AR5 it is 1.5°C-4.5°C.

That small concession, however, does not dispel the growing challenge to consensus climatology. As indicated in the Michaels and Knappenberger chart above, the average sensitivity of the climate models used in AR5 is 3.2°C. That is 60% higher than the mean of recent estimates (<
2°C).

An additional 21 peer-reviewed papers based upon observations and compiled by the Hockey Schtick find even lower ECS estimates of < 1C, about 7 times less than claimed by the IPCC. In total, there are now at least 37 published, peer-reviewed studies compiled by Michaels, Knappenberger, and the HS finding climate sensitivities significantly less than claimed by the IPCC. In contrast, there is a drought of studies finding climate sensitivities higher than claimed by the IPCC AR5 mean modelled estimate of 3.2C. 

The new paper below finds an ECS of 1.8C, but does not consider natural changes in ocean oscillations, cloud cover, global "brightening" & "dimming," which can alone explain all of the post-1950 warming. The paper also uses long-term ocean heat content [OHC] data as the basis of the ECS calculation, but the OHC trends have been determined to be exaggerated due to sampling biases in a paper published this week. The paper also does not consider the possibility of solar amplification mechanisms, which can explain 95% of climate change over the past 400 years. Consideration of these 4 factors would further lower the ECS estimates significantly. 

A description of the paper from the Swedish Stockholm Initiative site is below [Google translation], followed by the abstract and full paper in English. 


Norwegian research team got climate sensitivity (ECS) between 0.9 and 3.2 degrees C


The Norwegian research team consists of climate scientists and statistical mathematician. They have used every conceivable observations, together with a relatively simple climate model, a so-called energy balance model in which climate sensitivity is one of the input parameter values. They have adjusted the parameter values ​​of the climate model to observations using Bayesian statistics. They were then equilibrium climate sensitivity (ECS = Equilibrium Climate Sensitivity) to 1.8 degrees C (0.9 to 3.2 degrees C with 90% probability) for the doubling of carbon dioxide levels.
The article of Skeie et al. (2014) is published in the geosciences journal Earth System Dynamics.Three of the authors belong climate research center CICERO, University of Oslo, Terje Berntsen ,Gunnar Myhre and Ragnhild Bieltvedt Skeie . The other two authors are statistical mathematician belonging Norsk Regnesentral, Marit Holden and Magne Aldrin .
It inspires confidence that climate scientists here collaborates with statistical mathematician who is proficient in Bayesian statistics . The idea is to use a climate model that includes climate sensitivity as a parameter and to find out the value of climate sensitivity by adapting the model to the observed data. To do this properly with Bayesian statistics needed the expertise of statistical mathematics.
Magne Aldrin (2010) has given a presentation of the methods that they use at a workshop in Cambridge, UK in 2010. The simple climate model is not of the simplest kind, the atmosphere is divided into northern and southern hemispheres. The model ocean is still more complicated and divided into the southern polar ocean, the southern hemisphere's main body, the northern hemisphere's body and the northern polar ocean. The following figure gives an approximate schedule for this climate model (the dimensions listed are only possible examples).
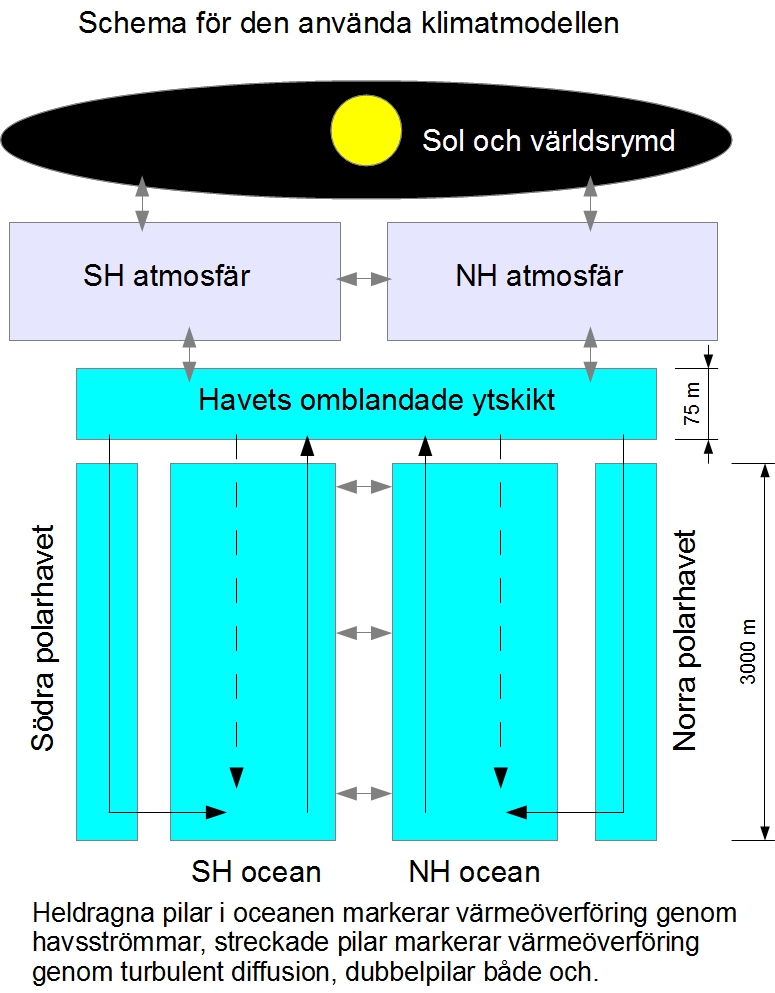
Climate model
This simple climate model , according to previous studies cited in Skeie et al. (2014) have been able to reproduce the simulations with advanced climate models. The reason for for this kind of adaptation of the model parameters to the observed data are not using an advanced climate model directly, is that such models are very complex and require too much computing power. One way to solve this problem is to do what the writers have done, using a simple model that has been confirmed by simulation can reproduce sophisticated climate model results.
Climate model includes climate sensitivity at equilibrium (ECS = Equilibrium Climate Sensitivity) as an unknown parameter, and six additional parameters related to the heat flows into the ocean to do. You also need radiation exchange between the atmosphere and the upper and solar. This type of data is called "radiative forcing" and that climate science has devoted considerable effort to determine, but the uncertainties in the data are still large. As is known, the impact of increased levels of greenhouse gases in the atmosphere, which mainly affects the "radiative forcing" and that they have pretty good data as well as changed aerosol influence and where the uncertainty is much larger.
Has values ​​of these seven parameters and a graph of how the "radiative forcing" has varied with time since pre-industrial times so this simple climate model to figure out how the temperature has varied in both the northern and southern hemispheres, and how the heat content of the ocean has changed. You can then modify the parameter values, whereby man is above all interested in climate sensitivity, within the possible limits of error, and also vary the "radiative forcing" within their error limits. In this way, one can see for what combinations of parameter values ​​to obtain curves for the temperatures and ocean heat content, which agrees with observations. This is what is called the parameter adjustment .
It's such a parameter adjustment statistical mathematician can help with making in a professional manner and really exploit the knowledge of Bayesian methods to get the best possible results. In this way one can determine a probability interval for climate sensitivity, in this case one can say about the ECS that the most likely value is 1.8 degrees C for a doubling of carbon dioxide and that with 90% probability value lies between 0.9 and 3.2 degrees C (compared to the UN Climate Change (IPCC) range to the 66-100% probability value lies between 1.5 and 4.5 degrees C).
The observations that the authors have used for their study is part six temperature series: HadCRUT3, NCDC and GISS for the northern and southern hemisphere (there is a significant body of scientific work that has taken a long time to implement, why not HadCRUT4 been used throughout, but only for a supplemental analysis ), and data for ocean heat content from Levitus research team at NOAA and two other research groups. So it is incredibly much data as adapting the model parameters to. It has also, as is possible in a Bayesian analysis, taken with data for ocean parameters based on independent observations as input data (so-called "prior probability distribution").
The result for the equilibrium sensitivity ECS is low, 1.8 degrees C for a doubling of carbon dioxide levels, but especially noteworthy is that the uncertainty interval, 0.9 to 3.2 degrees C, is shorter than in other similar studies. Compare, for example, with the much talked about recently published study by Lewis and Curry who were 1-4 degrees C.
The authors therefore studied how the results varied with the data ended. If they used data only up to 2000, they received a slightly higher climate sensitivity, but above all was the uncertainty range for much longer.
They suggest thereof an explanation of why this is so. This is partly due to "radiative forcing" has risen significantly during the past decade, so that the relative error of this has diminished. The second contributing factor is the availability of data for the heat content of the ocean has increased by 20% (depending on the test series starting about 1950). They say not to the reduced length of the uncertainty interval would have to do with heating the break.
The transient climate sensitivity is also of interest because it is this which, in theory, primarily determines the temperature will increase with increased greenhouse gas concentrations within 50 to 100 years. It uses as a measure of the climate sensitivity of the temperature increase due to how the temperature is affected by a change in the carbon content of 1% per year (ie 400 ppm increase in one year to 404 ppm). Climate sensitivity measure is called TCR (Transient Climate Response) and indicates the temperature rise at the time when carbon dioxide levels doubled, with 1% annually takes about 70 years.
Skeie et al. got the TCR value 1.4 degrees C with 90% probability that the value is in the range 0.8-2.2 degrees C. Even in this case was the uncertainty interval longer, almost 70% increase, if only the data up to 2000 were used .
The most exciting aspect of this very reassuring study, I think, is the already mentioned comparison with the UN climate panel climate sensitivity range, ie that climate sensitivity is likely, with 66-100% probability, is between 1.5 and 4.5 degrees Celsius . The latest scientific summary for policy makers (Summary for Policymakers, SPM) writes more accurately:
Equilibrium climate sensitivity is likely in the range 1.5 ° C to 4.5 ° C (high confidence), Extremely Unlikely less than 1 ° C (high confidence), and very Unlikely Greater Than 6 ° C (medium confidence).
(Likely = 66-100% probability, Extremely Unlikely = 0-5%, Very Unlikely = 0-10%).
This present study has instead concluded that with 90% probability is climate sensitivity between 0.9 and 3.2 ° C . The difference from the UN Climate Panel range of 1.5-4.5 degrees C is remarkable.
References
Skeie RB, Berntsen T, Aldrin M, Holden M, Myhre G (2014) A lower and more constrained estimate of climate sensitivity using updated observations and detailed radiative forcing time series . Earth Syst Dyn 5: 139-175. doi: 10.5194 / esd-5-139-2014
Earth Syst. Dynam., 5, 139-175, 2014
www.earth-syst-dynam.net/5/139/2014/
doi:10.5194/esd-5-139-2014


R. B. Skeie1, T. Berntsen1,2, M. Aldrin3,4, M. Holden3, and G. Myhre1
1Center for International Climate and Environmental Research – Oslo (CICERO), Oslo, Norway
2Department of Geosciences, University of Oslo, Oslo, Norway
3Norwegian Computing Center, Oslo, Norway
4Department of Mathematics, University of Oslo, Oslo, Norway

Abstract. Equilibrium climate sensitivity (ECS) is constrained based on observed near-surface temperature change, changes in ocean heat content (OHC) and detailed radiative forcing (RF) time series from pre-industrial times to 2010 for all main anthropogenic and natural forcing mechanism. The RF time series are linked to the observations of OHC and temperature change through an energy balance model (EBM) and a stochastic model, using a Bayesian approach to estimate the ECS and other unknown parameters from the data. For the net anthropogenic RF the posterior mean in 2010 is 2.0 Wm−2, with a 90% credible interval (C.I.) of 1.3 to 2.8 Wm−2, excluding present-day total aerosol effects (direct + indirect) stronger than −1.7 Wm−2. The posterior mean of the ECS is 1.8 °C, with 90% C.I. [confidence interval] ranging from 0.9 to 3.2 °C, which is tighter than most previously published estimates. We find that using three OHC data sets simultaneously and data for global mean temperature and OHC up to 2010 substantially narrows the range in ECS compared to using less updated data and only one OHC data set. Using only one OHC set and data up to 2000 can produce comparable results as previously published estimates using observations in the 20th century, including the heavy tail in the probability function. The analyses show a significant contribution of internal variability on a multi-decadal scale to the global mean temperature change. If we do not explicitly account for long-term internal variability, the 90% C.I. is 40% narrower than in the main analysis and the mean ECS becomes slightly lower, which demonstrates that the uncertainty in ECS may be severely underestimated if the method is too simple. In addition to the uncertainties represented through the estimated probability density functions, there may be uncertainties due to limitations in the treatment of the temporal development in RF and structural uncertainties in the EBM.

Citation: Skeie, R. B., Berntsen, T., Aldrin, M., Holden, M., and Myhre, G.: A lower and more constrained estimate of climate sensitivity using updated observations and detailed radiative forcing time series, Earth Syst. Dynam., 5, 139-175, doi:10.5194/esd-5-139-2014, 2014.
Related:

Three new studies demonstrate climate sensitivity to CO2 is very low

Thursday, November 18, 2010

Dr. Patrick Michaels: IPCC Forecasts are Incorrect

TESTIMONY OF PATRICK J. MICHAELS TO THE SUBCOMMITTEE ON ENERGY AND ENVIRONMENT, COMMITTEE ON SCIENCE AND TECHNOLOGY, U.S HOUSE OF REPRESENTATIVES, NOVEMBER 17, 2010

Thank you for inviting my testimony. I am a Senior Fellow in Environmental Studies at the Cato Institute and Distinguished Senior Fellow in the School of Public Policy at George Mason University. This testimony represents no official point of view from either of these institutions and is tendered with the traditional protections of academic freedom.

My testimony has four objectives

1) Demonstration that the rate greenhouse-related warming is clearly below the mean of climate forecasts from the United Nations Intergovernmental Panel on Climate Change (IPCC) that are based upon changes in atmospheric carbon dioxide concentrations that are closest to what is actually being observed,

2) demonstration that the Finding of Endangerment from greenhouse gases by the Environmental Protection Agency is based upon a very dubious and critical assumption,

3) demonstration that the definition of science as a public good induces certain biases that substantially devalue efforts to synthesize science, such as those undertaken by the IPCC and the U.S. Climate Change Science Program (CCSP), and

4) demonstration that there is substantial discontent with governmental and intergovernmental syntheses of climate change and with policies passed by this House of Representatives.

Climate change is nothing new, even climate change induced by human activity. What matters is not whether or not something so obvious exists, but to what magnitude it exists and how people adapt to such change.For decades, scientists have attempted to model the behavior of our atmosphere as carbon dioxide and other greenhouse gases are added above the base levels established before human prehistory. The results are interesting but are highly dependent upon the amount of carbon dioxide that resides in the atmosphere, something that is very difficult to predict long into the future with any confidence. It is safe to say that no one—no matter whether he or she works for the government, for industry, or in education—can tell what our technology will be 100 years from now. We can only say that if history is to be any guide, it will be radically different from what we use today and that therefore projecting greenhouse gas emissions so far into the future is, to choose a word carefully, useless.

One thing we are certain of, though, is that the development of future technologies depends upon capital investment, and that it would be foolish to continue to spend such resources in expensive programs that will in fact do nothing significant to global temperature.

Fortunately, despite the doomsaying of several, we indeed have the opportunity to not waste resources now, but instead to invest them much further in the future. That is because the atmosphere is clearly declaring that the response to changes in carbon dioxide is much more modest that what appears to be the consensus of scientific models.

Testimony Objective #1: Greenhouse-related warming is clearly below the mean of relevant climate forecasts from the IPCC

Figure 1 shows the community of computer model projections from the IPCC‘s midrange scenario. Observed changes in atmospheric carbon dioxide concentrations correspond closer to this one than to others. You will note one common characteristic of these models: they predict warmings of a relatively constant rate. This is because, in large part, the response of temperature to changes in atmospheric carbon dioxide is logarithmic (meaning that equal incremental increases produce proportionally less warming as concentration increases), while the increase in carbon dioxide itself is a low- order exponent rather than a straight line. This combination tends to produce constant rates of warming.
The various models just produce different quasi-constant rates. Divining future warming then becomes rather easy. Do we have a constant rate of warming? And if so, then we know the future rate, unless the functional form of all of these models is wrong. And if this is wrong, scientists are so ignorant of this problem, that you are wasting your time in soliciting our expertise. {see remainder of testimony here}

...An additional and important discrepancy between the models and reality extends into the lower atmosphere as well. In the lower atmosphere, climate models expectations are that the degree of warming with increasing greenhouse gas concentrations should be greater than that experienced at the surface, with the lower atmosphere warming about 1.4 times faster than the average surface temperature. Despite claims that observations and models are in agreement (Santer et al., 2008), new analyses incorporating a large number of both observational datasets as well as climate model projections, clearly and strongly demonstrate that the surface warming (which itself is below the model mean) is significantly outpacing the warming in the lower atmosphere—contrary to climate model expectations. Instead of exhibiting 40% more warming than the surface, the lower atmosphere is warming 25% less—a statistically significant difference (Christy et al., 2010).

Dr. Michaels also concludes, "Consequently EPA‘s core statement (as well as that of the IPCC and the CCSP), “Most of the observed increase in global average temperatures since the mid-20th century is very likely due to the observed increase in anthropogenic GHG [greenhouse gas] concentrations”, is not supported."

Wednesday, April 28, 2010

Re-recorded History

The animation below shows how the surface, weather balloon, and even satellite data has been adjusted between years 1995, 2000, and 2006:

Older inconvenient data are pushed down and recent data increased to create a tidy story. Created from slides of Pat Michaels presentation from the highly recommended video below of the Cooler Heads Coalition congressional briefing on the science and politics of the "Climategate" scandal. Featured speakers are George Mason University Distinguished Senior Fellow Pat Michaels and International Climate and Environmental Change Assessment Project (ICECAP) Executive Director Joseph D'Aleo:

Tuesday, July 23, 2013

Delingpole: 97 per cent of climate activists in the pay of Big Oil shock!

97 per cent of climate activists in the pay of Big Oil shock!

By James Delingpole Last updated: July 23rd, 2013

Unless you're a reader of the Guardian Environment's recently added section "Sacrifice your children to Mother Gaia. It's the only way!", you'll probably never have heard of the man who co-edits it, Dana Nuccitelli. But you'll certainly be familiar with his most famous bogus statistical artefact: the one he created with fellow climate alarmist John Cook to prove that 97 per cent of climate scientists really DO believe in global warming.

The claim has been roundly debunked. Apart from the problems with its statistical methodology, its findings are essentially meaningless. As Ben Pile points out in this characteristically measured, thoughtful piece,

"Nuccitelli’s survey results are either the result of a comprehensive failure to understand the climate debate, or an attempt to divide it in such a way as to frame the result for political ends."

Indeed, adds Pile, they represent:
"a cartoonish polarisation of positions within the climate debate."

How so? Well, as (climate sceptical) Bishop Hill once asked on Twitter: "Isn't everyone in the 97 per cent? I am." When the question was repeated at the Bishop's website by Met Office's Richard Betts, almost all those present agreed that they were. I would have done too, depending, of course, on precisely how you interpret the "consensus position" that "humans are causing global warming."

Well of course they are. Even if it's only down to the Urban Heat Island effect or the methane from beef cattle, humans almost certainly have an influence on climate. But so what? It always astonishes me when I see climate alarmists – even nice, well-meaning ones like Richard Betts – get all excited about this, as if somehow it represents a sudden concession by sceptics to the cause of warmism. If the alarmists spent any time paying attention to Watts Up With That, Bishop Hill or any of the myriad other sceptical websites out there, they would realise that this is what we've always thought. Our beef with the alarmists is not over the issue "Do humans contribute to climate change?" It's over "Do humanssignificantly contribute to climate chnage?" "Is there any evidence that this climate change is catastrophic or unprecedented?" "Do we need to do anything about it?" "Can we do anything about it?" "And are we sure that the cures currently being proposed aren't worse than the problem they're supposed to solve?"

But see, here we go again: here I am getting bogged down in a tedious and irrelevant non-argument of the kind the Warmists are always setting up in order to distract lay readers from more pertinent issues: like the fact that wind farms are just crap; that the evidence for catastrophic man-made global warming just hasn't materialised; that the polar bears aren't endangered; and so on.

Props to Dana Nuccitelli – he is, like his fellow climate activist Bob Ward – an absolute master of this straw man distraction technique. The term for it is "Clown Dancing" and Nuccitelli is the veritable Coco-and-Ronald-McDonald-in-a-sticky-embrace-with-Nureyev of the coulroterpsichorean art.

Anyway, all this is by the by. Another of the techniques used by Nuccitelli and his ilk is the "funded by Big Oil" meme. This is the silly notion, popularised by the likes of Al Gore and Michael Mann, that the main reason we climate sceptics say the pesky sceptical things we do is because we're paid to say so by various oil interests. Here is Nuccitelli in his Guardian column only last week on sceptical stalwart Pat Michaels:

"Michaels has admitted that his funding comes heavily from the fossil fuel industry"

In truth, the exact opposite more commonly the case. Few corporate interests are quite so heavily in bed with Big Green as Big Oil – as you'll shortly be seeing when I do a number on Shell and its highly dubious behaviour re the UK shale gas industry – and it seems the hypocritical and disingenuous clown-dancer extraordinaire Nuccitelli is no exception.

He has tried to keep it quiet. But there's no – what's the word? Oh yeah…. – denying it: green activist Dana Nuccitelli is in the pay of Big Oil.

Friday, July 11, 2014

The deep regrets of the climate scientists who hired both Mann & Hansen

ICCC 2014 Anecdote:

I had a wonderful time attending the ICCC 2014 in Las Vegas and an opportunity to speak with several prominent climate scientists, including Dr. John Theon, the retired senior NASA atmospheric scientist who first hired James Hansen at NASA, and Dr. Pat Michaels, who first hired Michael Mann as an assistant professor at the University of Virginia.

If I may summarize these conversations, both Drs. Theon and Michaels indicated that they deeply regret hiring Hansen and Mann respectively, arguably the two most damaging people to individual freedom and the economic prosperity of all humanity, especially the poorest individuals on the planet. 

Friday, June 14, 2013

Global Warming and Energy Insanity

Global Warming and Energy Insanity

Rush Limbaugh hasn’t made a lot of green friends over the years with his “environmental wacko” tirades, but, given what’s going on these days, perhaps his rhetoric has been too mild.

Exhibit No. 1 is the sleek and sexy Tesla Model S. If you want the one with the lowest chance of stranding you on I-95, it will set you back over $100,000. You’ll be refunded $7,500 from the federal government, several thousand more (in most states) from state taxpayers, plus various other credits that governments bestow upon ostentatious and cheap virtue, like putting a special plug in your garage. Somehow, Tesla is still losing money.

You might have read otherwise. The company’s stock price doubled — to about $110 a share — after it reported a profit last month. Along the way, its genius founder, Elon Musk, hit upon the clever notion of paying off hundreds of million dollars in federal loans by issuing a jillion more shares of TSLA stock.

Supply and demand usually dictates that when the number of shares in a company is dramatically increased, the price goes down, but this is not the case with TSLA. By announcing a phony profit, TSLA made its stock kite to the point that issuing even more of it generated enough dough to retire its massive federal debt.

By “phony” I mean this: Conservatively speaking, Tesla lost about $11,000 for every car that rolled out the door last quarter. But they covered that by selling $68 million in “credits” to their competitors.

These competitors had chosen not to enter the obviously limited market for cars with an average real-world range of around 200 miles. We know the market is limited thanks to the paltry sales (averaging around 2,000 per year) of the Honda Civic GX, a natural-gas-powered version with about that range. But the State of California punishes car companies that won’t go along with this craziness, making them buy “credits” to not produce what no sane company would, from the only one that does: Tesla.

Honda (“The Power of Dreams”) thinks it’s a perilous business model to depend upon evanescent global-warming shakedowns and subsidies. They are reading the recent scientific literature in which climate scientists are clumsily trying to thread the needle between backing off their forecasts of the end of the world and maintaining a shred of credibility.

Exhibit No. 2 is the increasing clear-cutting of the jungle-like dense vegetation of the southeastern U.S. to fight global warming. Say what?

Remember all that caterwauling that cutting down the world’s forests is a bad idea because it results in increasing carbon dioxide emissions as the felled trees are burned? As Mikhail Gorbachev says, “that’s old thinking.” The EU has now decided that forests are “renewable,” and that their wood is a renewable fuel, disregarding their previous concerns about carbon emissions. But they won’t cut their own forests, because they have laws against clear-cutting, or mowing down the entire woods.

So we cut down ours. The 100-year-old trees of Northampton County, N.C., that are being bulldozed, pelletized, and shipped to Europe to be combusted in (previously) coal-fired power plants indeed are renewed — after 101 years. In the meantime, global concentrations of carbon dioxide increase, but the Euros meet their 2020 target.

The green pashas of the EU have finally come to the realization that their previous favorite “renewable” technologies — solar energy and windmills — aren’t going to get them even close to their silly commitment to reduce their emissions of dreaded carbon dioxide by 20 percent below 1990 levels a mere 6.5 years from today.

Maybe that’s because solar is guaranteed not to work whenever there’s insufficient solar radiation — about 50 percent of the time, or “night” — and Europe’s high latitude means there is little insolation except during the summer. And maybe it’s because the “load factor” for wind is even worse, running around 15 percent. There is no way anyone would invest in such insanity if it weren’t paid for with other people’s money.

The Euros could reduce emissions the way the good old U.S.A. is doing, by hydraulically fracturing deep shale for natural gas. That increases supply to the point that it displaces coal for electrical generation, which results in cheaper power and half the carbon dioxide emissions. They could, but the same nutsos who think that reducing their emissions will have a detectable effect on global temperature also think shale gas is yucky.

Why won’t they go our way? Because the green world is stark, raving mad.
Destroying the forest for the good of the environment is insane, right? So is shaking down auto companies that produce profits by selling cars rather than indulgences, and so is giving folks who buy $100,000 cars an average of $10,000 of taxpayer largesse.

Rush was right: Wackos.
— Patrick J. Michaels is a senior fellow at the Cato Institute.

Sunday, November 29, 2009

A compilation of key Climategate emails

Celebrating death of a skeptic

From: Phil Jones, Thu Jan 29 14:17:01 2004
In an odd way this is cheering news !

Erroneous data, practices, and models

From: Tom Wigley, Date: Fri, 06 Nov 2009 17:36:15 -0700
We probably need to say more about this. Land warming since 1980 has been twice the ocean warming — and skeptics might claim that this proves that urban warming is real and important.

From: Kevin Trenberth, before Wed, 14 Oct 2009 01:01:24 -0600
The fact is that we can’t account for the lack of warming at the moment and it is a travesty that we can’t. The CERES data published in the August BAMS 09 supplement on 2008 shows there should be even more warming: but the data are surely wrong. Our observing system is inadequate.

From: Michael Mann Date: 27/10/2009, 16:54
Perhaps we'll do a simple update to the Yamal post, e.g. linking Keith/s new page--Gavin t? As to the issues of robustness, particularly w.r.t. inclusion of the Yamal series, we actually emphasized that (including the Osborn and Briffa '06 sensitivity test) in our original post! As we all know, this isn't about truth at all, its about plausibly deniable accusations.

Sunday, January 12, 2014

Papers finding climate models are unable to simulate the Polar Vortex

Global warming alarmists have made the ridiculous claim that the record cold from the 'Polar Vortex' was predicted by climate models as a response to alleged man-made global warming.

However, at least two peer-reviewed publications [noted below] find that climate models have been unable to simulate the behavior of the polar vortex and that little if any confidence should be placed in the model predictions of the polar vortex response to alleged man-made global warming. 

In addition, three other peer-reviewed papers find that there is no evidence of any trend over up to the past 142 years in jet stream blocking or location, which in turn controls the polar vortex:


However, there is observational evidence that the polar vortex is related to solar activity, not man-made CO2. 

Once again, the global warming apologists are caught hiding behind highly flawed climate models in the face of contradictory real-world data. Dr. Roy Spencer sums it up in a post:

Does Global Warming Theory Predict Record Cold?
January 6th, 2014 by Roy W. Spencer, Ph. D.
 
NO.

Elementary statistical analysis shows the claim that extreme cold occurs because of warming simply doesn’t stand up to scrutiny.

Excerpt from the paper Stratospheric Polar Vortices:

"A key issue for both the recovery of stratospheric ozone
and the influence of the stratosphere on tropospheric climate
is how the polar vortices will change, if at all, as greenhouse
gases continue to increase. The stratosphere will cool
because of the direct radiative effect of increased CO2, but
whether the polar vortices will be come stronger or weaker
will likely depend on changes in wave activity entering
the stratosphere. There is currently no agreement between
climate models as to trends in either the wave activity
entering the stratosphere or the strength of the polar vortex,
although the trends are generally small in all models. It is
unclear how much confidence can be put into the model
projections of the vortices given that the models typically
only have moderate resolution and that the climatological
structure of the vortices in the models depends on the tuning
of gravity wave parameterizations. Given the above outstanding 
issues, there is need for continued research in the dynamics of 
the vortices and their representation in global models."

Abstract from the paper Assessment and Consequences of the Delayed Breakup of the Antarctic Polar Vortex in Chemistry-Climate Models

Title:
Assessment and Consequences of the Delayed Breakup of the Antarctic Polar Vortex in Chemistry-Climate Models
Authors:
Hurwitz, M. M.Newman, P. A.Li, F.Morgenstern, O.Braesicke, P.Pyle, J. A.
Affiliation:
AA(NASA Postdoctoral Program, NASA Goddard Space Flight Center, Greenbelt, MD, USA margaret.m.hurwitz@nasa.gov), AB(NASA Goddard Space Flight Center, Code 613.3, Greenbelt, MD, USA paul.a.newman@nasa.gov), AC(Goddard Earth Sciences and Technology Center, University of Maryland, Baltimore County, Baltimore, MD, USA feng.li@nasa.gov), AD(National Institute of Water and Atmospheric Research, Private Bag 50061, Omakau, New Zealand o.morgenstern@niwa.co.nz; NCAS-Climate-Chemistry, Chemistry Department, University of Cambridge, Cambridge, UK peter.braesicke@atm.ch.cam.ac.uk john.pyle@atm.ch.cam.ac.uk), AE(NCAS-Climate-Chemistry, Chemistry Department, University of Cambridge, Cambridge, UK peter.braesicke@atm.ch.cam.ac.uk john.pyle@atm.ch.cam.ac.uk), AF(NCAS-Climate-Chemistry, Chemistry Department, University of Cambridge, Cambridge, UK peter.braesicke@atm.ch.cam.ac.uk john.pyle@atm.ch.cam.ac.uk)
Publication:
EGU General Assembly 2009, held 19-24 April, 2009 in Vienna, Austria http://meetings.copernicus.org/egu2009, p.651
Publication Date:
04/2009
Origin:
COPERNICUS
Bibliographic Code:
2009EGUGA..11..651H

Abstract

Many atmospheric general circulation models (GCMs) and chemistry-climate models (CCMs) are not able to reproduce the observed polar stratospheric winds in simulations of the late 20th century. Specifically, the polar vortices break down too late and peak wind speeds are higher than in the ERA-40 reanalysis. Insufficient planetary wave driving during the October-November period delays the breakup of the southern hemisphere (SH) polar vortex in versions 1 (V1) and 2 (V2) of the Goddard Earth Observing System (GEOS) chemistry-climate model, and is likely the cause of the delayed breakup in other CCMs with similarly weak October-November wave driving. Differences in the models' response to years when the modelled eddy heat flux at 100hPa is relatively weak or relatively strong allow the consequences of the late breakup of the polar vortex to be evaluated. In the V1 model, the delayed breakup of the Antarctic vortex biases temperature, circulation and trace gas concentrations in the polar stratosphere in spring. The V2 model behaves similarly (despite major model upgrades from V1), though the magnitudes of the anomalous effects on springtime dynamics are smaller. As greenhouse gas concentrations continue to rise, the atmospheric temperature structure and resulting zonal wind structure are expected to change. Clearly, if CCMs cannot duplicate the observed response of the polar stratosphere to late 20th century climate forcings, their ability to simulate the polar vortices in future may be poor. Understanding model weaknesses and improving the modelled stratospheric winds will be necessary for accurate predictions of ozone recovery.

Polar Vortex: Global Warming Divides America Over Climate Change Science


Polar Vortex: Global Warming Divides America Over Climate Change Science

When it comes to the polar vortex, global warming has America divided over whether climate change science messed up big time. After all, it seems counter-intuitive that the global temperature average would cause some locations to experience colder-than-usual weather.
As previously reported by The Inquisitr, several years ago NOAA hypothesized that a reduction in Arctic ice and temperature could result in the polar vortex causing cold weather. In contrast, some of the computer models even predict long term stasis or cooling, although the majority definitely favored warming.
To give you an idea how things can vary in the conditions created by the polar vortex, in the past week there were 665 lowest cold records set while 101 locations reported record highs for this time period (my guess is that Florida has some of those). The effects of the polar vortex are only supposed to last until about the middle of this week, but the political effect in the United States may reverberate for some time to come.
As might be expected, Rush Limbaugh, Donald Trump, and Sean Hannity disagree with the various predictions made on behalf of climate change science. But some in the media, including the Huffington Post, claim “this frigid weather is another example of the kind of violent and abrupt climate change that results from global warming.”
Others like Jason Samenow take the stance that global warming is a separate issue from the polar vortex because similar weather conditions “happened before humans dumped billions of tons of carbon dioxide into the atmosphere and will happen again.” Some reports also point out how the last time the polar vortex caused such drastically cold weather was in the 1980s and also how 2013 set record hot temperatures in Australia.
But what does the science say? Regardless of NOAA’s hypothesis related to air temperature and the Arctic ice extent, studies from 2009 and 2010 doubt the ability of computer models to determine if climate change and the break up of a polar vortex are related:
“Clearly, if CCMs [chemistry climate models] cannot duplicate the observed response of the polar stratosphere to late 20th century climate forcings, their ability to simulate the polar vortices in future may be poor.”
…and…
“It is unclear how much confidence can be put into the model projections of the vortices given that the models typically only have moderate resolution and that the climatological structure of the vortices in the models depends on the tuning of gravity wave parameterizations.”

The Polar Vortex, Global Warming, And Politics

When it comes to the American public, Pew Research Center found only 28 percent believe “dealing with global warming” is a top priority, which has gone down from 38 percent in 2007. Interestingly enough, even among Democrats the political support for implementing policies based upon global warming has fallen down to 38 percent.
Perhaps because of the doubts many Americans have been expressing, the White House felt it needed to issue a statement:
“We know that no single weather episode proves or disproves climate change. Climate refers to the patterns observed in the weather over time and space — in terms of averages, variations, and probabilities. But we also know that this week’s cold spell is of a type there’s reason to believe may become more frequent in a world that’s getting warmer, on average, because of greenhouse-gas pollution.”
The recent events have also caused some to call for politics to get out science. For example, Patrick J. Michaels, the director of the Center for the Study of Science at the Cato Institute, pointed out how Nobel Prize winner Randy Schekman wrote that science journals like “Nature, Cell, and Science are damaging science” by focusing on publishing manuscripts with the “flashiest” headlines. Michaels believes these type of headlines “compel politicians to disburse more money for more research, ultimately buying a beach house for the doom-saying scientists“:
“This creates horrific effects, especially when the issues are policy-related. Summaries of the scientific literature are used to guide policymakers, but if the published research is biased, then so must be the summaries; leaving policymakers no option – not being scientists themselves – but to embrace what is inevitably touted as ‘the best science.’”
Does the cold weather caused by the polar vortex alter your beliefs about global warming or climate change science? Either way, what do you think should be done about the alleged bias in scientific circles?

Read more at http://www.inquisitr.com/1087852/polar-vortex-global-warming-divides-america-over-climate-change-science/#MosK36SOd0gR7yYL.99

Tuesday, September 24, 2013

McIntyre demolishes IPCC credibility with one post

In a must-read post today, Steve McIntyre demolishes the credibility of the IPCC as a scientific organization, demonstrating why the IPCC will be unable to explain the 'pause' due to their willful obstruction of the science contrary to their political narrative. 

McIntyre also demonstrates why the currently-favored excuse for the 'pause' of "the oceans ate my global warming" is unsupportable.


Two Minutes to Midnight


Excerpts:

There is much in the news about how IPCC will handle the growing discrepancy between models and observations – long an issue at skeptic blogs. According to BBC News, a Dutch participant says that “governments are demanding a clear explanation” of the discrepancy. On the other hand, Der Spiegel reports:

German ministries insist that it is important not to detract from the effectiveness of climate change warnings by discussing the past 15 years’ lack of global warming. Doing so, they say, would result in a loss of the support necessary for pursuing rigorous climate policies.

According to Der Spiegal (h/t Judy Curry), Joachim Marotzke, has promised that the IPCC will “address this subject head-on”. Troublingly, Marotzke felt it necessary to add that “climate researchers have an obligation not to environmental policy but to the truth”.

Unfortunately, as Judy Curry recently observed, it is now two minutes to midnight in the IPCC timetable. It is now far too late to attempt to craft an assessment of a complicated issue.

Efforts to craft an assessment on the run are further complicated by past failures and neglect both by IPCC and the wider climate science community. In its two Draft Reports sent to external scientific review, while IPCC mostly evaded the problem, its perfunctory assessment of the developing discrepancy between models and observations, such as it was, included major errors and misrepresentations, all tending in the direction of minimizing the issue.

IPCC has a further dilemma in coopering up an assessment on the run. Although the topic is obviously an important one, it received negligible coverage in academic literature, especially prior to the IPCC publication cutoff date, and the few relevant peer-reviewed articles (e.g. Easterling and Wehner 2009; Knight et al 2009) are unconvincing.

The IPCC assessment has also been compromised by gatekeeping by fellow-traveler journal editors, who have routinely rejected skeptic articles on the discrepancy between models and observations or pointing out the weaknesses of articles now relied upon by IPCC. Despite exposure of these practices in Climategate, little has changed. Had the skeptic articles been published (as they ought to have been), the resulting debate would have been more robust and IPCC would have had more to draw on its present assessment dilemma. As it is, IPCC is surely in a well-earned quandary.
...
The [temperature] observations through 2010 fall within the upper range of the TAR projections (IPCC, 2001) and roughly in the middle of the AR4 model results.

This assertion was flat-out untrue. Their Figure 1.4 (see below), which purported to support this claim, was not derived from peer reviewed literature and was botched. They misplaced observations relative to AR4 model projections (presumably due to an error in transposing reference periods).
...
In a recent article in National Post, Ross
McKitrick pointed out the inconsistency between IPCC’s language and its graphic, acidly observing:

The IPCC must take everybody for fools. Its own graph shows that observed temperatures are not within the uncertainty range of projections; they have fallen below the bottom of the entire span.

Reiner Grundmann at Klimazweibel also recently drew attention to the discrepancy in this graphic (citing McKitrick).
...
The criticisms in both the Liljegren comment and the Michaels et al submission were valid at the time and remain valid today. Many of their criticisms surfaced recently in Fyfe et al 2013, though this did not rebut Easterling and Wehner 2009 or Knight et al 2009 as directly. Fyfe et al 2013 was not published until after the IPCC deadline and, thus, Easterling and Wehner 2009 and Knight et al 2009 remained unrebutted in academic journals and were essentially all that was in the cupboard for the IPCC assessment.

Ross and I had experienced something similar in our comment on Santer et al 2008, which was likewise rejected by the original journal (International Journal of Climatology.) A couple of years later, Ross managed to get much of this material into print as McKitrick et al 2010. However, in the meantime, Santer et al 2008 continued to be cited in assessment reports. As an ironic footnote to our earlier controversy, AR5 now cites McKitrick et al 2010 and concedes that the discrepancy between models and observations in the tropical troposphere is unresolved.
The Problem Re-stated

IPCC’s Government Draft attempt to frame the discrepancy between models and observations as due to “natural variability” is ultimately a statistical problem – never a strong point of IPCC authors. Further, as noted above, the statistical analysis in the Government Draft purporting to support “natural variability” is not drawn from previously published literature, but was developed within the chapter (despite frequent protestations that IPCC does not itself do research.)

IPCC conceded in the Government Draft that there has been a 15-year “hiatus” (their term) in temperature increase, but assert that “individual decades” of hiatus are also “exhibited” in climate models, during which time the “energy budget is balanced” by energy uptake in the deep ocean:

However, climate models exhibit individual decades of GMST trend hiatus even during a prolonged phase of energy uptake of the climate system (e. g., Figure 9.8, (Easterling and Wehner, 2009; Knight et al., 2009)), in which case the energy budget would be balanced by increasing subsurface-ocean heat uptake (Meehl et al., 2011; Guemas et al., 2013; Meehl et al., 2013a).

However, pointing to the deep ocean doesn’t actually resolve the discrepancy between models and observations, since, as Hans von Storch recently observed, climate models did not include this effect.

Among other things, there is evidence that the oceans have absorbed more heat than we initially calculated. Temperatures at depths greater than 700 meters (2,300 feet) appear to have increased more than ever before. The only unfortunate thing is that our simulations failed to predict this effect.

IPCC also asserted that similar hiatuses are “common” in the instrumental record:

15-year-long hiatus periods are common in both the observed and CMIP5 historical GMST time series (see [Figure 9.8] and also Section 2.4.3, Figure 2.20; Easterling and Wehner, 2009, Liebmann et al., 2010).

As shown below, there is indeed a lengthy “hiatus” in the 20th century record, stretching almost 40 years from the 1940s until 1980. However, IPCC is surely being a bit sly in saying that 15-year-long hiatus periods were “common” in the 20th century. It is far more reasonable to say that there was a steady temperature increase from the 19th century to the 1940s, followed by a 30-40 year hiatus, then a 30-year period of increase to the end of the century.
...
The suddenly-fashionable attribution of the present hiatus to unmodeled energy accumulation in the deep ocean also invites questions about the earlier hiatus, which the climate “community” conventionally attributes to aerosols. There is no independent record of historical aerosol levels, which (e.g. the prominent GISS series by Hansen’s group) have primarily been developed by climate modelers seeking to explain the long hiatus. Skeptics have long argued that aerosol histories have been used as a sort of deus ex machina to paper over excessively sensitive climate models.

Once again, IPCC invoked both “volcanic” and “aerosol” forcing as possible contributors for the present hiatus, but one feels that these efforts were somewhat half-hearted, though they did make their way to the SPM. The failure of IPCC scientists to draw attention in real time to the supposedly responsible volcanic events inevitably compromises any attempts to do so after the fact.

Thus, the sudden interest in positing energy accumulation in the deep ocean.

However, if the present hiatus is attributed to an unmodeled accumulation of energy in the deep ocean, how do we know that something similar didn’t happen during the long earlier hiatus? Could some portion of the earlier hiatus be due to deep ocean accumulation as opposed to aerosols? It’s a big door that’s being opened.

Opening the door also opens up questions about the potential length of the present hiatus. If unmodeled deep ocean processes are involved, how can we say with any certainty that the present hiatus won’t extend for 30-40 years?
...
Conclusion

No credence should be given to IPCC’s last-minute attribution of the discrepancy to “natural variability”. IPCC’s ad hoc analysis purporting to support this claim does not stand up to the light of day.

Gavin Schmidt excused IPCC’s failure to squarely address the discrepancy between models and observations saying that it was “just ridiculous” that IPCC be “up to date”:

The idea that IPCC needs to be up to date on what was written last week is just ridiculous.”

But the problem not arise “last week”. While the issue has only recently become acute, it has become acute because of accumulating failure during the AR5 assessment process, including errors and misrepresentations by IPCC in the assessments sent out for external review; the almost total failure of the academic climate community to address the discrepancy; gatekeeping by fellow-traveling journal editors that suppressed criticism of the defects in the limited academic literature on the topic.

Whatever the ultimate scientific explanation for the pause and its implications for the apparent discrepancy between models and observations, policy-makers must be feeling very letdown by the failure of IPCC and its contributing academic community to adequately address an issue that is critical to them and to the public.

That academics (e.g. Fyfe et al here; von Storch here) have finally begun to touch on the problem, but only after the IPCC deadline must surely add to their frustration. Von Storch neatly summarized the problem and calmly (as he does well) set it out as an important topic of ongoing research, but any investor in the climate research process must surely wonder why this wasn’t brought up six years ago in the scoping of the AR5 report.

One cannot help but wonder whether WG1 Chair Thomas Stocker might not have served the policy community better by spending more time ensuring that the discrepancy between models and observations was properly addressed in the IPCC draft reports, perhaps even highlighting research problems while there was time in the process, than figuring out how IPCC could evade FOI requests.

Monday, May 13, 2013

Professors Vahrenholt & Lüning: Three new papers that reject IPCC disaster scenarios

German professors & authors of "The Cold Sun" on the false alarm over alleged man-made global warming: "A historic science mistake has taken its course..."

Evidence of lower CO2 climate sensitivities condense: Three new papers reject the IPCC disaster scenarios

Dr. Fritz Vahrenholt  and Dr. Sebastian Lüning, authors of "The Cold Sun"
[Google translation + editing]: When temperatures shot up like a rocket from 1977-1998, climate researchers were amazed. That's a real smoking gun, this CO2, with such powerful and extremely potent effects on climate. Without further ado, some thought the CO2 accounted for almost the entire warming of about half a degree. Per doubling of CO2, the temperature should be driven upward by 2.0-4.5 ° C [the so-called climate sensitivity]. However, only one thing had been overlooked in the whole euphoria - that there may be natural factors that have contributed to this warming: The sun peaked in the 1980's-1990's at one of the strongest intensities of the last 10,000 years. And the 60-year [Pacific Decadal Oscillation] ocean cycle was moving at this time in the warm phase. A historic science mistake took its course ...
Now, after 15 years of no warming it gradually dawns on some researchers that there probably is something wrong. Almost monthly at the moment we see new work, that our estimate of the  (climate sensitivity) is now correct and the climate impact of CO2 has decreased (see our blog article " Reduced climate impact of CO2 will obtain more supporters in Science " and " The avalanche rolls on: Norwegian Research Authority comes from a heavy reduced climate impact of CO2 "). As published in April 2013 in the Journal of Climate , a new study by Nicholas Lewis, who calculated a CO2 climate sensitivity due to the available data, which is only about half as large as currently assumed by the IPCC. According to Lewis, the temperature rises by only 1.1-2.2 ° C per doubling of CO2 (1.0-3.0 ° C taking into account other uncertainties).
In the same month, appeared in the journal Climate Dynamics , a new work by Troy Masters, the specific CO2 climate sensitivity based on the oceanic heat content. Masters compared the measured values ​​with the latest generation of climate models, such as those used in the nascent new IPCC climate report. It was found that the climate models respond much too sensitive to CO2. Masters identified a likely range of 1.5-2.9 ° C per doubling of CO2. These values ​​are also significantly lower than the current IPCC assumptions.
By the end of 2012 published by a research group from the University of Illinois to Michael Ring in the journal Atmospheric and Climate Sciences , a new study in which they examined the temperature data for the last 160 years using two independent methods, and from this they obtained CO2 climate sensitivity. Based on a spectral analysis and climate modeling, Ring and colleagues found a CO2 air effect that moves to the bottom edge of the previous IPCC assumptions, namely of 1.5-2.0 ° C per doubling of CO2. The pdf of this work is freely downloadable, as it has appeared on a free 'Open Access' journal.
In our book, "The cold sun", we present two climate scenarios based on climate sensitivities of 1.0 and 1.5 ° C per doubling of CO2. At the time of publication in February 2012, it has hailed from the German media landscape still plenty of criticism for these assumptions. How can you only deviate so much from the values ​​of the IPCC? Today, nearly one and a half years later that seems in the book presented 1.5 ° C climate sensitivity scenario to have arrived in the emerging mainstream of climate research. How times change ...
Below is a graphical representation of recent climate sensitivity provisions compared to the exaggerated IPCC assumptions (Source: Pat Michaels & Paul Knappenberger, WUWT ).
Note: In addition to the papers mentioned above, there are many others which indicate much lower climate sensitivities than claimed by the IPCC.