Showing posts sorted by relevance for query solar activity. Sort by date Show all posts

Sunday, July 27, 2014

New paper finds 'high correlation between solar activity and Earth's temperature over centuries'

A new paper published in the Chinese Science Bulletin finds "high correlation between solar activity and the Earth's averaged surface temperature over centuries." 

The paper is written in Chinese, but has an English abstract [below] and a press release which states, 

"results demonstrate that solar activity and the Earth’s temperature have significant resonance cycles, and the Earth’s temperature has periodic variations similar to those of the solar activity (Figure 1).     
The study also implies that the “modern maximum” of solar activity agrees well with the global warming of the Earth during the past century. A significant correlation between them can be found (Figure 2). Especially, the correlation between the solar activity and the ocean temperature is higher than the correlation between the solar activity and the land temperature. These results, as pointed out by a peer reviewer, “provide a possible explanation for the global warming”.  
The global wavelet coherence between Sunspot number (a), Total Solar Irradiance (b) and the anomalies of the Earth's averaged surface temperature. The resonant periodicities of 21.3-year (21.5-year), 52.3-year (61.6-year), and... Click here for more information. 
It is left to the reader to translate the paper from Chinese, but it appears from the abstract and press release to support other work demonstrating that cumulative solar activity explains much of the global warming of the 20th century, indeed over the past 400 years. 


Has solar activity influenced Earth's global warming?


A recent study demonstrates the existence of significant resonance cycles and high correlations between solar activity and the Earth's averaged surface temperature over centuries. This provides a new clue to reveal the phenomenon of global warming in recent years.

Their work, entitled "Periodicities of solar activity and the surface temperature variation of the Earth and their correlations" was published in CHINESE SCIENCE BULLETIN (In Chinese) 2014 No.14 with the co-corresponding authors of Dr. Zhao Xinhua and Dr. Feng Xueshang from State key laboratory of space weather, CSSAR/NSSC, Chinese Academy of Sciences. It adopts the wavelet analysis technique and cross correlation method to investigate the periodicities of solar activity and the Earth's temperature as well as their correlations during the past centuries.


Global warming is one of the hottest and most debatable issues at present. The Intergovernmental Panel on Climate Change (IPCC) claimed that the release of the anthropogenic greenhouse gases contributed to 90% or even higher of the observed increase in the global average temperature in the past 50 years. However, the debate on the causes of the global warming never stops. Research shows that the current warming does not exceed the natural fluctuations of climate. The climate models of IPCC seem to underestimate the impact of natural factors on the climate change, while overstate that of human activities. Solar activity is an important ingredient of natural driving forces of climate. Therefore, it is valuable to investigate the influence of solar variability on the Earth's climate change on long time scales.

This innovative study combines the measured data with those reconstructed to disclose the periodicities of solar activity during centuries and their correlations with the Earth's temperature. The obtained results demonstrate that solar activity and the Earth's temperature have significant resonance cycles, and the Earth's temperature has periodic variations similar to those of solar activity (Figure 1).

This study also implies that the "modern maximum" of solar activity agrees well with the recent global warming of the Earth. A significant correlation between them can be found (Figure 2).

As pointed out by a peer reviewer, "this work provides a possible explanation for the global warming".

###

See the article:

ZHAO X H, FENG X S. Periodicities of solar activity and the surface temperature variation of the Earth and their correlations (in Chinese). Chin Sci Bull (Chin Ver), 2014, 59: 1284, doi: 10.1360/972013-1089 http://csb.scichina.com:8080/kxtb/CN/abstract/abstract514043.shtml


High Correlations between Solar Activity and the Earth's Averaged Surface Temperature Proved by NSSC Scientists

Global warming, namely the unequivocal and continuing rise in Earth’s climate, is one of the hottest and most debatable issue at the present time. As a scientific intergovernmental and international body under the auspices of the United Nations (UN), the intergovernmental Panel on Climate Change (IPCC) once claimed that the release of the anthropogenic greenhouse gases contributed to as much as 90% or even higher of the observed increase in the global average temperature in the past 50 years. However, worldwide scientists are still skeptical and debate on the possible explanation of the global warming never ends. Research shows that the IPCC’s model tends to underestimate the impact of natural factors on the climate change, while overestimate that of the human activities.

As a matter of fact, solar activity is an important ingredient of natural driving forces of climate. A recent study done by space physicists at the State Key Laboratory of Space Weather, the National Space Science Center (NSSC) have demonstrated the high correlations between solar activity and the Earth’s averaged surface temperature during centuries. The result will to a large extend provide a new clue to reveal the cause of global warming in recent years.

Supported by NSSC’s “Five Key Cultivation Directions” Fund, Dr. ZHAO Xinhua and Dr. FENG Xueshang combined the measured data with those reconstructed to disclose the periodicities of solar activity during centuries and their correlations with the Earth’s temperature based on the wavelet analysis technique and cross correlation method. Their results demonstrate that solar activity and the Earth’s temperature have significant resonance cycles, and the Earth’s temperature has periodic variations similar to those of the solar activity (Figure 1). 


The study also implies that the “modern maximum” of solar activity agrees well with the global warming of the Earth during the past century. A significant correlation between them can be found (Figure 2). Especially, the correlation between the solar activity and the ocean temperature is higher than the correlation between the solar activity and the land temperature. These results, as pointed out by a peer reviewer, “provide a possible explanation for the global warming”.


Their work, entitled Periodicities of solar activity and the surface temperature variation of the Earth and their correlations was published on CHINESE SCIENCE BULLETIN (In Chinese) 2014 No.14. It was reported by the global source for science news, EurekAlert!, both in Chinese and in English entitled Has solar activity influence on the Earth's global warming? on June 3 and June 4, 2014, respectively.


Figure 1: The global wavelet coherence between Sunspot number (a), Total Solar Irradiance (b) and the anomalies of the Earth’s averaged surface temperature. The resonant periodicities of 21.3-year (21.5-year), 52.3-year (61.6-year), and 81.6-year are close to the 22-year, 50-year, and 100-year cycles of solar activity. (Image by NSSC)
  Figure 2: Comparisons between the 11-year running averaged Total Solar Irradiance (TSI) and the temperature (T) anomalies of the Earth (global, land, ocean). (Image by NSSC)

Periodicities of solar activity and the surface temperature variation of the Earth and their correlations

ZHAO XinHua*, FENG XueShang* 


State Key Laboratory of Space Weather, Center for Space Science and Applied Research, Chinese Academy of Sciences, Beijing 100190, China

Abstract:

Based on the well-calibrated systematiCmeasurements of sunspot numbers, the reconstructed data of the total solar irradiance (TSI), and the observed anomalies of the Earth’s averaged surface temperature (global, ocean, land), this paper investigates the periodicities of both solar activity and the Earth’s temperature variation as well as their correlations on the time scale of centuries using the wavelet and cross correlation analysis techniques. The main results are as follows. (1) Solar activities (including sunspot number and TSI) have four major periodic components higher than the 95% significance level of white noise during the period of interest, i.e. 11-year period, 50-year period, 100-year period, and 200-year period. The global temperature anomalies of the Earth have only one major periodic component of 64.3-year period, which is close to the 50-year cycle of solar activity. (2) Significant resonant periodicities between solar activity and the Earth’s temperature are focused on the 22- and 50-year period. (3) Correlations between solar activity and the surface temperature of the Earth on the long time scales are higher than those on the short time scales. As far as the sunspot number is concerned, its correlation coefficients to the Earth temperature are 0.31-0.35 on the yearly scale, 0.58-0.70 on the 11-year running mean scale, and 0.64-0.78 on the 22-year running mean scale. TSI has stronger correlations to the Earth temperature than sunspot number. (4) During the past 100 years, solar activities display a clear increasing tendency that corresponds to the global warming of the Earth (including land and ocean) very well. Particularly, the ocean temperature has a slightly higher correlation to solar activity than the land temperature. All these demonstrate that solar activity has a non-negligible forcing on the temperature change of the Earth on the time scale of centuries.

Full paper [in Chinese] available here 

Wednesday, December 18, 2013

Paper finds solar activity explains climate change over past 200,000 years

A paper published in Earth and Planetary Science Letters finds solar activity was strongly correlated to climate change over the past 200,000 years. The paper reconstructs solar geomagnetic field strength using the 10Be isotope proxy of cosmic rays, which is inversely related to solar activity. The reconstruction in Figure 2 shows solar activity at the end of the record ["near present day"] was at some of the highest levels of the past 200,000 years, and solar geomagnetic field intensity approximately 3 times higher than during the ice age ~180,000 years ago.
Figure 4 below shows the strong correlation between solar activity [grey and black] and the climate change proxy [d18O in red] over the past 200,000 years. According to the author, "The marine δ18O [temperature proxy] record and solar modulation are strongly correlated at the 100,000 year timescale. It is proposed that variations in solar activity control the 100,000 year glacial–interglacial cycles." 

Thus, the paper appears to solve the mystery of what causes ice ages and glacial-interglacial cycles, which has remained unsolved due to the so-called 100,000 year problem of using Milankovitch Cycles to explain ice ages. That is, ice ages and glacial-interglacial cycles are primarily caused by changes in solar activity rather than solar insolation changes on the Northern and Southern Hemispheres as described by Milankovitch Cycles.

According to the author, 
"the geomagnetic field intensity appears to have varied by a factor of three over the last 200,000 years, with three excursions when the intensity became less than half the present value."  
"there are strong correlations between solar surface magnetic activity and climate at different timescales, which range from days through centuries. Whereas these observations have pointed to a causal relationship between solar activity and climate change, the details of of physical mechanism(s) still need to be worked out. It has been generally believed that the variations in solar magnetic activity lead to changes in total or ultraviolet irradiance of the Sun through the disc passage and evolution of sunspots and faculae, which, in turn, affects climate. Another posited mechanism through which solar activity could directly affect climate is via modulation of GCRs [Galactic Cosmic Rays], which induces cloud formation by inducing changes in the tropospheric ion production [Svensmark's theory]. If the changes in cosmic ray flux cause cloud cover variations, one would expect an inverse relationship between solar modulation and surface temperature, assuming that the proportion of low and high clouds remains constant. This is consistent with the observations in Figure 4 [below], although variations in irradiance could also affect climate by e.g. affecting ozone cover."
"In summary, it is evident that while there are strong correlations between solar activity and climate at different timescales, more work is needed towards finding mechanisms that change solar activity in the first place, and that explain the physical link between solar magnetism and climate." "The long term solar activity and the Earth's surface temperature appear to be directly related. The variations in solar activity may control the 100,000 year glacial-interglacial cycles providing a more tangible astronomical forcing than the estimated changes in solar insolation [Milankovitch Cycles] or cosmic dust accretion rates." 

Horizontal axis is thousands of years before the present. Solar geomagnetic activity is inversely related to galactic cosmic rays at Earth's surface, and thus inversely related to the cosmogenic isotope 10Be production.
Figure 4 shows the strong correlation between solar activity [grey and black] and the climate change proxy [d18O in red] over the past 200,000 years. According to the author, "The marine δ18O [temperature proxy] record and solar modulation are strongly correlated at the 100,000 year timescale. It is proposed that variations in solar activity control the 100,000 year glacial–interglacial cycles." 

Variations in solar magnetic activity during the last 200 000 years: is there a Sun–climate connection?

Mukul SharmaCorresponding author contact information, E-mail the corresponding author

  • Department of Earth Sciences, Dartmouth College, Hanover, NH 03755, USA

Abstract

The production of 10Be in the Earth’s atmosphere depends on the galactic cosmic ray influx that, in turn, is affected by the solar surface magnetic activity and the geomagnetic dipole strength. Using the estimated changes in 10Be production rate and the geomagnetic field intensity, variations in solar activity are calculated for the last 200 ka. Large variations in the solar activity are evident with the Sun experiencing periods of normal, enhanced and suppressed activity. The marine δ18O [temperature proxy] record and solar modulation are strongly correlated at the 100 ka timescale. It is proposed that variations in solar activity control the 100 ka glacial–interglacial cycles. However, the 10Be production rate variations may have been under-estimated during the interval between 115 ka and 125 ka and may have biased the results. Future tests of the hypothesis are discussed.

Excerpts:


Posted 06/06/02
Thanks to new calculations by a Dartmouth geochemist, scientists are now looking at the earth's climate history in a new light.
Mukul Sharma, Assistant Professor of Earth Sciences at Dartmouth, examined existing sets of geophysical data and noticed something remarkable: the sun's magnetic activity is varying in 100,000-year cycles, a much longer time span than previously thought, and this solar activity, in turn, may likely cause the 100,000-year climate cycles on earth. This research helps scientists understand past climate trends and prepare for future ones.
Published in the June 10 issue of Earth and Planetary Science Letters (Elsevier, volume 199, issues 3-4), Sharma's study combined data on the varying production rates of beryllium 10, an isotope found on earth produced when high-energy galactic cosmic rays bombard our atmosphere, and data on the past variations in the earth's magnetic field intensity. With this information, Sharma calculated variations in solar magnetic activity going back 200,000 years, and he noticed a pattern.
Over the last 1 million years, the earth's climate record has revealed a 100,000-year cycle oscillating between relatively cold and warm conditions, and Sharma's data on the sun's magnetic activity corresponded to the earth's ice age history.
"Surprisingly, it looks like solar activity is varying in longer time spans than we realized," says Sharma. "We knew about the shorter cycles of solar activity, so maybe these are just little cycles within a larger cycle. Even more surprising is the fact that the glacial and interglacial periods on earth during the last 200,000 years appear to be strongly linked to solar activity."
Sharma's calculations suggest that when the sun is magnetically more active, the earth experiences a warmer climate, and vice versa, when the sun is magnetically less active, there is a glacial period. Right now, the earth is in an interglacial period (in between ice ages) that began about 11,000 years ago, and as expected, this is also a time when the estimated solar activity appears to be high.
Beryllium 10 is useful for studying the geology from hundreds of thousands of years ago mainly because it has a half-life of about one and a half million years. In addition, there are two key factors that have affected beryllium 10 production over the last 200,000 years: the earth's magnetic field and the sun's magnetic activity. When there are high-intensity solar magnetic storms, more charged particles are interacting with cosmic rays, and less beryllium 10 is produced. Likewise, the earth's magnetic field changes the flux of cosmic rays into and out of the atmosphere.
Since the production rate of beryllium 10 and earth's magnetic field intensity are known for the last 200,000 years, Sharma could calculate solar magnetic activity for this time period.
"I took sets of existing, independent data and made new comparisons and calculations," says Sharma. Then he went a step further to make a connection with the history of ice ages by looking at oxygen isotopes in the oceans, which reveal the history of how much ice was at the poles and are therefore a measure of average global surface temperature.
"I compared the estimated past variations in the solar activity with those of the oxygen isotopes in the ocean. Although there is a strong relationship between solar activity and oxygen isotopic variations, it is too early to say exactly what is the mechanism though which the sun is influencing the terrestrial climate."
One explanation of the 100,000-year cycle was offered by the Milankovitch Theory of Ice Ages in the 1940s, which suggested that the cyclical variations in the earth's orbit around the sun result in the earth receiving varying amounts of solar radiation that, in turn, control the climate. This explanation is under dispute because the variations of the solar energy in relation to the changes in orbit are very small. Other current research focuses on past variations in the sun's irradiance, or heat intensity (as opposed to the magnetic activity).
Sharma notes that more analysis is needed to test his theory. "I've only looked at 200,000 years. My calculations need to be verified for a million years, for instance. Plus, regarding the current global warming debate, it still needs to be examined if the role of solar activity will exacerbate the rising temperatures that result from carbon dioxide buildup in the atmosphere."
This work was supported by Dartmouth College, the Max Planck Institute and by a grant from the National Science Foundation.

Related: 

New paper finds ice ages explained even with constant levels of CO2

Saturday, April 5, 2014

Studies find El Ninos can be predicted from solar activity

A recent paper concludes that the El Nino Southern Oscillation [ENSO] "may be entirely unpredictable" using climate models, and another finds that the failure of climate models to predict drought and climate is due to the inability to model El Ninos. The "pause" of global warming that climate models did not predict has also been attributed to the inability to model ENSO, which has profound influence on global climate. 


Climate models are unable to reproduce El Ninos [ENSO]. Source

However, other research has found a remarkable correlation between the 11-year solar cycle and the onset of El Ninos about 11 months following a solar geomagnetic maximum. Raimund Leistenschneider from the German EIKE site describes his work below, as well as a similar published paper in PNAS which finds all El Ninos of the past 140 years have been correlated to increases in solar geomagnetic activity. Both Leistenschneider and the authors of the PNAS paper predict on the basis of current solar activity an El Nino will occur in late 2014 and peak in January 2015. Stay tuned, the warmists are hoping an El Nino late this year will save their cause from the embarrassing "pause" of global warming over the past 18 years, but El Ninos are likely just a manifestation of solar activity and albedo, not AGW.

Also of interest below is Fig 17 which shows a remarkable step increase of solar geomagnetic activity [aa index] over the 20th century to the solar grand maximum of the late 20th century. 

Figure from part 1 showing the correlation between global temperature and El Ninos.


Google's (lousy) translation from the German EIKE site:


The sun brings light into the dark - What really determines the earth temperature, part 2

Raimund Leistenschneider


Part 2: 2014, an El Nino-year - El Niño and its solar-timer over the last 1,000 years (?)
In the second Part be the part in one compared with the data of the last 140 years, and thus shown that there are the found relations and correlations for this period. In addition, an El Niño data comparison is made ​​for the past 1,000 years with the main solar cycle. It is shown that each time an El Niño takes place when the main solar cycle activity begins (after its minimum activity) to rise again. Based on the theory of the author is then argued that the end of 2014 an El Niño will be present, which will reach its maximum at the beginning of 2015 (the most characteristic).
On the basis of figure 15 the car would show the last 60 years. To what extent the correlations found are also valid for this period. It has to be resorted to reconstructed values.
 
Fig.15: All El Ni no-events are also directly related "their" solar parameter. A solar parameters (1955) stands at the reconstructed values ​​not with an El Niño relationship.
Intermediate Result: Out of 19 events all fall together with a solar maximum. The reconstructed values ​​triggers a solar event (1955) El Ni no ñ from o.
Can be beyond the established theory of the author substantiate the basis of data rows? To this end, we look at the period of El Niño events and the solar parameters that trigger him to the 1870 years of. However, it is here, as in Figure 15, not measured, but reconstructed values, which do not possess the accuracy and the degree, as measured events.
 
Fig.16 shows the connections to the mid-1870's. All El Niño events to the event in 1900, can be assigned to a solar activity event. With two solar events of the El Ni remains ñ o from. The author has used in its investigation the same solar parameters. However, these are not measured, but reconstructed. The time series at the bottom shows the TSI, source: NASA. NASA writes about this on its website that the TSI was developed from a separate, physical model and the mapping from the University of Montreal dates. The time series also shows the total flux, source: " A doubling of the Sun's Coronal Magnetic Field falling on the Last 100 Years ", M. Lockwood, R. Stamper, and MN Wild, Nature Vol 399, June 3 1999.
The El Niño of 1900 really any solar event assign?
Fig.17 is derived from the work of v on Russell and T. Mulligan (Institute of Geophysics and Planetary Physics, University of California) "The 22-year Variation of Geomagnetic Activity: Implications for the Polar Magnetic Field of the Sun", Geophysical Research Letters , 22, 3287-3288, 1995. 
Fig.17 shows the geomagnetic aa-index from 1850 to 1990. In 1900, the magnetic activity of the sun begins to rise again (green trend line) and reaches the end of the 20th Century its peak. Here, the aa-index increases by 100% (blue horizontal lines), which allows conclusions to the sharp increase in solar activity. The increase is synchronous to the main solar cycle, the on average 208-year de Vries / Suess cycle. He reduced while the cosmic rays in the same period by approximately 15%.
This work is to be compared with another, which is also the main course of the solar cycle, the on average 208-year de Vries / Suess cycle shows (Fig. 18).
 
Fig.18 shows natural fluctuations in ocean currents in the North Atlantic and thus to the Gulf Stream, Source: Dr. Axel Mörner, "No danger of a global sea level rise." The picture has been supplemented by the author to the de Vries / Suess solar cycle (periods). You can see the Arctic ice development in conjunction with the prevailing ocean currents in relation to the main solar cycle (de Vries-Suess cycle). Both the Arctic ice cover, as well as the pattern of ocean currents in the Middle follows the 208-year de Vries-Suess cycle. In Sonnenminima experience northwestern Europe, the North Atlantic and the Arctic cold phases. The figure also shows that for the next 30 - 40 years of an Arctic ice extent and no ice melting is expected.
Fig.18 shows that the main solar cycle end of the 1890 years reached its minimum and the solar activity increases again in the main solar cycle in 1900, that an El Ni ñ o could have triggered. Have solar regularities that occur on small scales, even on large scales to be valid?
From the Schwabe cycle is known ( Friis-Christensen, E. & Lassen, K.: Length of the solar cycle. indicator of solar activity on Closely associated with climate Science 254 (1991) 698 ) that the longer is its cycle , the weaker the solar activity in the same cycle. This correlation on small scales can also be observed on large scales. Also in the main solar cycle and its harmonics, the Hallstatt cycle, the cycle duration is analogous to the solar activity, ie the weaker the Hallstatt cycle, the longer its cycle time.
The sun shines at Raising an El Niño event also here to behave on large scales the same as on small scales. The author has shown that for every increase of solar activity in the Schwabe cycle, an El Niño event is raised. This seems to be the same on large scales. Increasing solar activity in the main solar cycle, triggers (the El Niño 1900) El Niño from. Nor correlation can not be made ​​the basis of an event, therefore, the thesis should be analyzed further. Fig.18 shows an overview of historical El Niño events.
 
Fig.19 shows a collection of historical El Ni ñ o / La Ni ñ a-events over the last 1000 years, source: http://nexialinstitute.com/climate_el_nino.htm
According to the work of Professor Mörner (Fig. 18) of the main solar cycle had about 1670 and 1465 its minimum and then turned in his activity.
 
Fig.20 shows the C14-proxy, which is a measure of solar activity over the last 1100 years, Source: United States Geological Survey . The author has to the minima (blue lines) plotted at which the course is reversed, ie the solar activity increases again. The minima are identical to the minima of solar activity and how the cycle time can easily recognize, represent the main solar cycle. The minima are at about 1078, 1338, 1538 and 1718.
Now, this data is compared with the list in Fig.19 (Fig.21).
 
Fig.21: Both the change in solar activity from the work of Prof. Mörner (Fig. 18, the 1670 and 1465), as well as the change in the activity of Fig.19 ( United States Geological Survey , the 1718 , 1538, 1338 and 1077) fall exactly together with an El Niño event.
From this it can be concluded confirm that to the already found three solar parameters that trigger an El Niño, a fourth parameter is:
4 For each activity change in the main solar cycle, the on average 208-year de Vries / Suess cycle is an El Niño triggered when the solar activity has passed its minimum in the main solar cycle and rises again.
Result of the investigation is to be noted that all 40 El Niño events are triggered by a solar parameters during the period of the last 140 years. When solar activity remain with the reconstructed values ​​of two El Niño. During the period of the measured values ​​is not a solar event to have caused "his" El Niño without. The El Niño occurs in an exact time window after the solar activity increase / solar maximum. Just 11 months after that.
For these reasons, the author assumes that at the end 2014/Anfang 2015 set an El Niño event and for the reason that the sun right now its magnetic maximum in 24 Schwabe cycle has (Fig.22). Each measured magn. Maximum triggered "his" El Niño during the investigation period. The fact that the physicist Armin Bunde and Joseph Ludescher of the University of Giessen based on their study (published in the U.S. journal "Proceedings of the National Academy of Sciences") independently to get the same result, of course, pleased the author. In this case, write the physicist "Now we announce that our method could detect the recurrence of El Niño in late 2014 in September 2013." The author has already announced in January 2011, when and how El Niños occur. He was not just "know", but has clearly made the statement.
While the Giessen physicist specify "the probability of an El Niño still occurs this year, lies at 76 percent," was able to show that all El Niño have been triggered in the past 140 years by "their" solar parameters of the author. This is a success rate of 100%. If the two solar events that caused no El Niño, involved, so the probability is 96%. The extent to which both fractions to be right, it will show the end of 2014.
 
Fig.22 shows the current 24 Schwabe cycle, source: http://www.solarham.net/ The magnetic maximum is in 02 / 14th Is the basis of the investigations of the author, therefore, 11 months later, in 01/15, the El Niño be fully developed and reach its maximum.
Raimund Leistenschneider - EIKE


Related: Dr. Roy Spencer:  ENSO and PDO Explain Tropical Average SSTs during 1950-2013

Tuesday, January 29, 2013

New paper shows 20th century solar activity was at highest levels of past 9,400 years

A new paper published in Astronomy & Astrophysics finds that solar activity may be influenced by gravitational torque from the orbital configuration of the planets. In addition, the authors show that solar activity during the 20th century was at the highest levels of the past 9,400 years.
Top graph shows solar activity in the 20th century was at the highest levels of the past 9,400 years. Time in years before the present shown on horizontal axis.
A&A 548, A88 (2012)

Is there a planetary influence on solar activity?

J. A. Abreu1,2, J. Beer2, A. Ferriz-Mas3,4, K. G. McCracken5 and F. Steinhilber2
1 ETH Zürich Institut für Geophysik, 8092 Zürich, Switzerland
e-mail: jose.abreu@erdw.ethz.ch
2 Eawag, Swiss Federal Institute of Aquatic Science and Technology, Postfach 611, 8600 Dübendorf, Switzerland
3 Departamento the Física Aplicada, Universidade de Vigo, Spain
4 Instituto de Astrofísica de Andalucía (IAA/CSIC), Granada, Spain
5 University of Maryland, USA 
Received: 12 July 2012
Accepted: 24 September 2012
Abstract
Context. Understanding the Sun’s magnetic activity is important because of its impact on the Earth’s environment. Direct observations of the sunspots since 1610 reveal an irregular activity cycle with an average period of about 11 years, which is modulated on longer timescales. Proxies of solar activity such as 14C and 10Be show consistently longer cycles with well-defined periodicities and varying amplitudes. Current models of solar activity assume that the origin and modulation of solar activity lie within the Sun itself; however, correlations between direct solar activity indices and planetary configurations have been reported on many occasions. Since no successful physical mechanism was suggested to explain these correlations, the possible link between planetary motion and solar activity has been largely ignored.
Aims. While energy considerations clearly show that the planets cannot be the direct cause of the solar activity, it remains an open question whether the planets can perturb the operation of the solar dynamo. Here we use a 9400 year solar activity reconstruction derived from cosmogenic radionuclides to test this hypothesis.
Methods. We developed a simple physical model for describing the time-dependent torque exerted by the planets on a non-spherical tachocline and compared the corresponding power spectrum with that of the reconstructed solar activity record.
Results. We find an excellent agreement between the long-term cycles in proxies of solar activity and the periodicities in the planetary torque and also that some periodicities remain phase-locked over 9400 years.
Conclusions. Based on these observations we put forward the idea that the long-term solar magnetic activity is modulated by planetary effects. If correct, our hypothesis has important implications for solar physics and the solar-terrestrial connection.

Wednesday, August 6, 2014

New paper finds recent Grand Maximum of solar activity was 'rare or even unique event' in 3,000 years

Move on, nothing to see here. According to IPCC climate experts, the modern Grand Maximum of solar activity from 1950-2009 had nothing to do with the 0.4C global warming over that timeframe, it was entirely caused by man-made CO2.

from CO2 Science:

A 3,000-Year Record of Solar Activity

Reference
Usoskin, I.G., Hulot, G., Gallet, Y., Roth, R., Licht, A., Joos, F., Kovaltsov, G.A., Thebault, E. and Khokhlov, A. 2014. Evidence for distinct modes of solar activity. Astronomy and Astrophysics 562: L10, doi: 10.1051/0004-6361/201423391.


What was done

According to Usoskin et al. (2014), the Sun "shows strong variability in its magnetic activity, from Grand minima to Grand maxima, but the nature of the variability is not fully understood, mostly because of the insufficient length of the directly observed solar activity records and of uncertainties related to long-term reconstructions." Now, however, in an attempt to overcome such uncertainties, in a Letter to the Editor published in the journal Astronomy and Astrophysics, Usoskin et al. "present the first fully adjustment-free physical reconstruction of solar activity" covering the past 3,000 years, which record allowed them "to study different modes of solar activity at an unprecedented level of detail."


What was learned

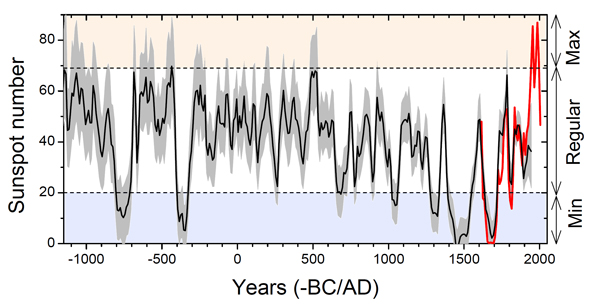
As illustrated in the figure below, the authors report there is "remarkable agreement" among the overlapping years of their reconstruction (solid black line) and the number of sunspots recorded from direct observations since 1610 (red line). Their reconstruction of solar activity also displays several "distinct features," including several "well-defined Grand minima of solar activity, ca. 770 BC, 350 BC, 680 AD, 1050 AD, 1310 AD, 1470 AD, and 1680 AD," as well as "the modern Grand maximum (which occurred during solar cycles 19-23, i.e., 1950-2009)," which they describe as "a rare or even unique event, in both magnitude and duration, in the past three millennia."


Figure 1. Reconstructed decadal average of sunspot numbers for the period 1150 BC-1950 AD (black line). The 95% confidence interval is shown by the gray shading and directly measured sunspot numbers are shown in red. The horizontal dashed lines demark the bounds of the three suggested modes (Grand Minimum, Regular, and Grand Maximum) as defined by Usoskin et al.


Further statistical analysis of their reconstruction revealed the Sun operates in three distinct modes of activity - (1) a regular mode that "corresponds to moderate activity that varies in a relatively narrow band between sunspot numbers 20 and 67," (2) a Grand minimum mode of reduced solar activity that "cannot be explained by random fluctuations of the regular mode" and which "is confirmed at a high confidence level," and (3), a possible Grand maximum mode, but they say that "the low statistic does not allow us to firmly conclude on this, yet."

What it means

Usoskin et al. (2014) write their results "provide important constraints for both dynamo models of Sun-like stars and investigations of possible solar influence on Earth's climate." They also illustrate the importance of improving the quality of such reconstructions, in light of the fact that previous reconstructions of this nature "did not reveal any clear signature of distinct modes" in solar activity.


Unfortunately, it was beyond the scope of this paper to address the potential impact of solar activity on climate. Yet the reconstruction leaves a very big question unanswered -- What effect did the Grand maximum of solar activity that occurred between 1950 and 2009 have on Earth's climate? As a "unique" and "rare" event in terms of both magnitude and duration, one would think a lot more time and effort would be spent by the IPCC and others in answering that question. Instead, IPCC scientists have conducted relatively few studies of the Sun's influence on modern warming, assuming that the temperature influence of this rare and unique Grand maximum of solar activity, which has occurred only once in the past 3,000 years, is far inferior to the radiative power provided by the rising CO2 concentration of the Earth's atmosphere.

Related:

The Sun explains 95% of climate change over the past 400 years; CO2 had no significant influence

Wednesday, September 7, 2016

New paper finds climate change & CO2 levels explained as a function of lagged solar activity

A new paper under open review for Earth System Dynamics finds Holocene climate change can be explained on the basis of lagged responses to changes of solar activity. According to the author,
This paper analyzes the lagged responses of the Earth’s climate system, as part of cosmic-solar-terrestrial processes. Firstly, we analyze and model the lagged responses of the Earth’s climate system, previously detected for geological and orbital scale processes, with simple non-linear functions, and we estimate a correspondent lag of ~1600-yr for the recently detected ~9500-yr scale solar recurrent patterns. Secondly, a recurrent and lagged linear influence of solar variation on volcanic activity and carbon dioxide (CO2) has been assessed for the last millennia, and extrapolated for future centuries and millennia. As a consequence we found that, on one side, the recent CO2 increase can be considered as a lagged response to solar activity, and, on the other side, the continental tropical climate signal during late Holocene can be considered as a sum of three lagged responses to solar activity, through direct, and indirect (volcanic and CO2), influences with different lags of around 40, 800 and 1600 years. 
Note the ~1600 year lag of response to solar activity is essentially the same as the well-known ~1500 year "never-ending climate cycle" identified by numerous peer-reviewed, published papers.

Note also the paper explains CO2 levels on the basis of a lagged function of solar activity, due to variations in solar heating of the oceans, and ocean in-gassing and out-gassing of CO2, not as a result of the ~4% CO2 contribution from mankind. 

The paper shows the (noisy) 1600-year climate cycle in the ice core 10Be proxy of solar activity of the past 1800 years peaked in the 1900's. The orange lines are modeled on the basis of a function of three lagged compenents of solar activity cycles and is currently on a downswing until ~2100, indicating potentially cooler Earth temperatures ahead. 


According to the author, "we propose the global ocean circulation processes, that include the well known meridional overturning circulation, and the thermohaline circulation, as a global mechanism capable of explaining the lagged forcing (volcanic activity & CO2) and continental tropical climate responses to solar activity variations."


The Earth’s climate system recurrent & multi-scale lagged responses: empirical law, evidence, consequent solar explanation of recent CO2 increases & preliminary analysis


Jorge Sánchez-Sesma

Received: 18 Aug 2016 – Accepted: 31 Aug 2016 – Published: 07 Sep 2016

Abstract. This paper analyzes the lagged responses of the Earth’s climate system, as part of cosmic-solar-terrestrial processes. Firstly, we analyze and model the lagged responses of the Earth’s climate system, previously detected for geological and orbital scale processes, with simple non-linear functions, and we estimate a correspondent lag of ~1600-yr for the recently detected ~9500-yr scale solar recurrent patterns. Secondly, a recurrent and lagged linear influence of solar variation on volcanic activity and carbon dioxide (CO2) has been assessed for the last millennia, and extrapolated for future centuries and millennia. As a consequence we found that, on one side, the recent CO2 increase can be considered as a lagged response to solar activity, and, on the other side, the continental tropical climate signal during late Holocene can be considered as a sum of three lagged responses to solar activity, through direct, and indirect (volcanic and CO2), influences with different lags of around 40, 800 and 1600 years. Thirdly, we find more examples of this ~1600-yr lag, associated with oceanic processes throughout the Holocene, manifested in the mineral content of SE Pacific waters, and in a carbon cycle index, CO3, in the Southern Atlantic. Fourthly, we propose the global ocean circulation processes, that include the well known meridional overturning circulation, and the thermohaline circulation, as a global mechanism capable of explaining the lagged forcing (volcanic activity & CO2) and continental tropical climate responses to solar activity variations. Finally, some conclusions are provided for the lagged responses of the Earth's climate system with their influences and consequences on present and future climate, and implications for climate modelling are preliminarily analyzed.