Showing posts sorted by relevance for query solar amplification. Sort by date Show all posts

Monday, August 18, 2014

New paper finds the Sun controls Greenland climate

An important paper published today in Nature Geoscience finds a persistent link between solar activity and Greenland climate during the last ice age, and finds the link is similar to modern solar forcing of regional climate. 

According to the authors, 
"We suggest that solar minima could have induced changes in the stratosphere that favour the development of high-pressure blocking systems located to the south of Greenland, as has been found in observations and model simulations for recent climate. We conclude that the mechanism behind solar forcing of regional climate change may have been similar under both modern and Last Glacial Maximum climate conditions."
The authors describe a solar amplification mechanism by which solar minima favor the development of high-pressure blocking systems which block the jet stream and cause increased jet stream dips of the polar vortex [just like we have seen over the past few record cold winters in the US and Europe]. Many other papers have described this solar amplification mechanism via solar effects on the stratosphere, which in turn affect the QBO, which in turn affects large scale planetary waves such as Rossby Waves and the jet stream. This is only one of many solar amplification mechanisms described in the scientific literature. 

The authors also provide a new reconstruction of solar activity using the cosmogenic isotope 10Be, which shows a remarkable correlation over relatively short time-scales to ice core temperatures and precipitation: 

d18O [mean of 2 ice cores shown as blue line] is a proxy of temperature and precipitation. 10Be [orange line] is a proxy of solar activity [note 10Be is inversely correlated to solar activity]
Note 10Be concentration at end of 20th century was ~0.6, much less than mean of ~1 from first chart above, indicating solar activity was much greater at end of 20th century than during the last glacial maximum. 

Excerpt explaining the solar amplification mechanism

Climate alarmists such as Jennifer Francis and Heidi Cullen claim man-made CO2 from your SUV is the control knob of Greenland climate, and that increased CO2 causes jet stream dips and record cold weather. However, this new paper and many others provide a much more plausible explanation: it's the Sun. 


Persistent link between solar activity and Greenland climate during the Last Glacial Maximum

Nature Geoscience
 
 
doi:10.1038/ngeo2225
Received
 
Accepted
 
Published online
 
Changes in solar activity have previously been proposed to cause decadal- to millennial-scale fluctuations in both the modern and Holocene climates1. Direct observational records of solar activity, such as sunspot numbers, exist for only the past few hundred years, so solar variability for earlier periods is typically reconstructed from measurements of cosmogenic radionuclides such as10Be and 14C from ice cores and tree rings23. Here we present a high-resolution 10Be record from the ice core collected from central Greenland by the Greenland Ice Core Project (GRIP). The record spans from 22,500 to 10,000 years ago, and is based on new and compiled data456. Using 14C records78 to control for climate-related influences on 10Be deposition, we reconstruct centennial changes in solar activity. We find that during the Last Glacial Maximum, solar minima correlate with more negative δ18O values of ice and are accompanied by increased snow accumulation and sea-salt input over central Greenland. We suggest that solar minima could have induced changes in the stratosphere that favour the development of high-pressure blocking systems located to the south of Greenland, as has been found in observations and model simulations for recent climate910. We conclude that the mechanism behind solar forcing of regional climate change may have been similar under both modern and Last Glacial Maximum climate conditions.


Related: 


What is the Planetary Theory about? Why all the Fuss?

Monday, August 11, 2014

New paper finds multiple solar amplification mechanisms which modulate winter surface temperatures

A paper published today in the Journal of Geophysical Research Atmospheres finds "significant differences in the temperature patterns" of the Northern Hemisphere winter dependent upon the "four [phases of the solar cycle], which indicates a solar cycle modulation of winter surface temperatures." Thus, the paper describes 4 potential solar amplification mechanisms in relation to 4 phases of each solar cycle, and possibly a fifth related to solar modulation of the North Atlantic Oscillation [NAO] as has been found by prior papers. 

According to the authors,

"Several recent studies have found variability in the Northern Hemisphere winter climate related to different parameters of solar activity. While these results consistently indicate some kind of solar modulation of tropospheric and stratospheric circulation and surface temperature, opinions on the exact mechanism and the solar driver differ. Proposed drivers include, e.g., total solar irradiance (TSI), solar UV radiation, galactic cosmic rays and magnetospheric energetic particles. 
While some of these drivers are difficult to distinguish because of their closely similar variation over the solar cycle, other suggested drivers have clear differences in their solar cycle evolution. For example, geomagnetic activity and magnetospheric particle fluxes peak in the declining phase of the sunspot cycle, in difference to TSI and UV radiation which more closely follow sunspots. Using 13 solar cycles (1869–2009) we study winter surface temperatures and North Atlantic oscillation (NAO) during four different phases of the sunspot cycle: minimum, ascending, maximum and declining phase. 
We find significant differences in the temperature patterns between the four cycle phases, which indicates a solar cycle modulation of winter surface temperatures. However, the clearest pattern of the temperature anomalies is not found during sunspot maximum or minimum, but during the declining phase, when the temperature pattern closely resembles the pattern found during positive NAO. Moreover, we find the same pattern during the low sunspot activity cycles of 100 years ago, suggesting that the pattern is largely independent of the overall level of solar activity."
The authors find this "pattern [similar to the positive NAO] is largely independent of the overall level of solar activity," therefore climate scientists trying to correlate Total Solar Irradiance [TSI], which is considered by many in climate science to represent "the overall level of solar activity," will not see such patterns or even look for them or simulate them with climate models. 

By solely focusing on TSI and ignoring e.g. large changes solar UV of up to 100% over a single solar cycle, geomagnetic changes, ignoring all potential solar amplification mechanisms, climate models dismiss the role of the Sun in climate change. 


Spatial distribution of Northern Hemisphere winter temperatures during different phases of the solar cycle

V. Maliniemi*, T. Asikainen and K. Mursula

Several recent studies have found variability in the Northern Hemisphere winter climate related to different parameters of solar activity. While these results consistently indicate some kind of solar modulation of tropospheric and stratospheric circulation and surface temperature, opinions on the exact mechanism and the solar driver differ. Proposed drivers include, e.g., total solar irradiance (TSI), solar UV radiation, galactic cosmic rays and magnetospheric energetic particles. While some of these drivers are difficult to distinguish because of their closely similar variation over the solar cycle, other suggested drivers have clear differences in their solar cycle evolution. For example, geomagnetic activity and magnetospheric particle fluxes peak in the declining phase of the sunspot cycle, in difference to TSI and UV radiation which more closely follow sunspots. Using 13 solar cycles (1869–2009) we study winter surface temperatures and North Atlantic oscillation (NAO) during four different phases of the sunspot cycle: minimum, ascending, maximum and declining phase. We find significant differences in the temperature patterns between the four cycle phases, which indicates a solar cycle modulation of winter surface temperatures. However, the clearest pattern of the temperature anomalies is not found during sunspot maximum or minimum, but during the declining phase, when the temperature pattern closely resembles the pattern found during positive NAO. Moreover, we find the same pattern during the low sunspot activity cycles of 100 years ago, suggesting that the pattern is largely independent of the overall level of solar activity.

Friday, May 22, 2015

New paper finds another solar amplification mechanism by which the Sun controls climate

A paper published today in Environmental Research Letters finds another potential solar amplification mechanism by which changes in solar UV activity over 11-year solar cycles are amplified to large-scale effects upon climate via modulations of the North Atlantic Oscillation [NAO]. 

The authors model a mechanism whereby large changes (up to 100%in solar UV over solar cycles affect heating rates of the upper stratosphere, which in turn affect winds and temperature gradients in the troposphere, and heat storage in North Atlantic Ocean. This results in a lagged effect of 3-4 years in the amplitude of the North Atlantic Oscillation, which in turn affects Arctic sea ice extent, other ocean oscillations, the jet stream, and weather patterns around the globe. The paper corroborates several others demonstrating solar influence upon the NAO, as well as other ocean oscillations. 

According to the authors,
Numerous studies have suggested an impact of the 11 year solar cycle on the winter North Atlantic Oscillation (NAO), with an increased tendency for positive [NAO signals to occur at maxima of the solar cycle, and negative NAO signals to occur at minima of the solar cycle]. Climate models have successfully reproduced this solar cycle modulation of the NAO, although the magnitude of the effect is often considerably weaker than implied by observations.  
A leading candidate for the mechanism of solar influence is via the impact of ultraviolet radiation variability on heating rates in the tropical upper stratosphere, and consequently on the meridional temperature gradient and zonal winds...On reaching the troposphere this produces a response similar to the winter NAO. Recent analyses of observations have shown that solar cycle–NAO link becomes clearer approximately three years after solar maximum and minimum. Previous modelling studies have been unable to reproduce a lagged response of the observed magnitude. 
In this study, the impact of solar cycle on the NAO is investigated using an atmosphere–ocean coupled climate model. We show that the model produces significant NAO responses peaking several years after extrema of the solar cycle, persisting even when the solar forcing becomes neutral. This confirms suggestions of a further component to the solar influence on the NAO beyond direct atmospheric heating and its dynamical response. Analysis of simulated upper ocean temperature anomalies confirms that the North Atlantic Ocean provides the memory of the solar forcing required to produce the lagged NAO response. These results have implications for improving skill in decadal predictions of the European and North American winter climate.

A simulated lagged response of the North Atlantic Oscillation to the solar cycle over the period 1960–2009

OPEN ACCESS

M B Andrews 1, J R Knight 1 and L J Gray 2
Show affiliations

M B Andrews et al 2015 Environ. Res. Lett. 10 054022
doi:10.1088/1748-9326/10/5/054022Published 22 May 2015

Tag this article Create citation alert PDF (1.43 MB)

Abstract

Numerous studies have suggested an impact of the 11 year solar cycle on the winter North Atlantic Oscillation (NAO), with an increased tendency for positive (negative) NAO signals to occur at maxima (minima) of the solar cycle. Climate models have successfully reproduced this solar cycle modulation of the NAO, although the magnitude of the effect is often considerably weaker than implied by observations. A leading candidate for the mechanism of solar influence is via the impact of ultraviolet radiation variability on heating rates in the tropical upper stratosphere, and consequently on the meridional temperature gradient and zonal winds. Model simulations show a zonal mean wind anomaly that migrates polewards and downwards through wave–mean flow interaction. On reaching the troposphere this produces a response similar to the winter NAO. Recent analyses of observations have shown that solar cycle–NAO link becomes clearer approximately three years after solar maximum and minimum. Previous modelling studies have been unable to reproduce a lagged response of the observed magnitude. In this study, the impact of solar cycle on the NAO is investigated using an atmosphere–ocean coupled climate model. Simulations that include climate forcings are performed over the period 1960–2009 for two solar forcing scenarios: constant solar irradiance, and time-varying solar irradiance. We show that the model produces significant NAO responses peaking several years after extrema of the solar cycle, persisting even when the solar forcing becomes neutral. This confirms suggestions of a further component to the solar influence on the NAO beyond direct atmospheric heating and its dynamical response. Analysis of simulated upper ocean temperature anomalies confirms that the North Atlantic Ocean provides the memory of the solar forcing required to produce the lagged NAO response. These results have implications for improving skill in decadal predictions of the European and North American winter climate.

1. Introduction

The variability of the Sun's output influences the heating of the stratosphere via the absorption of ultraviolet (UV) by ozone (Haigh1994, Gray et al 2009). Observational studies of the influence of the 11 year solar cycle show warm temperature anomalies in the equatorial upper stratosphere at solar maximum compared to solar minimum (Frame and Gray 2010, Mitchell et al 2014). Significant changes in the extratropical atmospheric circulation have been linked to these temperature anomalies (Kodera 1995, Kodera and Kuroda 2002), and this is supported by modelling studies (e.g. Matthes et al 2004, 2006, Ineson et al 2011). One of the mechanisms for 'top-down' solar influence (Gray et al 2010) involves equatorial stratospheric warm anomalies at solar maximum which increases the mean meridional temperature gradient, resulting in an increase in the mean Westerly wind in the mid-latitude stratosphere. This positive zonal wind anomaly is then amplified by forcing from planetary waves propagating upwards from the troposphere. Along with meridional advection, this wave feedback causes the poleward and downward migration and amplification of the wind anomaly to the mid- and high-latitude lower stratosphere, where it is able to influence tropospheric circulation. The resulting surface response involves sea-level pressure changes at solar maximum which are very similar to the positive phase of the Arctic Oscillation (AO), with anomalous low pressure over the North Pole bordered by anomalous high pressure in mid-latitudes (Thompson and Wallace 1998). Conversely, at solar minimum, a negative AO response results from reduced stratospheric meridional temperature gradients and the downward and poleward propagation of negative zonal wind anomalies. This top-down mechanism occurs on seasonal timescales since planetary wave propagation in the stratosphere is limited to the winter half-year.

This 'top-down' mechanism cannot explain the recently identified lag of approximately 3 years between solar maximum (minimum) and an increased tendency of a positive (negative) North Atlantic Oscillation (NAO) signal superimposed on the intrinsic year-to-year NAO variability (Gray et al 2013). The ability of the climate system to produce a multi-year lag in the winter NAO response necessitates the persistence of solar signals within the climate system from one winter to the next. Scaife et al (2013) showed that the North Atlantic Ocean is a prime candidate for the source of the lag. Model simulations have demonstrated that the sub-surface North Atlantic Ocean can be influenced by NAO changes related to the internal variability of stratospheric circulation (Reichler et al2012) and changes in multidecadal solar irradiance (Menary and Scaife 2014). On interannual timescales, Scaife et al (2013) presented a mechanism involving coupled atmosphere–ocean feedbacks. The NAO is known to be correlated with a tripole pattern in the North Atlantic sea-surface temperatures (SST), (Visbeck et al 2003), which extends below the surface into the ocean mixed layer. Due to the seasonal cycle in surface heat and turbulent fluxes, the mixed-layer-depth (MLD) is deeper in winter than in summer. This suggests that a winter sub-surface ocean signal, linked to solar variability, could persist by being isolated underneath the shallower summer mixed layer from the modifying influence of surface fluxes from the atmosphere. In autumn, as the summer mixed-layer erodes and the deeper winter mixed layer becomes established, any sub-surface solar signal would reconnect with the surface, giving it the potential to influence the atmosphere. This sequestration and re-emergence of signals from one winter to the next has been shown to operate in other contexts (Alexander et al 1999, Timlin et al 2002, Deser et al 2003, Taws et al 2011), and would give rise to a forcing of the NAO by the ocean (Rodwell and Folland 2002). Hanawa and Sugimoto (2004) identified several regions of re-emergence including areas of the North Atlantic relevant to this study. Scaife et al (2013) argue that a weak solar-related AO/NAO signal could build up over a number of years in the tripole region of the North Atlantic Ocean and feedback onto the atmosphere to produce a peak in the NAO signal after a few years.

Several studies have examined the simulated NAO response to solar forcings. Gray et al (2013) and Mitchell et al (2015) showed that Coupled Model Intercomparison Project Phase 5 (CMIP5) simulations were unable to reproduce the observed NAO response. On the other hand, Ineson et al (2011) were able to simulate a realistic amplitude of the NAO response by imposing a higher level of variability in UV-band irradiance. They reproduced the UV-induced 'top-down' mechanism, connecting the upper-stratosphere and the tropospheric NAO. The simulations from Ineson et al (2011) were further analysed by Scaife et al (2013), who showed that the implied ocean–atmosphere coupling in the model used by Ineson et al (2011) was too weak to produce the observed delay.

In this study we use historical simulations of the period 1960–2009 with CMIP5 evolving forcings to explore the influence of solar variability on the NAO. This is different to the experiments of Ineson et al (2011) which use constant forcings within their solar maximum and solar minimum scenarios. We use two ensembles, the first with solar irradiance held constant and the second with time-varying spectrally resolved solar variability. The difference in response of the ensembles should reveal the influence of the varying solar cycle on the atmosphere and oceans.

...
Figure 1. (a) Time-series of imposed TSI anomaly (black line), and UV-band irradiance anomaly (dashed blue line) with respect to the 1960–2009 mean. (b) Composites of upper stratospheric zonal mean temperature (dashed red line) and DJF NAO-index (black line) as a function of lag with respect to solar maximum minus solar minimum. The upper stratospheric temperature is calculated as the annual average of the region bounded by 0.5–5 hPa (approximately 40–55 km), and 30 °S–30 °N. The NAO-index is defined as the DJF surface pressure difference between the Azores and Iceland. The points where the NAO-index is significant at the 95% level are highlighted with squares.
We have investigated the NAO response to solar variability using a state-of-the-art atmosphere–ocean coupled model. Historical ensembles for the period 1960–2009 were performed with constant and time-varying solar irradiance. Analysis of the differences between the ensembles was performed to identify solar cycle responses in the atmosphere and ocean. The results demonstrate tropical upper stratospheric heating in response to the imposed UV change at solar maximum compared to solar minimum, and confirm the results of Ineson et al (2011), showing a subsequent surface winter NAO response via a 'top-down' mechanism. The response of the NAO peaks 3–4 years following the extreme phase of the solar cycle. This finding is consistent with a recent re-evaluation of observed responses to the solar cycle (Gray et al 2013) which shows the largest NAO signal at a similar lag. The in-phase response of the Aleutian Low is also in agreement with observational analyses.
We diagnose the source of the NAO lag in the model by examining its surface and sub-surface solar responses in the North Atlantic Ocean. We find evidence for amplification of 'top-down' solar-related NAO changes via an ocean feedback over a period of several years, as suggested by Scaife et al (2013). This feedback is analysed by examining solar cycle responses in the different nodes of the North Atlantic tripole SST pattern, as this pattern reflects NAO–ocean coupling. The Northern and Middle nodes of the tripole show temperature responses in the surface and sub-subsurface ocean with a similar lag to the NAO. The Southern node, however, does not show any lag. In the Middle node we find re-emergence of solar signals imprinted on the ocean from the previous winter. By remaining intact below the shallow ocean mixed-layer that forms in summer, these signals can re-emerge in winter and reinforce the 'top-down' forcing of the NAO via coupling with the atmosphere. This mechanism is not evident in the Northern and Southern nodes. The simulated re-emergence in the North Atlantic Ocean causes an accumulation of the solar signal, allowing the NAO to grow over several years. This growth is limited by the reversal of the solar cycle, resulting in a lag approximately equal to one quarter of its period. Although we do not explicitly demonstrate here that the growth in the NAO response arises through feedback from the solar SST signal in the Middle node the existence of this feedback is supported by previous studies (Rodwell and Folland 2002, Timlin et al 2002) that show the influence of tripole SSTs on the NAO.
The NAO (Hurrell et al 2003) is a key mode of regional climate variability that strongly influences the wintertime weather of Northern Europe and Eastern North America. The ability to reproduce the lagged NAO response to solar forcing in atmosphere–ocean coupled models offers the possibility of increased NAO predictability and hence skill in seasonal forecasts (Scaife et al 2014) and decadal forecasts up to a few years ahead (Smith et al 2012).

Saturday, January 11, 2014

New paper finds another amplification mechanism by which the Sun controls climate

A new paper published in the Journal of Atmospheric and Solar-Terrestrial Physics finds more evidence of solar amplification mechanisms by which the Sun controls climate change. According to the authors, changes in solar activity affect cosmic rays [Svensmark et al] and the distribution of solar energy between different layers of the atmosphere [stratosphere and troposphere]. This then results in third order effects upon natural atmospheric oscillations such as the Southern Oscillation, North Atlantic Oscillation, Scandinavian Pattern, and the Quasi Biennial Oscillation (QBO). These atmospheric oscillations in turn have global effects upon climate change.

Contrary to claims of climate alarmists, the authors show that between 1960 to 2003 the trend of solar geomagnetic activity was up, which in turn reduced cosmic rays and cloud formation, leading to the well-known "global brightening" of the latter 20th century, amplification of solar energy at the Earth surface and warming, and change in energy distribution with more heat in the troposphere and less in the stratosphere. Global warming alarmists claim the pattern of increasing tropospheric and decreasing stratospheric temperatures is a fingerprint of man-made global warming, but this paper finds solar amplification mechanisms can account for this same pattern instead.


Fig. 1. Annual averages for all data included in the analysis. CR= cosmic rays, Ap = index of solar geomagnetic activity, UV = solar ultraviolet [which decreases during solar maxima], SOI = Southern Oscillation Index, PNAI = Pacific North American teleconnection, SPI = Scandinavian Pattern,  NAOI =  North Atlantic Oscillation Index, Temp tropo = tropospheric temperatures, strato = stratospheric temperatures.


Fig. 2.  Correlation coefficients between average hemispheric temperatures anomalies at tropospheric and stratospheric level, for the entire Northern Hemisphere and for extratropical latitudes. Correlations are calculated for the entire series (Ann), for years with QBO West (QBOW), for years with QBO East (QBOE), solar minimum years (sm) and solar maximum years (SM). Corrrelations for the entire year (A) and all seasons: winter (W), spring (Sp), summer (Su), fall (F) are also shown.
Possible effects of atmospheric teleconnections and solar variability on tropospheric and stratospheric temperatures in the Northern Hemisphere
  • a Department of Geography, Faculty of Geography and Geology, Al. I. Cuza University of Iaşi, Bd. Carol I, no. 20A, 700505, Iaşi, Romania
  • b Department of Physics, ”Dunărea deJos” University of Galati, St. Domnească, 111, 800201, Galati, Romania

Author-Highlights

The Northern tropospheric temperature correlates with the Scandinavian Pattern.
The Northern stratospheric temperature correlates to the Southern Oscillation.
The cosmic ray flux might modulate the tropospheric and stratospheric variability.
UV effects on tropospheric and stratospheric temperature are not clear.

Abstract

Possible relationships between tropospheric and stratospheric temperatures in the Northern Hemisphere and atmospheric oscillations, solar and geomagnetic activity are described using correlation analysis. The dependence of correlations on season, solar activity level and phase of the Quasi Biennial Oscillation (QBO) is also investigated. An important finding is that the variability of the hemispheric tropospheric temperature is well connected to the Scandinavian Pattern, to the Pacific North American teleconnection and less with the North Atlantic Oscillation. There is also a possible link with the Southern Oscillation (SO) for winter. Solar UV and cosmic ray flux might influence tropospheric temperature during warm seasons, solar maximum or QBO West. Significant correlations between the Northern stratospheric temperature and the SO is observed especially during the Eastern phase of QBO and solar minimum. Signatures of geomagnetic variability are seen in the winter stratospheric temperature. The stratospheric temperature correlates with the cosmic ray flux and solar UV at annual level at solar maximum and QBO West. The UV effect at stratospheric level is less clear than expected. The existence of some correlations between tropospheric/stratospheric temperatures and internal and external parameters under certain climatic circumstances and during different solar cycle phases might help in identifying processes that transfer energy from the Sun to different atmospheric layers and in assessing their role in climate variability.

Sunday, January 5, 2014

Paper finds solar amplification mechanism via clouds at the South Pole, amplifies surface solar irradiance up to 24 times

A paper published in Atmospheric Chemistry and Physics finds evidence of a solar amplification mechanism via cloud cover at the South Pole. According to the authors, at solar cycle minimums, cloud cover increases which further decreases solar radiation reaching the surface of the South Pole by 1.8% - 2.4%, depending on the wavelength, and vice-versa for solar cycle maximums. This begs the question: Could the current record high Antarctic sea ice extent be related to the current weakest solar cycle in 100 years rather than AGW? ;)

The paper adds to many other peer-reviewed papers describing solar amplification mechanisms by which tiny 0.1% changes of total solar irradiance can be amplified to produce large effects on climate. According to this paper, 0.1% changes in solar irradiation over solar cycles are amplified by a factor of 18 to 24 times at the surface of the South Pole, dependent upon wavelength. As noted by Dr. Roy Spencer, a mere 1-2% change in global cloud cover [such as the 1.8% - 2.4% found by this paper] can alone account for global warming - or global cooling.


The current solar cycle is the weakest in 100-200 years.


Atmos. Chem. Phys., 11, 1177-1189, 2011
www.atmos-chem-phys.net/11/1177/2011/
doi:10.5194/acp-11-1177-2011

Full paper available here:


J. E. Frederick and A. L. Hodge
Department of the Geophysical Sciences, University of Chicago, Chicago, Illinois, USA
Abstract. This research examines a 17-year database of UV-A (320–400 nm) and visible (400–600 nm) solar irradiance obtained by a scanning spectroradiometer located at the South Pole. The goal is to define the variability in solar irradiance reaching the polar surface, with emphasis on the influence of cloudiness and on identifying systematic trends and possible links to the solar cycle. To eliminate changes associated with the varying solar elevation, the analysis focuses on data averaged over 30–35 day periods centered on each year's austral summer solstice. The long-term average effect of South Polar clouds is a small attenuation, with the mean measured irradiances being about 5–6% less than the clear-sky values, although at any specific time clouds may reduce or enhance the signal that reaches the sensor. The instantaneous fractional attenuation or enhancement is wavelength dependent, where the percent deviation from the clear-sky irradiance at 400–600 nm is typically 2.5 times that at 320–340 nm. When averaged over the period near each year's summer solstice, significant correlations appear between [ground level] irradiances at all wavelengths and the solar cycle as measured by the 10.7 cm solar radio flux. An approximate 1.8 ± 1.0% decrease in ground-level irradiance occurs from solar maximum to solar minimum for the wavelength band 320–400 nm. The corresponding decrease for 400–600 nm is 2.4 ± 1.9%. The best-estimate declines appear too large to originate in the sun. If the correlations have a geophysical origin, they suggest a small variation in atmospheric attenuation [clouds] with the solar cycle over the period of observation, with the greatest attenuation [more clouds] occurring at solar minimum.

Thursday, August 28, 2014

New paper describes another solar amplification mechanism that affects low clouds

A paper published today in Geophysical Research Letters finds another potential solar amplification mechanism by which tiny changes in the solar wind affect clouds and pressure [geopotential height anomalies] in the lower troposphere. 

The authors find this new mechanism to be distinct from previously described solar amplification mechanisms involving 
"downward propagation of atmospheric effects to the lower troposphere from the stratosphere due to solar-variability-driven mechanisms involving ultra-violet radiation or energetic particle precipitation."
The newly described solar-wind-driven amplification mechanism is also distinct from the solar-wind-driven mechanism of Svensmark's cosmic ray theory of climate, and adds to many other potential solar amplification mechanisms described in the scientific literature. 


Solar-wind-driven geopotential height anomalies originate in the Antarctic lower troposphere

Mai Mai Lam et al


We use NCEP/NCAR reanalysis data to estimate the altitude and timelag dependence of the correlation between the interplanetary magnetic field component, By, and the geopotential height anomaly above Antarctica. The correlation is most statistically significant within the troposphere. The peak in the correlation occurs at greater timelags at the tropopause (~6–8 days) and in the mid-troposphere (~4 days), than in the lower troposphere (~1 day). This supports a mechanism involving the action of the global atmospheric electric circuit, modified by variations in the solar wind, on lower tropospheric clouds. The increase in timelag with increasing altitude is consistent with the upward propagation by conventional atmospheric processes of the solar-wind-induced variability in the lower troposphere. This is in contrast to the downward propagation of atmospheric effects to the lower troposphere from the stratosphere due to solar-variability-driven mechanisms involving ultra-violet radiation or energetic particle precipitation.

Tuesday, April 16, 2013

Paper finds another amplification mechanism by which the Sun controls climate

A lecture by professor Hiroko Miyahara of the University of Tokyo provides additional support to the Svensmark theory of cosmoclimatology, finding that both solar geomagnetic activity and the polarity of geomagnetic activity have significant effects upon cosmic rays and cloud formation. The polarity of solar geomagnetic activity flips with a 22-year cycle, with periods of negative polarity [such as the current solar cycle] having a greater effect upon cosmic rays and cloud formation. The authors also find a remarkable correlation between solar rotational signals, cloud height, and the Madden-Julian Oscillation [third figure below], which may represent yet another mechanism by which small changes in solar activity can be amplified to large changes in climate. Other amplification mechanisms include via ocean oscillations, ozone, and sunshine hours/clouds.


Solar Activity and Climate - Hiroko Miyahara, The University of Tokyo from Kavli Frontiers of Science on Vimeo.


Pdf file of slides

Solar Activity and Climate

Hiroko Miyahara, The University of Tokyo
Abstract:
1. Introduction
Instrumentally measured or reconstructed past climate changes often show positive correlation with solar activity at the wide range of time scales, such as from monthly (Takahashi et al., 2010) to millennial (Bond et al., 2001). However, the mechanisms of their linkage have not been well understood. The possible solar-related parameters that can drive climate change are; total solar irradiance (TSI), solar ultra violet (UV), solar wind (SW) and the galactic cosmic rays (GCRs). The galactic cosmic rays are attenuated by changing solar magnetic field in the heliosphere; the region where the wind of solar plasma and magnetic filed expend. The observed flux of GCRs shows inverse correlation to solar activity. It is known that the change in the cosmic ray flux results in the change in the ionization rate in the atmosphere. It is suggested that it may cause the change in cloud amount.
2. Variation of Galactic Cosmic Rays during the Maunder Minimum
It is difficult to evaluate the exact role of each of solar-related parameters above, since most of them are more or less synchronized for the instrumental period. However, the variation of solar radiation and GCRs may be different at the Maunder Minimum (AD1645-1715). The Maunder Minimum is a period of sunspot absence lasted about 70 years. The Sun has shown periodic variation with ~11-year period since the beginning of the 18th century. However, the sunspots had almost disappeared and apparent ~11-year cycles had been lost during the Maunder Minimum. It means that solar activity had been extraordinarily weak and that the environment of heliosphere had been different from today. We found that the variation of GCRs was very unique during the time. The variation of GCRs has been revealed by the measurements of cosmic-ray induced radio isotopes such as carbon-14 and beryllium-10 in tree rings or ice cores. The content of radio isotopes have shown that solar cycle had been kept during the long-lasting sunspot absence, but with ~14-year period. It has been also revealed that the 22-year cycle; the cycle of periodic reversal of solar dipole magnetic field, had been also kept but with ~28-year period and had been amplified during the time. The polarity of the Sun reverses at the maxima of solar cycles, and thus holds ~22-year period. The ~22-year cycle is not observed in the changes in solar radiations; however it appears in the variation of GCRs consisting of mainly changed particles. The changes in the environment of heliosphere had probably resulted in the amplification of the 22-year cycle in GCRs.
3. Variation of climate and its relation to Galactic Cosmic Rays
We have found that reconstructed climate data show unique variations similar to that of GCRs during the Maunder Minimum. For example, the northern hemispheric temperatures are significantly dependent on the direction of solar dipole magnetic field. At the phases of negative polarity of dipole magnetic field, when GCRs show anomalous increase, we observe colder climate. The dependence of climate change on solar dipole magnetic field results in the manifestation of 22-year cycle in climate change. The cause of decadal to multi-decadal climate changes had not been well understood, however, our study suggests that GCRs may be the playing important role in climate change at those time scales.
Conclusion
More detailed studies are needed to reveal the mechanisms of solar influence on climate change; however, our study has suggested that not only solar irradiative outputs but also magnetic property is playing important role in climate change possibly through changing the flux of GCRs. The mechanisms how the cosmic rays change the cloud property should be clarified in the future studies.
References
G. Bond et al., Persistent Solar Influence on North Atlantic Climate During the Holocene, Science, 7, 294, 2130, 2001.
H. Miyahara, Y. Yokoyama & K. Masuda, Possible link between multi-decadal climate cycles and periodic reversals of solar magnetic field polarity, Earth Planet. Sci. Lett., 272, 290-295, 2008.
Y. Takahashi, Y. Okazaki, M. Sato, H. Miyahara, K. Sakanoi, and P. K. Hong, 27-day variation in cloud amount and relationship to the solar cycle, Atmos. Chem. Phys., 10, 1577-1584, 2010.

Tuesday, February 24, 2015

Yes, the sun (was) driving global warming

A new article published by the Washington Post titled No, the sun isn’t driving global warming attempts to discredit Dr. Willie Soon's peer-reviewed, published research papers, some of which have demonstrated solar influences upon climate. The article does not cite nor provide any scientific rebuttal whatsoever to any specific scientific paper written by Dr. Soon, nor to any of the hundreds of other peer-reviewed published papers demonstrating a solar-climate relationship and potential solar amplification mechanisms. 

Instead, the author cites the repeatedly-debunked and simplistic propaganda attempting to dismiss the role of the Sun in climate change promulgated by the warmist Skeptical Science website. 

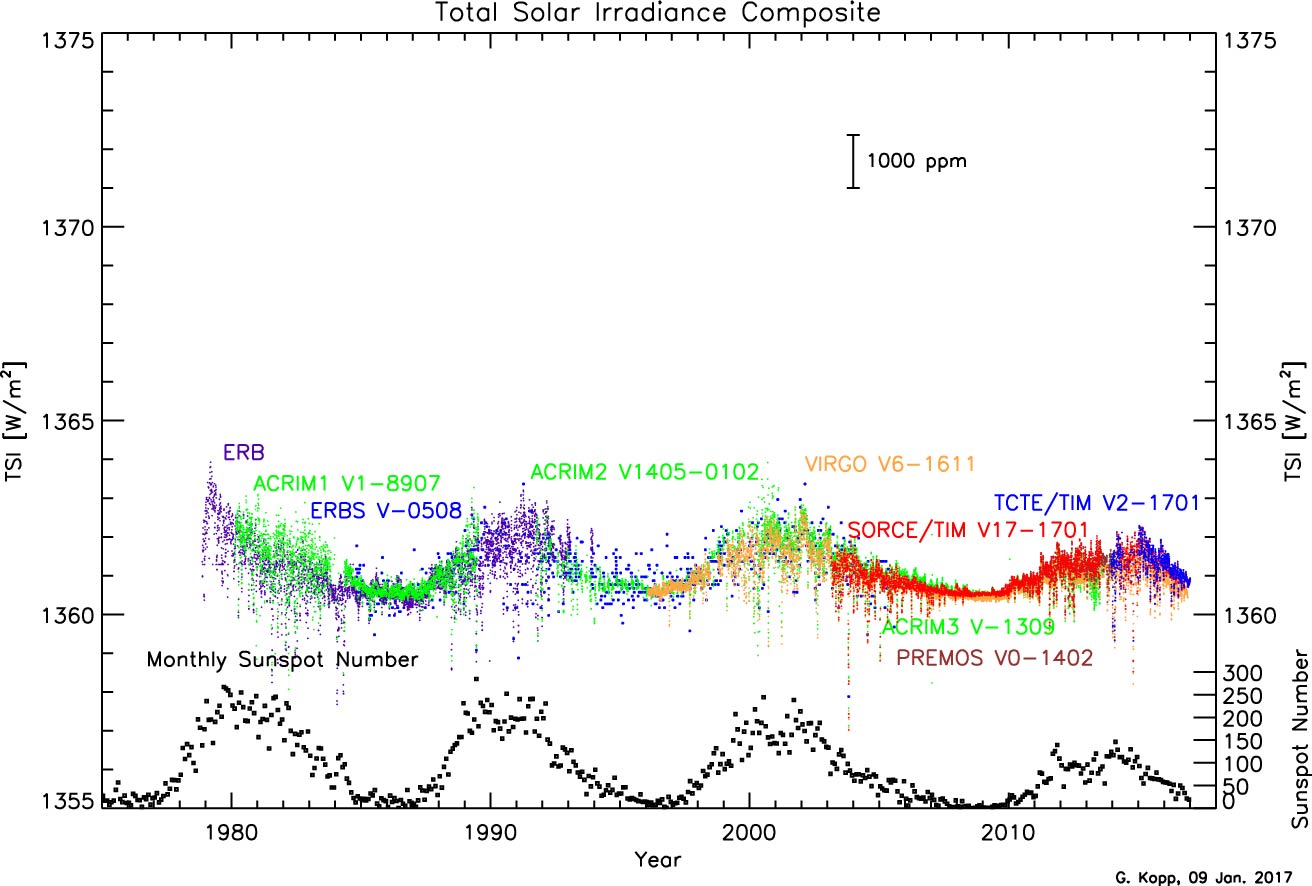
These falsehoods include the claim that there was no increase in solar activity during the 20th century. This is debunked by the SkS graph in the article itself shown below. The dark blue moving average line in the graph of total solar irradiance (TSI) clearly demonstrates the average TSI of the first half of the 20th century is much less than the entire 2nd half of the 20th century. Given that many papers have found a lagged effect of solar activity changes upon climate, and the large thermal inertia of the oceans, is it entirely reasonable to expect that a sustained high solar output of the latter half of the 20th century would produce a delayed and gradually increasing trend, as was observed. 

This is better demonstrated by calculating the "sunspot integral" of solar activity, which clearly demonstrates a steady rise in accumulated solar output beginning in the 1930's to the end of the 20th century. The correlation of the sunspot integral to global temperature (~.95) is also far superior to that of CO2 and global temperature (~.35). 


The real hockey stick. See also The Sun explains 95% of climate change over the past 400 years; CO2 had no significant influence

The global warming "pause" began almost simultaneously with the current lull in solar activity, while atmospheric CO2 levels continued a steady rise. Even the IPCC, which formerly completely dismissed the role of the Sun in climate change was forced to admit in the latest assessment report that low solar activity is one potential explanation (of at least 66 others) proposed as a cause of the 18+ year "pause" of global warming. It is nonsense to claim that solar activity only significantly affects climate when temperatures are steady to falling, but not while temperatures are rising. 

The Washington Post article below also claims the solar activity of the late 20th century was not exceptional in comparison to the past millennium, a claim which is refuted by multiple proxy reconstructions including:

The article also attempts to dismiss solar effects upon climate by claiming the 0.1% change in solar output over a solar cycle is insufficient to force global temperatures. This simplistic analysis conveniently ignores hundreds of peer-reviewed papers describing potential solar amplification mechanisms, which suggest how tiny changes in solar output may be amplified by many potential mechanisms and secondary effects to produce large-scale changes in climate. 

In sum, the attempts by warmists to dismiss the role of the Sun in climate change are based upon oversimplified and elementary analyses which conveniently ignore hundreds of peer-reviewed papers finding an increase of solar activity over the 20th century to a solar "Grand Maximum" at the end of the 20th century, solar-driven ocean oscillations -which have profound and lagged effects upon climate, and many other solar amplification mechanisms described in the literature, all of which provide plausible mechanisms and explanations for all or most of the global warming of the 20th century, as well as the current 18-year global warming "pause."

Related posts:

The Sun explains 95% of climate change over the past 400 years; CO2 had no significant influence


Climate Modeling: Ocean Oscillations + Solar Activity R²=.96


Analysis shows accumulated solar energy explains 20th century global warming; no significant effect of CO2

The Time-Integral of Solar Activity explains Global Temperatures 1610-2012, not CO2

Natural Climate Change has been Hiding in Plain Sight

New paper confirms the Sun was particularly active during the latter 20th century

Global warming made simple: How natural variability explains 20th century global warming without man-made CO2

Sunspot Integral v. Temperature

The Sun can't possibly explain global warming

New paper finds recent Grand Maximum of solar activity was 'rare or even unique event' in 3,000 years

New paper finds up to 72% of temperature increase over past 150 years due to the Sun
How climate models dismiss the role of the Sun in climate

How climate models dismiss the role of the Sun in climate change [Part 3]
How climate models dismiss the role of the Sun in climate change [Part 4]


By Chris Mooney February 23

Excerpts:

Despite all the attention to who funds him, it is important to note that much of the controversy here is about Soon’s actual scientific views. While Soon has challenged the conclusions of other climate and environmental researchers on subjects ranging from the vulnerability of polar bears to the planet’s climate history, one of his principal arguments has long been that variations in the behavior of the sun, rather than human caused greenhouse gas emissions, are the central factor driving climate change.

Thus the Heartland Institute, a conservative think tank that lists Soon as one of its experts, calls him “a leading authority on the relationship between solar phenomena and global climate.” In a recent Heartland Institute report, Soon and a co-author wrote that “The Sun may have contributed as much as 66% of the observed twentieth century warming, and perhaps more” — going on to suggest that global cooling may lie ahead, due to the “recently quiet Sun and extrapolation of solar cycle patterns into the future.”

This “it’s the sun” claim is an extremely popular argument with climate change doubters — according to the website Skeptical Science, it is the second most popular anti-global warming argument of them all, second only to “climate’s changed before.” So is there any truth to it? After all, regardless of who supports his research, if Soon is actually right on the substance then we may be getting all worked up about global warming for nothing.

Certainly, the argument that the sun — rather than carbon dioxide pollution — is driving global warming cannot be dismissed out of hand. After all, if there is indeed significantly more solar radiation coming in to the Earth, that would definitely raise the planet’s temperature (and vice-versa). The sun is, after all, where we get most of our energy from. Thus, the argument is at least physically plausible.

However, the idea that the sun is currently driving climate change is strongly rejected by the world’s leading authority on climate science, the U.N.’s Intergovernmental Panel on Climate Change, which found in its latest (2013) report that “There is high confidence that changes in total solar irradiance have not contributed to the increase in global mean surface temperature over the period 1986 to 2008, based on direct satellite measurements of total solar irradiance.”

The IPCC “basically says that global warming is not caused by the sun,” says Gerald Meehl, a senior scientist at the National Center for Atmospheric Research. “The strongest evidence for this is the record of satellite measurements of solar output since the late 1970s that show no increasing trend in solar output during a period of rapid global warming.”

Here’s a graphic, courtesy of Skeptical Science, showing overall trends in solar irradiance and temperature:


The sun’s output clearly does vary, as you can see above. For instance, scientists have identified an 11 year sunspot cycle, and found that at the maximum point for sunspots in the cycle, total solar irradiance is indeed somewhat greater than at the minimum. This can have regional effects on the Earth’s climate, says Meehl. “There is evidence for a solar effect in some regions,” he says, “but not a strong global signal over the era of reliable satellite measurements.”

It isn’t only the IPCC that concludes this. “No satellite measurements have indicated that solar output and variability have contributed in a significant way to the increase in global mean temperature in the past 50 years,” concluded a recent workshop report from the National Academy of Sciences. The report noted that while the 11-year sunspot cycle can lead to changes in total solar irradiance of as much as .1 percent, that only translates into a “few hundredths of a degree centigrade” temperature response on the Earth.

“Clearly the sun matters and if it varied a lot then there would be consequences, but it doesn’t,” explains Kevin Trenberth, a prominent climate researcher who is also at the National Center for Atmospheric Research. “The variations are only order 0.1%.”

Of particular significance is the fact that solar irradiance has not shown an increasing trend over the past several decades, while global temperatures clearly have.

recent scientific review article on climate and the sun similarly notes “the lack of detection of an underlying irradiance trend in the past three decades,” and concludes, in rather strong terms, that:
Claims that the Sun has caused as much as 70% of the recent global warming … presents fundamental puzzles. It requires that the Sun’s brightness increased more in the past century than at any time in the past millennium, including over the past 30 years, contrary to the direct space-based observations. And it requires, as well, that Earth’s climate be insensitive to well-measured increases in greenhouse gases at the same time that it is excessively sensitive to poorly known solar brightness changes. Both scenarios are far less plausible than the simple attribution of most (90%) industrial global warming to anthropogenic effects, rather than to the Sun.

So in sum: It’s not that the sun can’t influence climate. It can, and it does. And climate scientists have accordingly been studying the influence of the sun for many years.

And they have found that, while the sun certainly is not irrelevant, the case for steadily rising carbon dioxide as the principal factor driving the current warming trend just makes a lot more sense.

Willie Soon and some other climate change doubters would surely argue back against this finding — but it’s a strong consensus finding, as shown above. The weight of expert opinion isn’t with these doubters — but the burden of proof most definitely is.