Re-posted from the Australian Climate Skeptics Party website:
Has Man-made global warming been disproved? A Review of Recent Papers.
Anthony Cox and Jo Nova
Introduction
Climate Change was described in 2007 by the soon to be, briefly, Australian prime Minister, Kevin Rudd, as the “greatest moral, economic and environmental challenge of our generation.” By Climate Change Rudd meant anthropogenic global warming, or global warming as it was originally described by Al Gore.
Government attempts to ‘solve’ global warming are framed by hyperbole and urgent policies. These policies involve the expenditure of vast amounts of money1,2 and are justified because we are told “The science is settled”3.
Science is never settled. Richard Feynman said [The Meaning of it All, 1999]:
The exception proves that the rule is wrong. That is the principle of science. If there is an exception to any rule, and if it can be proved by observation, that rule is wrong.
The dominant argument for global warming contradicts Feynman’s “principle of science”. This dominant argument is that a majority of scientists, a consensus, support it4. But as Feynman notes consensus is a false proof of a scientific theory because only one contradictory bit of empirical evidence is sufficient to refute that theory.
In fact not one but seven recent peer-reviewed papers have revealed what would seem to be fatal flaws in global warming. Global warming says there has been an increase in the global average temperature since the mid-20th century and its projected continuation. According to the Intergovernmental Panel on Climate Change [IPCC] “most of the observed increase in globally averaged temperatures since the mid-20th century is very likely due to the observed increase in anthropogenic greenhouse gas concentrations.” [AR4, Working Group 1, page 10].
For purposes of this essay then global warming is the increase in global average temperature primarily caused by human emissions of greenhouse gases, primarily carbon dioxide [CO2].
The seven papers discussed use different methods to critique global warming but are all based on empirical data and are in rough agreement that any increase in global average temperature due to a doubling of CO2 is more likely to be about half a degree than the 3.26 degrees determined by the IPCC [AR4, Box 10.2]. The extent of the change in global average temperature to a doubling in CO2 is known as the climate sensitivity [see Figure 8].
A forcing is a factor external to or introduced to the climate system which affects, for a period, the radiative balance at the Tropopause, the boundary between the Troposphere and the Stratosphere. The IPCC recognises 2 main types of forcings; greenhouse gases, the most dominant one being CO2, and solar radiation. A feedback is a change in another quantity in the climate system as a response to a change in a forcing. The IPCC assumes that an increase in forcing from an increase in anthropogenic CO2 causes a feedback by an increase in water vapour [AR4, FAQ 1.3]. This process is measured by the change in global average temperature. However, as some scientists note, the distinction between a forcing and a feedback is not clear:
However, disadvantageously, including non-instantaneous processes clearly blurs the distinction between forcing and feedback as there is no longer a clear timescale to separate the two; further including these processes in the forcing incorporates more uncertain aspects of a climate models response [Forster et al., 2007].5
The following papers clarify this uncertainty between forcings and feedbacks and show that the global warming science is not clear about the distinction or effects. The papers show the IPCC assumptions about the role of CO2 and water vapor, particularly in the form of clouds, are incorrect and that the IPCC conclusions about climate sensitivity are both exaggerated and wrong. In doing so, these papers also vindicate Feynman’s maxim.
1 Lindzen and Choi –The Earth has a safety release valve
From Wielicki, B.A., T. Wong, et al, 2002: Evidence for large decadal variability in the tropical mean radiative energy budget. Science, 295, 841-844.
If global warming is going to happen it will be due to feedbacks. If the feedbacks are positive it means that as the world warms, atmospheric conditions would have to change to keep evenmore of the sun’s energy inside our system. But Richard Lindzen and Yong-Sang Choi show that as the world warms Earth’s dynamic system changes to let more of the infra red or long-wave energy out to space [LW from Figure 1]. It’s like a safety release valve. This means that the system has negative feedbacks (like almost all known natural systems). The changesdampen the effects of extra CO2. If there is no net amplifying positive feedback there is no catastrophe. Because Lindzen & Choi are looking at long-wave radiation leaving the planet [outgoing long-wave radiation], this is a way of assessing all forms of feedbacks at once. We can’t tell which part of the system is responsible: clouds, humidity, ice-cover or vegetation, but we know the net effect of all of them together is that when the world warms, more energy escapes from the planet.
Their research was first posted in 20097 and updated in 20108 as a response to earlier criticisms. In the 2009 paper Lindzen & Choi measured changes in the outgoing long-wave radiation leaving from the top of the atmosphere during periods that the world warmed. Their findings were a direct contradiction to global warming because they showed that increased CO2did not block outgoing long-wave radiation. With no blockage the level of available energy in the climate system also did not increase. With no increase of available energy there was no energy to cause positive feedbacks and increase temperature.
Kevin Trenberth, a leading climate modeler, criticized the first paper. Those criticisms concerned the extent of satellite data used by Lindzen & Choi, their concentration on the tropics and various statistical methodologies. All of these complaints were addressed by the subsequent paper. They still found that outgoing long-wave radiation increased as the world warmed, which was different to what all the models predicted.
2 Spencer and Braswell – Cloud feedback is net negative
In a 2007 paper Roy Spencer and Danny Braswell undertook empirical measurements of cloud radiative forcings which are a net result of blockage by clouds of solar radiation coming in to the atmosphere [cooling] and blockage by clouds of long-wave radiation leaving the atmosphere [warming]; they concluded that
“the net radiative effect of clouds…is to cool the ocean atmosphere system during its tropospheric warm phase and warm it during its cool phase.” 9
That is, clouds moderate or dampen temperature movement in either direction.
Spencer & Braswell’s papers in 200810 and 201011 took a different approach to Lindzen & Choi. Spencer & Braswell looked more closely at the nature of feedbacks and forcings and the difficulty of putting a value on feedbacks. The IPCC models assume that clouds change inresponse to temperature, so they are a “feedback” [AR4, WG1, 8.6.3.2]. But as Spencer & Braswell show in their 2008 and 2010 papers clouds can be a forcing factor as well. This means that if something other than temperature affects cloud cover (like changes in ocean currents or air circulation) the change in clouds would then force the temperature to change.
The latest IPCC report acknowledges that the models don’t simulate clouds well and that’s where the main uncertainties lie. If clouds are not just a forcing in their own right, and provide negative feedback [by shading the earth] that would seriously undermine the premise of global warming. This point is illustrated by two other recent papers.
The first is a report by The Climate Process Team on Low Latitude Cloud Feedbacks on Climate Sensitivity [CPT] 12. CPT found “strongly negative net cloud feedback” in a warming world. Utilizing the climate models from NCAR, GFDL and NASA, CPT found this negative feedback concentrated in the Tropics.
Similarly Allan 201113 based his study on cloud “radiative effect” in the Tropics and concluded a “net cooling of the climate system” from clouds because solar blocking, cooling, was greater than long-wave blocking, warming. However unlike CPT, Allan did not regard this cooling as a feedback since the cloud cooling was not a response to temperature.
Spencer & Braswell provide proof that it’s very difficult to find definitive feedback signals in a dynamic system that is never at equilibrium. The only feedback they can calculate in their 2008 and 2010 papers is negative and means a climate sensitivity of about 0.6 °C for a doubling of CO2, though it’s only applicable over short time-frames. They show the near impossibility of establishing climate sensitivity over long time frames. But if climate sensitivity to CO2 is as low as they find, and dwarfed by potential cloud forcing, it would mean no postponed effect from CO2. We have had all the effect there is and there will be no stored heat lying dormant to cause future climate change. This would explain Trenberth’s concern, expressed in the CRU e-mails that the pro-global warming scientists “can’t account for the lack of warming at the moment and it is a travesty that we can’t”.
Spencer & Braswell’s 201114 paper confirms the difficulty in distinguishing cloud feedback and forcing. They also find the global warming models have substantially overestimated the climate sensitivity due to their lack of understanding of this distinction. One of the reasons that the models have failed to distinguish the effect of clouds on temperature is the difference in time it takes for the radiative effects of temperature and clouds to occur in the system; temperature effects are immediate while those of clouds take some months as Figure 2 [Figure 3 from Spencer & Braswell 2011] shows.
Spencer & Braswell 2011 has received considerable vitriol from the global warming science. This is unwarranted because this science concedes it has a lack of understanding of clouds. Spencer & Braswell have offered an explanation of clouds strongly correlated with and consistent with observations. The criticism of them would seem, therefore, to be based on preserving the global warming theory rather than answering Trenberth’s concern.
3 R.S. Knox and D.H. Douglass – The missing heat is not in the ocean.
The dominant explanation for where Trenberth’s missing warming or heat is that it is in the ocean. This missing heat is the difference between the climate effects, particularly change in global average temperature, which global warming predicted we would have and the much lower change in global average temperature we have had. In 2009 modeling von Shuckmann et al15 seemed to have found this missing heat at depths of 2000 metres in the ocean. One immediate problem for von Shuckmann et al is found in the NOAA graph in Figure 3. This graph is based on data for ocean heat content to depths of 700 metres which show no warming from 2003:
Figure 3: [http://www.nodc.noaa.gov/OC5/3M_HEAT_CONTENT/index.html]
The problem this shows for von Shuckmann et al [and other papers which also use modeling to ‘find’ deep-ocean warming16] is; how could the ocean depths be warming when the ocean top was cooling?
A second problem was raised in 2 papers by the team of Ablain17 and Cazenave18; they showed that not only was the rate of sea level rise decreasing but the steric part of the sea level rise, which is based on ocean heat content, was also decreasing from 2006.
The third contradiction to von Shuckmann et al and the missing heat is in Knox and Douglass’s paper19. Knox & Douglass are both imminent atmospheric physicists and have already written a number of papers dealing with ocean based climatic events and the connection between the ocean radiative rate of change [Fohc] and the radiative rate of change at the top of the atmosphere [Ftoa].
In their latest paper Knox & Douglass showed that not only was ocean heat content declining but that the Fohc was negative, which meant more radiative energy was leaving the ocean than being stored:
Figure 4 From Knox & Douglass page 1. Fohc left scale.
Figure 1. Ocean heat content from Argo (left scale: blue, original data; red, filtered) and ocean surface temperatures (right scale, green). Conversion of the OHC slope to W/m2 is made by multiplying by 0.62, yielding –0.161 W/m2.
Knox & Douglass’s findings about ocean heat content were based on empirical measurements and are consistent with studies by Willis, Loehle, and Pielke, and NOAA data [see Figure 3].
Knox & Douglass conclude that because “90% of the variable heat content resides in the upper ocean” the Fohc can accurately infer the Ftoa. Therefore if Fohc is negative then Ftoa is as well. A negative Ftoa is contrary to Trenberth’s claims of missing heat being stored most likely in the oceans. Without missing heat the models have greatly overestimated the effect of global warming.
4 Miskolczi – The optical depth of the atmosphere hasn’t changed
Figure 5 [from Miskolczi 2010]
Ferenc Miskolczi was a NASA atmospheric physicist whose 2 papers in 200720 and 201021were both peer reviewed and have never been refuted. These papers draw on data and calculations made by Miskolczi in a 2004 paper co-authored by NASA physicist Martin Mlynczak. Miskolczi 200422 shows that radiation leaving the Earth, outgoing long-wave radiation, is based on zonal and global averages of real atmospheric conditions as shown in the atmospheric optical thickness.
Miskolczi 2007 and 2010 measure “the true greenhouse-gas optical thickness” [Abstract, Miskolczi 2010]. This is made up of two parts which are depicted in Figure 4.
a. τA -- is defined as “the total IR flux optical depth” [page 5 Miskolczi 2007]. This is a measure of the total amount of infra-red or long-wave radiation which is absorbed between the surface and the top of the atmosphere.
b. A -- is the flux absorbance [page 3 Miskolczi 2010] and is a measure of what wavelengths of long-wave radiation are being absorbed and transmitted in the atmosphere by 11 greenhouse gases [page 7, Miskolczi 2004].
Together τA and A are the optical depth of the atmosphere The optical depth is a kind of proxy measure of the greenhouse effect. Global warming says that more CO2 will increase the optical depth. Miskolczi showed that available empirical measurements of the optical depth are consistent with no change in 61 years. This means that even though CO2 has increased over the 61 years of measurement and increased the optical depth slightly, “variations in water vapor column amounts” [Figure 11, Miskolczi 2010] have decreased the optical depth by a similar amount. Paltridge et al.23 have confirmed a decrease in water vapor for this period.
If the optical depth has not increased overall, it suggests the slight warming of the 20th C has not been due to an increase in the greenhouse effect.
In addition Miskolczi also finds no positive feedback from water vapor on atmospheric long-wave radiation absorption, which negates what the models have predicted; this lack of positive feedback has been confirmed by the missing ‘Tropical hot spot’ [see section 6].
5 McShane and Wyner24 – The Hockeystick is broken
Figure 6. McShane&Wyner, page 36
Blakeley McShane and Abraham Wyner attempted to replicate Michael Mann’s infamous hockeystick using Mann’s own data. The hockeystick first appeared in Mann’s 1998 paper and has been a centre-piece of global warming evidence ever since. The hockeystick is important because it supposedly shows recent warming is exceptional and “unprecedented”. The hockeystick is based on dendro-climatic proxies or tree-rings which supposedly provide evidence for past temperatures. Mann’s hockeystick shows basically flat temperature until the 20th C and then a sudden and rapid increase.
Mann’s data was highly problematic. Mann had used the wrong type of tree, and at times, hardly any samples. Some of the tree-ring records even show the opposite “temperature” trend to what thermometers show suggesting those trees don’t make a good or accurate alternative to thermometers.
McShane &Wyner tried to create the same graph from the same data, but, as Figure 5 above shows, could not. They conclude:
“Using our model, we calculate that there is a 36% posterior probability that 1998 was the warmest year over the past thousand. If we consider rolling decades, 1997-2006 is the warmest on record; our model gives an 80% chance that it was the warmest in the past thousand years. Finally, if we look at rolling thirty-year blocks, the posterior probability that the last thirty years (again, the warmest on record) were the warmest over the past thousand is 38%.”[page 37]
So, even using Mann’s dubious data and employing a variety of statistical methods, McShane & Wyner’s model suggests that there is only an 80% chance that one recent decade was the warmest of the last 1000 years, and 1998 is most likely not the warmest year [64% against] and the last 30 year period, is also unlikely to have been the warmest [62% against]. In other words, the type of weather we have now has all occurred before, and in the not too distant past when CO2 was supposedly low.
The paper correctly describes the importance of the hockeystick not only to global warming but also Green policies:
“the effort of world governments to pass legislation to cut carbon to pre-industrial levels cannot proceed without the consent of the governed and historical reconstructions from paleoclimatological models [ie hockeysticks] have indeed proven persuasive and effective at winning the hearts and minds of the populace.” [page 2]
It would seem the hearts and minds have been won with false promises.
In recognition of the importance of McShane & Wyner’s paper it was published as an edition discussion piece in Annals of Applied Statistics25 As well as the original paper 15 discussion papers were included in the edition.
Two salient points emerge from this discussion. The first is noted in McIntyre and McKitrick’s comment where they say:
McShane & Wyner’s results are, in a sense, a best case as they assume that the quality of the data set is satisfactory [page 4]
In fact, as noted, the data was not satisfactory. The significance of this is that the ‘science’ of the hockeystick is the data; the data is the proxy for the climatic processes which are analysed in McShane & Wyner’s statistical overview.
This statistical analysis is the second point and it is in this respect that McShane & Wyner are unassailable because they have anticipated every complaint and objection to their critique of Mann’s statistical justification for the hockeystick. As this stage therefore their view on the hockeystick is definitive.
6 McKitrick, McIntyre, Herman26 - The hot spot is really missing
Figure 7. Based on Figures 2 and 3, page 13 of McKitrick et al.
If the IPCC models are right about the feedbacks, we would see a hot spot 10km above the tropics. Global warming theory says this should happen because more water will have been evaporated to this part of the atmosphere and would have caused rapid warming. Observations as shown in Figure 7 contradict this . Thus the main, most powerful factor in the climate models turns out to not match the real world.
Douglass et al 27 pointed out the glaring discrepancy of the missing hot spot in 2007. However Douglass et al did not adequately distinguish model variability in terms of single model or ensemble model outputs. Nor did Douglass et al adjust the data for autocorrelation which meant the data did not have satisfactory confidence levels or error bars.
As a result Santer et al [2008] 28 claimed Douglass got it wrong, and that the data and the models did agree. But Santer et al used a truncated set of data ending in 1999 to achieve the model and data correlation.
Christy et al [2010] 29 responded to Santer et al by developing a scaling ratio comparing the atmospheric trend to the surface trend. Christy et al showed the models predicted a scaling ratio of 1.4 ±0.8 [i.e. the atmosphere should warm 40% faster than the surface]. In reality the observations showed a scaling ratio of 0.8 ± 0.3 [i.e. the atmosphere was not warming as fast as the surface].
McKitrick et al [2010] also use the extended data and addressed the data adjustment issues but used a greater range of statistical analysis. They found that the model predictions are about 4 times higher and outside the error bars of the weather balloons and satellites measurements [see Figure 7].
McKitrick et al’s findings have been replicated by Fu et al 30 who also find a discrepancy between the models and observations about Troposphere warming, although not to the same extent as McKitrick et al do. However, in a follow-up paper, McKitrick 31 not only confirms that the predictions of warming by the models have been exaggerated but also shows the small amount of recent warming was due to a natural climate shift in 1977. This climate shift has been noted by many other researchers 32 and means global warming is playing an even smaller role then predicted by the models.
As noted in section 4, the absence of a tropical hot spot vindicates Miskolczi because either the optical depth is not changing or, if it is, it means that extra water vapor and CO2, which would change the optical depth, are not heating in the way predicted by AGW.
7 Anagnostopoulos, G. G., Koutsoyiannis, D., Christofides, A., Efstratiadis, A. & Mamassis, N.: The only thing certain is the models are wrong.
If McKitrick et al shows that the IPCC global computer models can’t model the present and therefore the future, Professor Demetrius Koutsoyiannis and his team show those models can’t even model the past
Koutsoyiannis is one of the world’s leading hydrologists and an expert on Hurst and stochastic effects. Hurst or Long Term Persistence refers to the uncertainty and random qualities present in all complex natural systems. Koutsoyiannis argues that global warming modeling does not take into account this uncertainty.
In his 2008 paper Koutsoyiannis33 compared the model predictions from 1990 to 2008 and whether those models could retrospectively match the actual temperature over the past 100 years. This test of retrospectivity is called hindcasting. If a model has valid assumptions about the climatic effect of variables such as greenhouse gases, particularly CO2, then the model should be able to match past known data.
Koutsoyiannis’s 2008 paper has not had a peer reviewed rebuttal but was subject to a critique at Real Climate by Gavin Schmidt.34 Schmidt’s criticism was 4-fold; that Koutsoyiannis uses a regional comparison, few models, real temperatures not anomalies and too short a time period.
Each of Schmidt’s criticisms was either wrong or anticipated by Koutsoyiannis. The period from 1990-2008 was the period in which IPCC modeling had occurred; the IPCC had argued that regional effects from global warming would occur; model ensembles were used by Koutsoyiannis; and since the full 100 year temperature and rainfall data was used in intra-annual and 30 year periods by Koutsoyiannis anomalies were irrelevant.
In 2008 Koutsoyiannis found that while the models had some success with the monthly data all the models were “irrelevant with reality” at the 30 year climate scale.
Koutsoyiannis’s 201035 paper “is a continuation and expansion of Koutsoyiannis 2008”. The differences are that (a) Koutsoyiannis 2008 had tested only eight points, whereas 2010 tests 55 points for each variable; (b) 2010 examines more variables in addition to mean temperature and precipitation; and (c) 2010 compares at a large scale in addition to point scale. The large, continental scale in this case is the contiguous US.
Again Koutsoyiannis 2010 found that the models did not hindcast successfully with real data from all the 55 world regions not matching what the models produced. The models were even worse in hindcasting against the real data for the US continent.
So that is 3 strikes for global warming models; they could not predict the future in 1990; they cannot predict the present and they could not replicate or match the past.
Conclusion
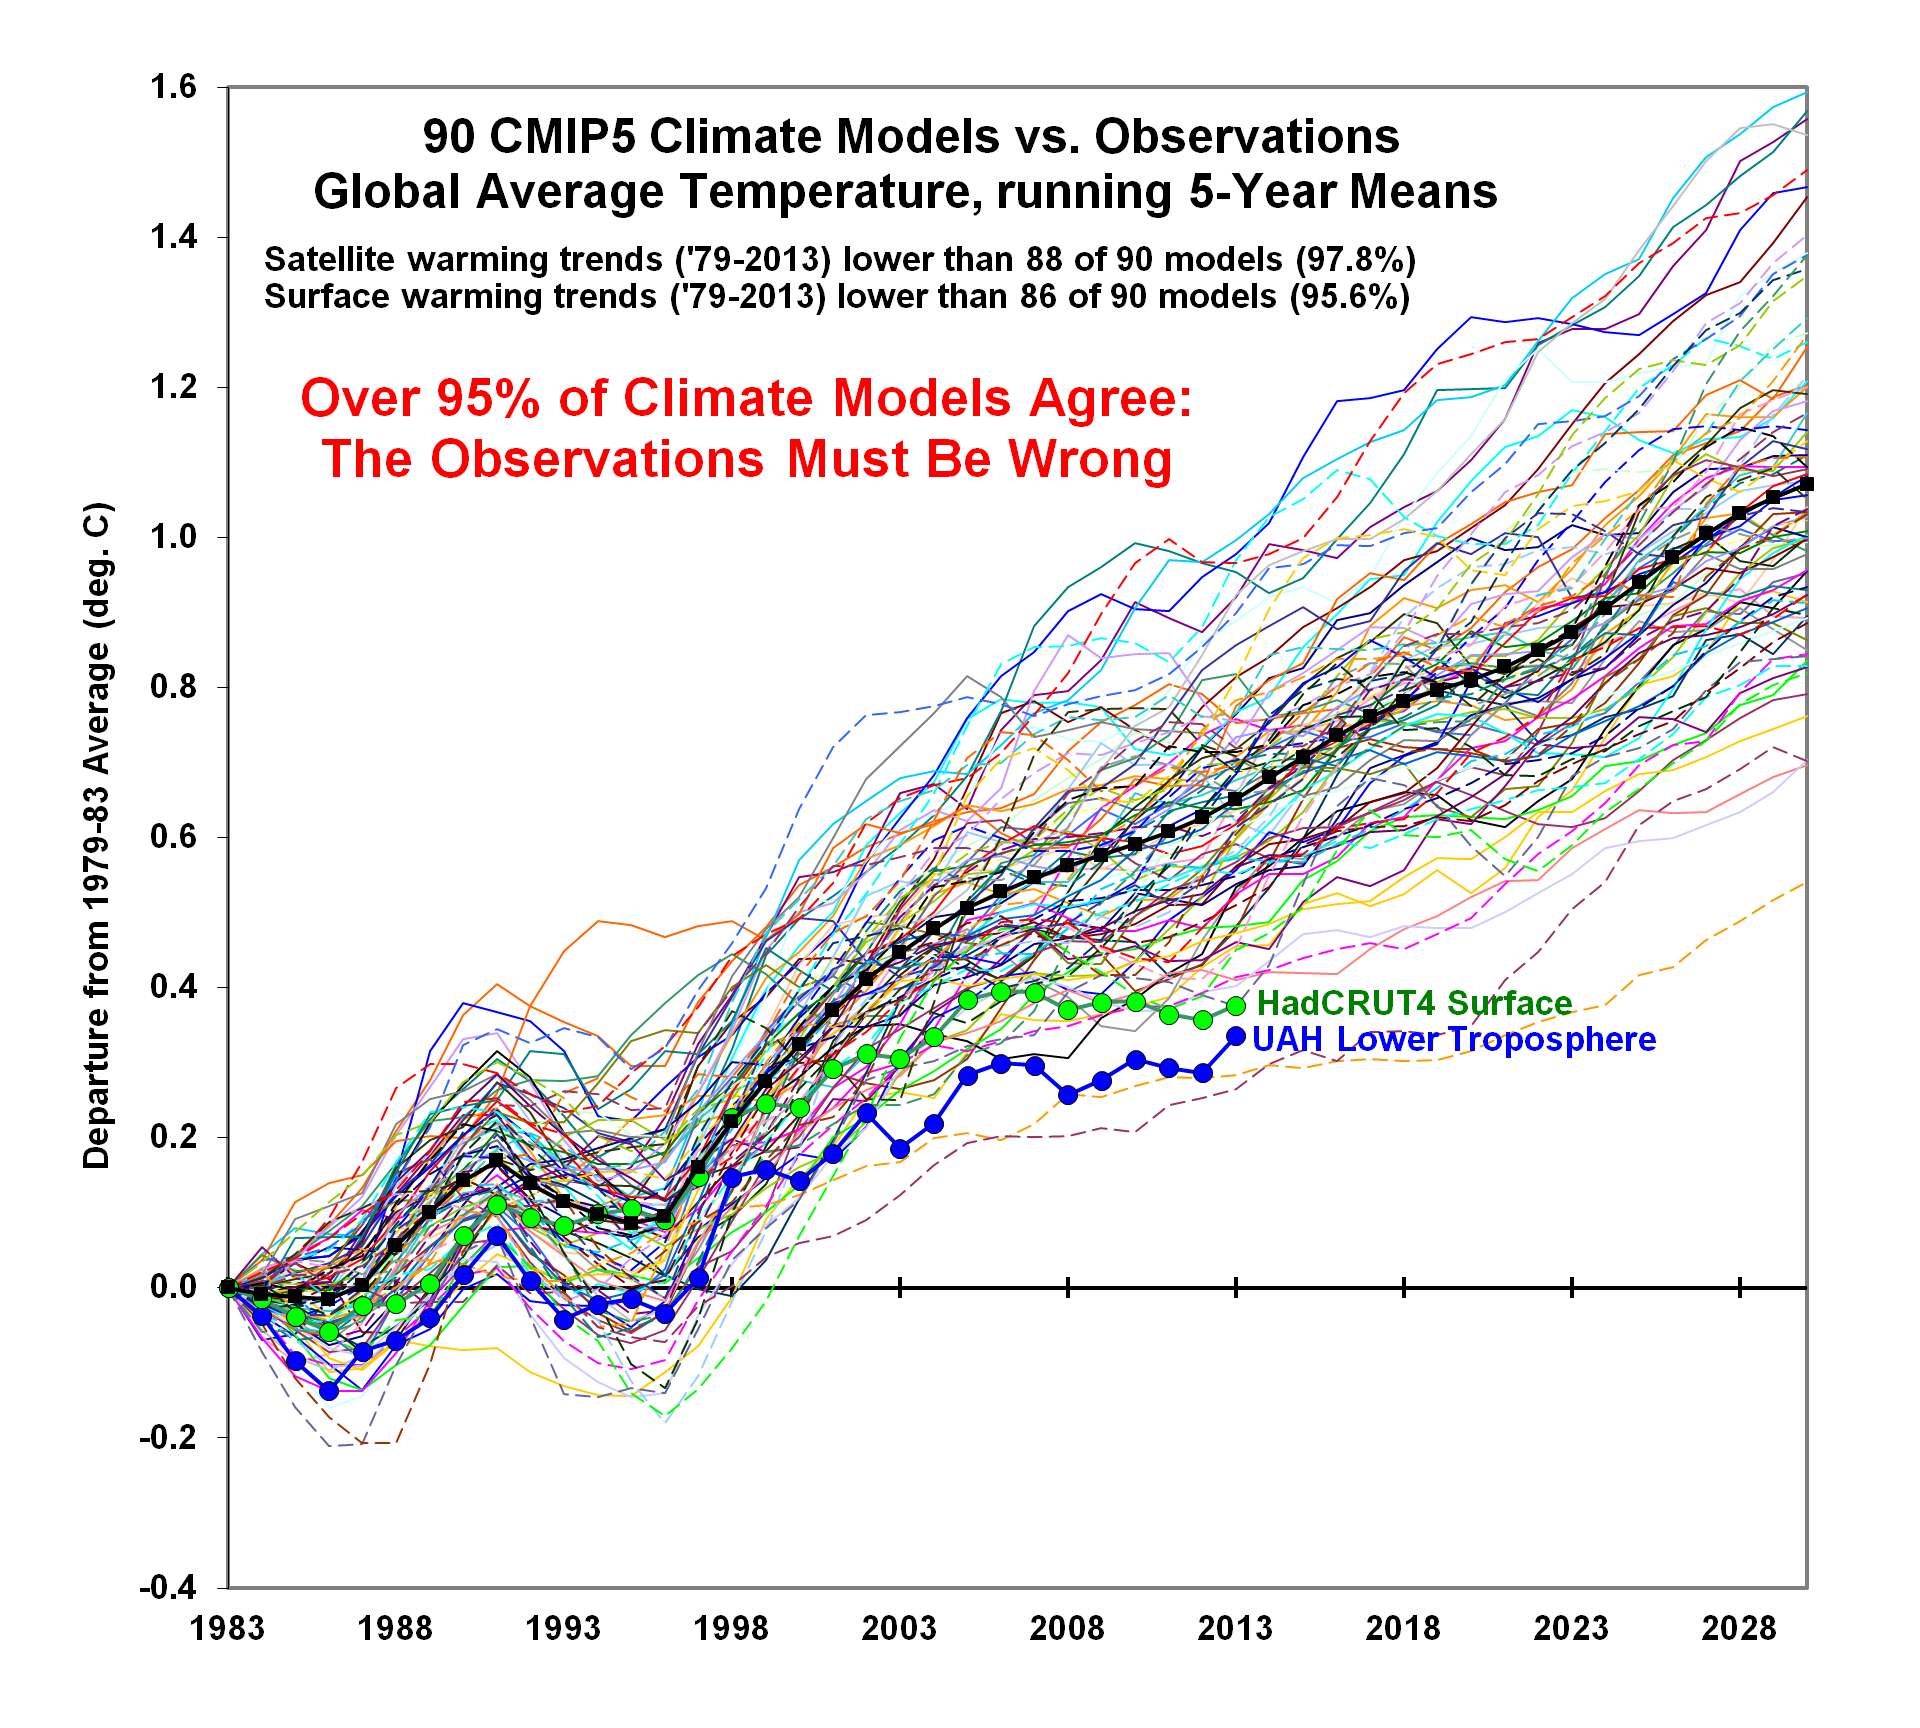
The global warming models amplify CO2’s effect by 3 – 7 fold, but no matter how you measure it [outgoing long wave radiation, cloud changes, optical depth, historical temperatures, vertical heating patterns in the atmosphere] the real measurements contradict the models and their assumptions about the feedbacks appear to be unconnected with real data. It follows that the global warming predictions about climate sensitivity to a doubling of CO2 are exaggerated by at least 3C.
Figure 8 Climate Sensitivity Comparison
The Hansen36 point of 1.2C in Figure 8 is a non-feedback calculation for the temperature increase from a doubling of CO2. While that non-feedback figure is essentially meaningless in the real world it is a convenient half-way house between the climate sensitivity estimates of the IPCC and the models which assume positive feedback and the empirical measurements of the papers discussed in this article which consider the actual measured feedbacks to increases in CO2.
The climate sensitivity estimates of the discussed papers establish two points which are fundamentally opposite to global warming. The first is that a large portion of the temperature response to 2X CO2 has already occurred. CO2 atmospheric concentrations have risen approximately 40% since 1900. Any temperature increase due to the increase in CO2 during this period would have already occurred.
The second point and as a corollary to the first is that there is no delay or lag in temperature response as a proxy for climate sensitivity. The IPCC makes a distinction between transient climate sensitivity and equilibrium climate sensitivity with transient climate sensitivity being less and on a shorter term than equilibrium sensitivity [see AR4, WG 1, TS.6.4.2]. These papers strongly suggest that there is no such distinction between transient and equilibrium sensitivity and that any CO2 temperature response is not delayed. This aspect of climate sensitivity has been independently confirmed in the Beenstock and Reingewertz analysis.37 Beenstock finds that any effect CO2 increase has on temperature is temporary and not related to the absolute level ofCO2.
The global warming predictions are contradicted by past, present and future data. Feynman’s maxim applies and the vast funding which is now being directed to ‘solving’ global warming should be redirected to hypothesis which are consistent with empirical data and confirmed by observable evidence.
References
1. Cox, Anthony and David Stockwell [2011]. The Drum; [Discussion]
2. Nova, Jo, Anthony Cox and Anton Lang [2011]. We can lower Australian CO2 emissions by...(wait for it) building new coal plants!, JoNova blog. [Discussion]
3. Seabrook, Andrea [2007]. Gore Takes Global Warming Message to Congress, NPR [Discussion]
4. Anderegg, William R. L., James W. Prall, Jacob Harold and Stephen H. Schneider [2010]. Expert credibility in climate change, PNAS, 10.1073 [PDF]
5. Andrews, Timothy and Piers M. Foster. [2008] CO2 Forcing Induces Semi-direct Effects with Consequences for Climate Feedback Interpretations, School of Earth and Environment, University of Leeds [PDF]
6. Wielicki, Bruce A, Takmeng Wong, Richard P Allan, Anthony Slingo, Heffery T Kiehl, Brian J Soden, C T Gordon, Alvin J Miller, Shi-Keng Yang, David A Randall, Franklin Robertson, Joel Susskind, Herbert Jacobowitz [2002] Evidence for Large Decadal Variability in the Tropical Mean Radiative Energy Budget, Science, Vol 295 no. 5556 pp 841-844, [Abstract] [Discussion Watts Up With That]
7. Lindzen, R. S. and Y.-S. Choi [2009], On the determination of climate feedbacks from ERBE data, Geophys. Res. Lett., 36, L16705, doi:10.1029/2009GL039628. [Abstract], [PDF] [Discussion]
8. Lindzen, R. and Yong-Sang Choi, [2011] On the Observational Determination of Climate Sensitivity and Its Implications, Asia-Pacific J. Atmos. Sci., 47(4), 377-390, 2011 [PDF]
9. Spencer, R.W., W.D. Braswell, J.R. Christy, J. Hnilo, [2007]. Cloud and radiation budget changes associated with tropical intraseasonal oscillations. Geophysical Research Letters, 34, L15707, doi:10.1029/2007/GL029698. [PDF] [Discussion]
10. Spencer, R., and W.D. Braswell. [2008]. Potential biases in feedback diagnosis from observations data: a simple model demonstration. Journal of Climate, 21, 5624-5628. [PDF]
11. Spencer, Roy W. and William D. Braswell [2010], On the diagnosis of radiative feedback in the presence of unknown radiative forcing. Journal of Geophysical research, vol. 115D16109, doi:10.1029/2009JD013371,. [PDF]
12. The Climate Process Team on Low-Latitude Cloud Feedbacks on Climate Sensitivity [cloud CPT], 2011, [Newsletter]
13. Allan, R [2011] Combining satellite data and models to estimate cloud radiative effects at the surface and in the atmosphere. University of Reading [Abstract] [Discussion]
14. Spencer, R. W.; W.D. Braswell, [2011] On the Misdiagnosis of Climate Feedbacks from Variations in Earth’s Radiant Energy Balance, Remote Sens. 2011, 3, 1603-1613. [PDF]
15. von Schuckmann, K., F. Gaillard and P.-Y. Le Traon [2009] Global hydrographic variability patterns during 2003-2008. J. Geophys. Res., 114, C09007, doi:10.1029/2008JC005237 [Abstract] [Discussion]
16. Meehl, Gerald A., Julie M. Arblaster, John T. Fasullo, Aixue Hu and Kevin E. Trenberth [2011] Model-based evidence of deep-ocean heat uptake during surface-temperature hiatus periods. Nature Climate Change doi:10.1038/nclimate1229 [Letter]
17. Ablain, M., A. Cazenave, G. Valladeau and S. Guinehut [2009] A new assessment of global mean sea level from altimeters highlights a reduction of global trend from 2005 to 2008: M. Ablain, A. Cazenave, G. Valladeau and S. Guinehut Ocean Sci. Discuss., 6, 31–56, [PDF]
18. Cazenave, A., K. Dominh, S. Guinehut, E. Berthier, W. Llovel, G. Ramillien, M. Ablain, G. Larnicol. Sea level budget over 2003-2008 [2009] A reevaluation from GRACE space gravimetry, satellite altimetry and ARGO: Author manuscript, published in "Global and Planetary Change 65, 1-2 (2009) 83-88"
DOI : 10.1016/j.gloplacha.2008.10.004 [PDF]
19. Knox, R. S. and D. H. Douglass [2010] Recent energy balance of Earth: R. S. Knox and D. H. Douglass International Journal of Geosciences, 2010, vol. 1, no. 3 (November) – In press doi:10.4236/ijg2010.00000 Published Online 2010 [PDF]
20. Miskolczi, Ferenc M. [2007] Greenhouse effect in semi-transparent planetary atmospheres. Idojaras Quarterly Journal of the Hungarian Meteorological Service Vol. 111, No. 1, January–March 2007, pp. 1–40 [PDF]
21. Miskolczi, Ferenc M. [2010] The Stable Stationary Value of the Earth’s Global Average Atmospheric Planck-Weighted Greenhouse-Gas Optical Thickness. Energy & Environment Vol. 21, No. 4, 2010 pp 243-263 [PDF and Discussion]
22. Miskolczi, Ferenc M. and Martin G. Mlynczak [2004] The greenhouse effect and the spectral decomposition of the clear-sky terrestrial radiation. Idojaras Quarterly Journal of the Hungarian Meteorological Service Vol. 108, No. 4, October–December 2004, pp. 209–251 [PDF]
23. Paltridge, Garth, Albert Arking and Michael Pook [2009] Trends in middle- and upper –level tropospheric humidity from NCEP reanalysis data, Theor Appl Climatol (2009) 98:351–359 DOI 10.1007/s00704-009-0117-x [PDF]
24. McShane, Blakely B. and Abraham J. Wyner [2010] A Statistical Analysis of Multiple Temperature Proxies: Are Reconstructions of Surface Temperatures Over the Last 1000 Years Reliable? The Annals of Applied Statistics 2011, Vol. 5, No. 1, 5–44 DOI: 10.1214/10-AOAS398 [PDF]
25. Watts, Anthony 2010 Watts Up With That [Discussion]
26. McKitrick, R., S. McIntyre, and C. Herman, [2010], Panel and multivariate methods for tests of trend equivalence in climate data series. Atmospheric Science Letters, 11: 270–277. doi: 10.1002/asl.290 [PDF]
27. Douglass, David H., John R. Christy, Benjamin D. Pearson, S. Fred Singer [2007] A Comparison of tropical temperature trends with model predictions, Int. J. Climatol.(2007) Published online in Wiley InterScience (www.interscience.wiley.com) DOI: 10.1002/joc.1651 [PDF]
28. Santer, B. D., P. W. Thorne, L. Haimberger, K. E Taylor, T. M Wigley,. L. Lanzante, J. R. Solomon, M. Free, P. J Gleckler, P. D. Jones, T. R Karl, S. A. Klein, C. Mears, D. Nychka, G. A. Schmidt, S. C. Sherwood and F. J. Wentz [2008], Consistency of modelled and observed temperature trends in the tropical troposphere. International Journal of Climatology, 28: 1703–1722. doi: 10.1002/joc.1756 [Abstract]
29. Christy J.R., B. Herman, R. Pielke, Sr., P. Klotzbach, R.T. McNide, J.J. Hnilo, R.W.Spencer, T. Chase, and D.Douglass: (2010), What Do Observational Datasets Say about Modeled Tropospheric Temperature Trends since 1979? Remote Sensing 2010, 2, 2148-2169; doi:10.3390/rs2092148 [PDF]
30. Fu, Q; S.Manabe, and C. Johanson [2011], On the warming in the tropical upper troposphere: Models vs observations, Geophysical Research Letters, Vol. 38, L15704, doi:10.1029/2011GL048101, 2011 [PDF] [Discussion]
31. McKitrick, Ross and Timothy J. Vogelsang [2011], Multivariate trend comparisons between autocorrelated climate series with general trend regressors, Department of Economics, University of Guelph. [Discussion paper PDF]
32. Stockwell, David R. B. and Anthony Cox, [2009], Structural break models of climatic regime-shifts: claims and forecasts, Cornell University Library, arXiv10907.1650 [2009] [PDF]
33. Koutsoyiannis, D., N. Mamassis, A. Christofides, A. Efstratiadis, S.M. Papalexiou [2008], Assessment of the reliability of climate predictions based on comparisons with historical time series, European Geosciences Union General Assembly 2008 Vienna, Austria, 13 18 April 2008 Session IS23: Climatic and hydrological perspectives on long term changes [PDF and Presentation]
35. Anagnostopoulos, G. G., D. Koutsoyiannis, A. Christofides, A. Efstratiadis, and N. Mamassis, [2010] 'A comparison of local and aggregated climate model outputs with observed data', Hydrological Sciences Journal, 55: 7, 1094 — 1110 [PDF]
36. Hansen J., A. Lacis, D. Rind, G. Russell, P. Stone, I. Fung, R. Ruedy and J. Lerner, [1984] Climate sensitivity: Analysis of feedback mechanisms. In Climate Processes and Climate Sensitivity, AGU Geophysical Monograph 29, Maurice Ewing Vol. 5. J.E. Hansen and T. Takahashi, Eds. American Geophysical Union, pp. 130-163 [Abstract with PDF attached]
37. Beenstock, Michael and Yaniv Reingenertz [2009] Polynomial Cointegration Tests of the Anthropogenic Theory of Global Warming Department of Economics, The Hebrew University, Mount Scopus, Israel. [PDF]

.png)


