Showing posts sorted by relevance for query water vapor declined. Sort by date Show all posts

Wednesday, March 6, 2013

Man-made global warming theory is falsified by satellite water vapor observations

Reblogged from Clive Best and Ken Gregory at Friends of Science.org:


Water Vapor Decline Cools the Earth: NASA Satellite Data

by Ken Gregory P.Eng., Friends of Science.org

An analysis of NASA satellite data shows that water vapor, the most important greenhouse gas, has declined in the upper atmosphere causing a cooling effect that is 16 times greater than the warming effect from man-made greenhouse gas emissions during the period 1990 to 2001.
The world has spent over $ 1 trillion on climate change mitigation based on climate models that don’t work. They are notoriously poor at simulating the 20th century warming because they do not include natural causes of climate change – mainly due to the changing sun -  and they grossly exaggerate the feedback effects of greenhouse gas emissions.
Most scientists agree that doubling the amount of carbon dioxide (CO2) in the atmosphere, which takes about 150 years, would theoretical warm the earth by one degree Celsius if there were no change in evaporation, the amount or distribution of water vapor and clouds. Climate models amplify the initial CO2 effect by a factor of three by assuming positive feedbacks from water vapor and clouds, for which there is little direct evidence. Most of the amplification by the climate models is due to an increase in upper atmosphere water vapor.
The Satellite Data
The NASA water vapor project (NVAP) uses multiple satellite sensors to create a standard climate dataset to measure long-term variability of global water vapor. NASA recently released the Heritage NVAP data which gives water vapor measurement from 1988 to 2001 on a 1 degree by 1 degree grid, in three vertical layers.1 The NVAP-M project, which is not yet available, extends the analysis to 2009 and gives five vertical layers. Water vapor content of an atmospheric layer is represented by the height in millimeters (mm) that would result from precipitating all the water vapor in a vertical column to liquid water. The near-surface layer is from the surface to where the atmospheric pressure is 700 millibar (mb), or about 3 km altitude. The middle layer is from 700 mb to 500 mb air pressure, or from 3 km to 6 km attitude. The upper layer is from 500 mb to 300 mb air pressure, or from 6 km to 10 km altitude.
The global annual average precipitable water vapor by atmospheric layer and by hemisphere from 1988 to 2001 is shown in Figure 1.
The graph is presented on a logarithmic scale so the vertical change of the curves approximately represents the forcing effect of the change. For a steady earth temperature, the amount of incoming solar energy absorbed by the climate system must be balanced by an equal amount of outgoing longwave radiation (OLR) at the top of the atmosphere. An increase of water vapor in the upper atmosphere would temporarily reduce the OLR, creating a forcing of more incoming than outgoing energy, which raises the temperature of the atmosphere until the balance is restored.
NVAP_pwv
Figure 1.  Precipitable water vapor by layer, global and by hemisphere.
The graph shows a significant percentage decline in upper and middle layer water vapor from 1995 to 2001. The near-surface layer shows a smaller percentage increase, but a larger absolute increase in water vapor than the other layers. The upper and middle layer water vapor decreases are greater in the Southern Hemisphere than in the Northern Hemisphere.
Table 1 below shows the precipitable water vapor for the three layers of the Heritage NVAP and the CO2 content for the years 1990 and 2001, and the change.
LayerL1 near-surfaceL2 middleL3 upperSumCO2
1013-700700-500500-300
mmmmmmmmppmv
199018.994.61.4925.08354.16
200120.724.030.9425.69371.07
change1.73-0.57-0.550.6116.91
Table 1.  Heritage NVAP 1990 and 2001 water vapour and CO2.
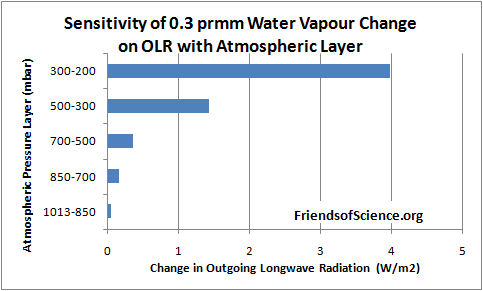
Dr. Ferenc Miskolczi performed computations using the HARTCODE line-by-line radiative code to determine the sensitivity of OLR to a 0.3 mm change in precipitable water vapor in each of 5 layers of the NVAP-M project. The program uses thousands of measured absorption lines and is capable of doing accurate radiative flux calculations.  Figure 2 shows the effect on OLR of a change of 0.3 mm in each layer.
The results show that a water vapor change in the 500-300 mb layer has 29 times the effect on OLR than the same change in the 1013-850 mb near-surface layer. A water vapor change in the 300-200 mb layer has 81 times the effect on OLR than the same change in the 1013-850 mb near-surface layer.
OLR_PWV_bar
Figure 2. Sensitivity of 0.3 mm precipitable water vapor change on outgoing longwave radiation by atmospheric layer.
Table 2 below shows the change in OLR per change in water vapor in each layer, and the change in OLR from 1990 to 2001 due to the change in precipitable water vapor (PWV).
L1L2L3SumCO2
OLR/PWVW/m2/mm-0.329-1.192-4.75
OLR/CO2W/m2/ppmv-0.0101
OLR changeW/m2-0.5690.6792.6132.723-0.171
Table 2.  Change of OLR by layer from water vapor and from CO2 from 1990 to 2001.
The calculations show that the cooling effect of the water vapor changes on OLR is 16 times greater than the warming effect of CO2 during this 11-year period. The cooling effect of the two upper layers is 5.8 times greater than the warming effect of the lowest layer.
These results highlight the fact that changes in the total water vapor column, from surface to the top of the atmosphere, is of little relevance to climate change because the sensitivity of OLR to water vapor changes in the upper atmosphere overwhelms changes in the lower atmosphere.
The precipitable water vapour by layer versus latitude by one degree bands for the year 1991 is shown in Figure 3. The North Pole is at the right side of the figure. The water vapor amount in the Arctic in the 500 to 300 mb layer goes to a minimum of 0.53 mm at 58.5 degrees North, then increases to 0.94 mm near the North Pole.
Nvap_lpw_1991
Figure 3. Precipitable water vapor by layer in 1991.
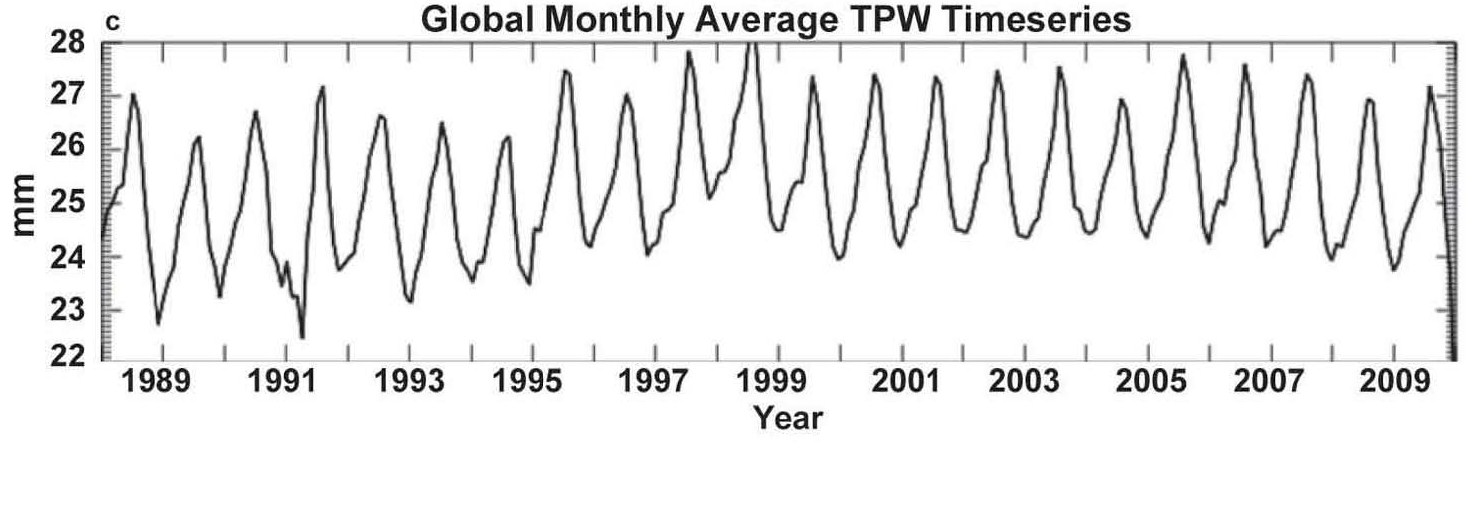
The NVAP-M project extends the analysis to 2009 and reprocesses the Heritage NVAP data. This layered data is not publicly available. The total precipitable water (TPW) data is shown in Figure 4, reproduced from the paper Vonder Haar et al (2012) here. There is no evidence of increasing water vapor to enhance the small warming effect from CO2.
fig4c_tpw
Figure 4. Global month total precipitable water vapor NVAP-M.
The Radiosonde Data
Water vapor humidity data is measured by radiosonde (on weather balloons) and by satellites.  The radiosonde humidity data is from the NOAA Earth System Research Laboratory here.
GlobalRelativeHumidity300_700mb
Figure 5. Global relative humidity, middle and upper atmosphere, from radiosonde data, NOAA Earth System Research Laboratory.
A graph of the global average annual relative humidity (RH) from 300 mb to 700 mb is shown in Figure 5. The specific humidity in g/kg of moist air at 400 mb (8 km) is shown in Figure 6. It shows that specific humidity has declined by 14% since 1948 using the best fit line.
SH400mb
Figure 6.  Specific humidity at 400 mb pressure level
In contrast, climate models all show RH staying constant, implying that specific humidity is forecast to increase with warming. So climate models show positive feedback and rising specific humidity with warming in the upper troposphere, but the data shows falling specific humidity and negative feedback.
Many climate scientists dismiss the radiosonde data because of changing instrumentation and the declining humidity conflicts with the climate model simulations. However, the radiosonde instruments were calibrated and the data corrected for changes in response times. The data before 1960 should be regarded as unreliable due to poor global coverage and inferior instruments. The near surface radiosonde measurements from 1960 to date show no change in relative humidity which is consistent with theory. Both the satellite and radiosonde data shows declining upper atmosphere humidity, so there is no reason to dismiss the radiosonde data. The radiosonde data only measures humidity over land stations, so it is interesting to compare to the satellite measurements which have global coverage.
Comparison Between Radiosonde and Satellite Data
The specific humidity radiosonde data was converted to precipitable water vapor for comparison with the satellite data. Figure 7 compares the satellite data to the radiosonde data for the years 1988 to 2001.
PW_NOAA&NVAP
Figure 7. Comparison between NOAA radiosonde and NVAP satellite derived precipitable water vapor.
The NOAA and NVAP data compares very well for the period 1988 to 1995. The NVAP satellite data shows less water vapor in the upper and middle layers than the NOAA data. In 2000 and 2001 the NVAP data shows more water vapor in the near-surface layer than the NOAA data. The vertical change on the logarithmic graph is roughly equal to the forcing effect of each layer, so the NVAP data shows water vapor has a greater cooling effect than the radiosonde data.
The Tropical Hot Spot
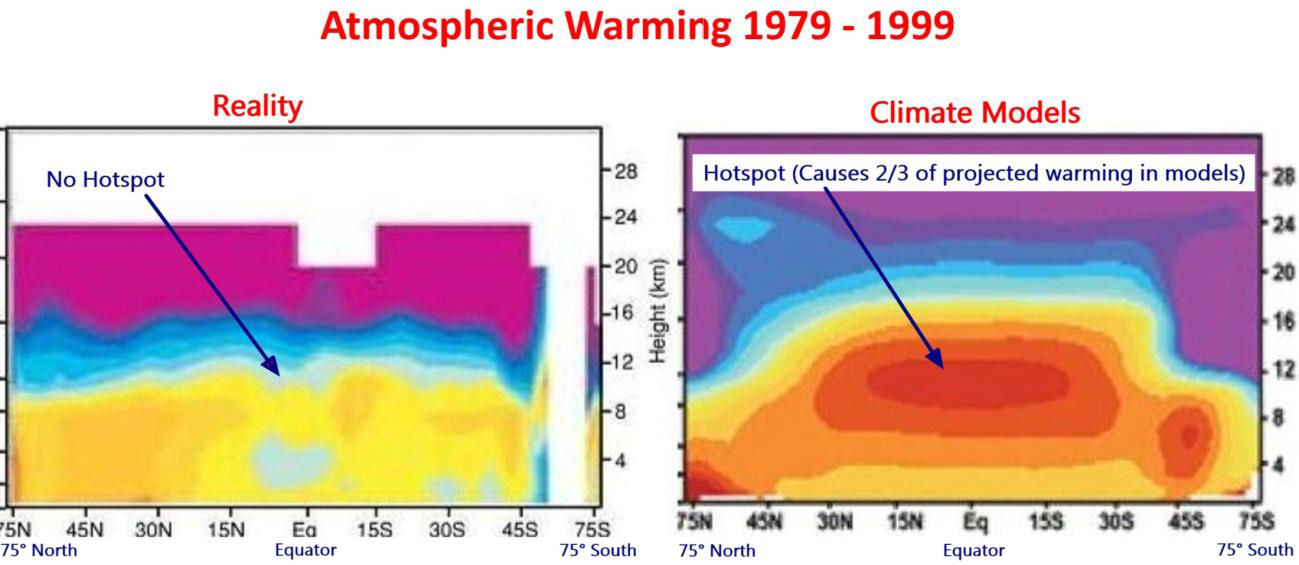
The models predict a distinctive pattern of warming – a “hot-spot” of enhanced warming in the upper atmosphere at 8 km to 13 km over the tropics, shown as the large red spot in Figure 8. The temperature at this “hot-spot” is projected to increase at a rate of two to three times faster than at the surface. However, the Hadley Centre’s real-world plot of radiosonde temperature observations from weather balloons shown below does not show the projected hot-spot at all. The predicted hot-spot is entirely absent from the observational record. If it was there it would have been easily detected.
The hot-spot is forecast in climate models due to the theory that the water vapor profile in the tropics is dominated by the moist adiabatic lapse rate, which requires that water vapor increases in the upper atmosphere with warming. The moist adiabatic lapse rate describes how the temperature of a parcel of water-saturated air changes as it move up in the atmosphere by convection such as within a thunder cloud. A graph here shows two lapse rate profiles with a larger temperature difference in the upper atmosphere than at the surface. The projected water vapor increase creates the hot-spot and is responsible for half to two-thirds of the surface warming in the IPCC climate models.
Hot_spot
Figure 8. Climate models predict a hot spot of enhanced warming rate in the tropics, 8 km to 13 km altitude. Radiosonde data shows the hot spot does not exist. Red indicates the fastest warming rate. Source: http://joannenova.com.au
The projected upper atmosphere water vapor trends and temperature amplification at the hot-spot are intricately linked in the IPCC climate theory. The declining upper atmosphere humidity is consistent with the lack of a tropical hot spot, and both observations prove that the IPCC climate theory is wrong.
A recent technical paper Po-Chedley and Fu (2012) here compares the temperature trends of the lower and upper troposphere in the tropics from satellite data to the climate model projections from the period 1981 to 2008.2 The upper troposphere is the part of the atmosphere where the pressure ranges from 500 mb to 100 mb, or from about 6 km to 15 km. The paper reports that the warming trend during 1981 to 2008 in the upper troposphere simulated by climate models is 1.19 times the simulated warming trend of the lower atmosphere in the tropics.  (Note this comparison is to the lower atmosphere, not the surface, and includes 10 years of no warming to 2008.) Using the most current version (5.5) of the satellite temperature data from the University of Alabama in Huntsville (UAH), the warming trend of the upper troposphere is only 0.973 of the lower troposphere in the tropics for the same period. This is different from that reported in the paper because the authors used an obsolete version (5.4) of the data. The satellite data shows not only a lack of a hot-spot, it shows a cold-spot just where a hot-spot was predicted.
Conclusion
Climate models predict upper atmosphere moistening which triples the greenhouse effect from man-made carbon dioxide emissions. The new satellite data from the NASA water vapor project shows declining upper atmosphere water vapor during the period 1998 to 2001. It is the best available data for water vapor because it has global coverage. Calculations by a line-by-line radiative code show that upper atmosphere water vapor changes at 500 mb to 300 mb have 29 times greater effect on OLR and temperatures than the same change near the surface. The cooling effect of the water vapor changes on OLR is 16 times greater than the warming effect of CO2 during the 1990 to 2001 period. Radiosonde data shows that upper atmosphere water vapor declines with warming. The IPCC dismisses the radiosonde data as the decline is inconsistent with theory. During the 1990 to 2001 period, upper atmosphere water vapor from satellite data declines more than that from radiosonde data, so there is no reason to dismiss the radiosonde data. Changes in water vapor are linked to temperature trends in the upper atmosphere. Both satellite data and radiosonde data confirm the absence of any tropical upper atmosphere temperature amplification, contrary to IPCC theory. Four independent data sets demonstrate that the IPCC theory is wrong. CO2 does not cause significant global warming.
Note 1. The NVAP data in Excel format is here.
Note 2.  The lower troposphere data is: http://www.nsstc.uah.edu/public/msu/t2lt/uahncdc.lt
The upper troposphere data is calculated as 1.1 x middle troposphere – 0.1 x lower stratosphere; where middle troposphere is: http://www.nsstc.uah.edu/public/msu/t2/uahncdc.mt and the lower stratosphere is:http://www.nsstc.uah.edu/public/msu/t4/uahncdc.ls

Wednesday, November 5, 2014

New paper finds no long-term trend in stratospheric water vapor, IPCC claims opposite

A paper published today in the Journal of Geophysical Research Atmospheres by Andrew Dessler et al finds "little evidence for a long-term trend in water entering the stratosphere through the tropical tropopause layer over the past three decades."


And a 2010 paper by Susan Solomon et al is one [#7] of the 57 excuses for the 18+ year "pause" in global warming:
"Stratospheric water vapor concentrations decreased by about 10% after the year 2000. Here we show that this acted to slow the rate of increase in global surface temperature over 2000–2009 by about 25% compared to that which would have occurred due only to carbon dioxide and other greenhouse gases. More limited data suggest that stratospheric water vapor probably increased between 1980 and 2000, which would have enhanced the decadal rate of surface warming during the 1990s by about 30% as compared to estimates neglecting this change. These findings show that stratospheric water vapor is an important driver of decadal global surface climate change."
In opposition, the modeling paper below shows increases of CO2 and water vapor in the stratosphere act as cooling agents, not warming agents, by increasing the radiative surface area to space.

So, take your pick of the settled science:
  • IPCC says there are long-term increases in stratospheric water vapor that are having a significant warming effect
  • Dessler says there is no long-term trend in stratospheric water vapor 
  • Solomon says decreased stratospheric water vapor is the cause for the "pause"
  • The modeling paper below finds increased stratospheric water vapor acts as a cooling, not warming, agent, contradicting the warming claims of the IPCC and Solomon. 
  • IPCC claims CO2 acts as the "control knob" of water vapor concentrations, but if that was true, there would not have been a 10% decrease in stratospheric water vapor 2000-2009 as claimed by Solomon above and there would be a long-term positive trend, not found by Dessler
  • Tropospheric water vapor has been on a long-term declining trend, and is the source of all stratospheric water vapor as noted by Dessler above. However, if tropospheric water vapor has declined, how could stratospheric water vapor increase 1980-2000 according to Solomon, or have a "long-term increase" according to the IPCC, or have no long-term trend according to Dessler?
All mutually exclusive, but certainly not unprecedented for the settled climate science

Excerpt from prior post:

3. Stratospheric cooling rates:  The picture shows how water, carbon dioxide and ozone contribute to longwave cooling in the stratosphere.   Colours from blue through red, yellow and to green show increasing cooling, grey areas show warming of the stratosphere.  The tropopause is shown as dotted line (the troposphere below and the stratosphere above).  For CO2 it is obvious that there is no cooling in the troposphere [or warming!], but a strong cooling effect in the stratosphere.  Ozone, on the other hand, cools the upper stratosphere but warms the lower stratosphere.  Figure from: Clough and Iacono, JGR, 1995; adapted from the SPARC Website.  Please click to enlarge! (60 K)  [Source] [Rebuttal] [Ozone O3 is shown as a cooling agent in the upper stratosphere, but a warming agent in the upper troposphere to lower stratosphere]
Note the scale at right side of graph indicates cooling rates and show water vapor is a cooling agent throughout the troposphere and stratosphere [only the brown colors indicate warming]. Also note that the computer-model output above demonstrates that CO2 is a very strong cooling agent in the stratosphere and CO2 is neither a cooling or warming agent of the troposphere [indicated by the light blue at the CO2 primary wavenumber at ~700 cm-1, or ~15um]. The modeled output shows CO2 to have a tiny blip of slight warming effect [light gray] at the tropopause [shown by dotted horizontal line], but clearly the net effect of CO2 shown in this diagram from the surface to the stratosphere is cooling, not warming.


Variations of stratospheric water vapor over the past three decades

A.E. Dessler et al

We examine variations in water vapor in air entering the stratosphere through the tropical tropopause layer (TTL) over the past three decades in satellite data and in a trajectory model. Most of the variance can be explained by three processes that affect the TTL: the quasi-biennial oscillation [which may be controlled by solar activity], the strength of the Brewer-Dobson circulation, and the temperature of the tropical troposphere. When these factors act in phase, significant variations in water entering the stratosphere are possible. We also find that volcanic eruptions, which inject aerosol into the TTL, affect the amount of water entering the stratosphere. While there is clear decadal variability in the data and models, we find little evidence for a long-term trend in water entering the stratosphere through the TTL [tropical tropopause layer] over the past 3 decades.

Saturday, April 23, 2011

NASA keeps mum on data that could disprove anthropogenic global warming theory

The theory of anthropogenic global warming is based upon the notion that increases in the minor greenhouse gas CO2 result in increases of the major greenhouse gas water vapor, thereby supposedly increasing global warming to alarming levels of 2-5C per doubling of CO2 levels. Without this assumed and unproven positive feedback from water vapor, there is no basis for alarm. While the IPCC confidently stated in their 2007 report,
“The average atmospheric water vapour content has increased since at least the 1980s over land and ocean as well as in the upper troposphere. The increase is broadly consistent with the extra water vapour that warmer air can hold.”
a 2005 paper based on the NASA water vapor data set [called NVAP] showed that water vapor levels had instead declined (with 95% confidence) between 1988-1999. The paper states,
“By examining the 12 year record [1988-1999], a decrease of TPW [total precipitable water vapor] at a rate of -0.29 mm / decade is observed. This relationship is significant at the 95 % but not at the 99 % level [since when do climate scientists insist on a 99% confidence level?]. A downward trend would be intriguing since there should be a positive slope if a global warming signal was present."
If the trend in water vapor is negative instead of positive, there is no positive feedback from water vapor and the theory of catastrophic anthropogenic global warming would be falsified. Climate scientist Dr. Roger Pielke Sr. notes that the NASA  findings "conflict with the conclusion of the 2007 IPCC report." NASA has not released an update of this extremely important NVAP water vapor data for the past 10 years and does not plan to release the data from 2001 through 2010 or the "reanalyzed" 1988-2001 data until "sometime in 2012 or 2013."  However, an online NASA NVAP annual report dated 3/15/11 shows the telling "PRELIMINARY RESULT, NOT FOR DISTRIBUTION" of a continued decline in atmospheric water vapor:
Lower series is over land & ocean, upper series is ocean only
While most NASA data is made available on the internet within a few months of collection and analysis, for some reason NASA NVAP water vapor data -which could either support or undermine the theory of catastrophic anthropogenic global warming- is not going to be officially released for up to 12 years since collection. Is it too much to ask that NASA finishes its analysis and releases this data before the world spends trillions on a potentially non-existent problem?

From a 2003 NASA NVAP poster showing water vapor anomalies over ocean through 2000

From the same 2003 poster
Global precipitation (an indicator of water vapor) is also not increasing as predicted by AGW theory

Related: Paper: Water vapor feedback is negative, not positive as assumed by IPCC alarmists

http://hockeyschtick.blogspot.com/2011/02/teleconference-will-attempt-to-explain.html

Thursday, April 18, 2013

New data falsifies basis of man-made global warming alarm, shows water vapor feedback is negative

Physicist Clive Best has analyzed the latest NASA satellite and radiosonde data to find that global water vapor has declined despite the consensus belief among climate scientists that it would rise in response to man-made carbon dioxide. Dire predictions of global warming all rely on positive feedback from water vapor. The argument goes that as surface temperatures rise so more water will evaporate from the oceans thereby amplifying temperatures because H2O itself is a strong greenhouse gas. The fact that water vapor has instead declined indicates water vapor feedback is negative, overwhelming alleged warming from CO2, and accounting for the stall in global temperatures over the past 16+ years. As Dr. Best notes, "All climate models (that I am aware of) predict exactly the opposite. Something is clearly amiss with theory. Is it not now time for “consensus” scientists to have a rethink?"

Prior posts on negative feedback from water vapor


H2O decreasing while CO2 rises !


Dire predictions of global warming all rely on positive feedback from water vapor. The argument goes that as surface temperatures rise so more water will evaporate from the oceans thereby amplifying temperatures because H2O itself is a strong greenhouse gas. Climate models all assume net amplification factors of between 1.5 and 6. Has the water content of the atmosphere actually been increasing as predicted?

NASA have just released their latest NVAP-M survey of global water content derived from satellite data and radio-sondes over the period from 1988 to 2009. This new data is explicitly intended for climate studies . So lets take a look at the comparison between actual NVAP-M atmospheric H2O levels and those of CO2 as measured at Mauna Loa. I have extracted all the daily measurement NVAP-M data and then calculated the global average. Figure 1 shows the running 30 day average of all the daily data recorde between 1988 and 2009 inclusive. The 365 day (yearly) running average is also shown. Plotted on the right hand scale are the Mauna Loa CO2 concentration data in red over the same period.


Fig1: Total precipitative H2O (running 30 day average) compared to Mauna Loa CO2 data in red. The central black curve is a running 365 day average.

There is indeed some correlation in the data from 1988 until 1998, but thereafter the two trends diverge dramatically. Total atmospheric water content actually falls despite a relentless slow rise in CO2. This fall in atmospheric H2O also coincides with the observed stalling of global temperatures for the last 16 years. All climate models (that I am aware of} predict exactly the opposite. Something is clearly amiss with theory. Is it not now time for “consensus” scientists to have a rethink?


Thanks to Ken Gregory for providing me the data. The conversion from NetCDF was a bit of a nightmare!


NASA NVAP-M data is available here. Thanks to NASA Water Vapor Project-Measures (NVAP-M) team.

Monday, July 16, 2012

New paper shows IPCC models exaggerate warming from water vapor

Global monthly average total precipitable water vapor
The theory of global warming claims that a trivial warming from CO2 levels will result in more water vapor in the atmosphere and an alleged 'runaway greenhouse effect'. However, satellite observations published in a new paper show that global water vapor has instead declined over the past 12 years despite steadily rising concentrations of CO2. These observations provide further support that the positive water vapor feedback in IPCC models is overstated and therefore claims of future warming greatly exaggerated. 


Climate scientist Roger Pielke Sr. comments on the new paper:

However, the figure [above], if it turns about to be robust, raises fundamental issues with respect to the ability of global climate models to skillfully model the role of humans in altering the climate. Indeed, the Vonder Haar et al 2012 provides further support to the conclusion by De-Zheng Sun in the paper 
Sun, D.-Z., Y. Yu, and T. Zhang, 2009: Tropical Water Vapor and Cloud Feedbacks in Climate Models: A Further Assessment Using Coupled Simulations.J. Climate22, 1287-1304 
that I posted on in
Tropical Water Vapor and Cloud Feedbacks in Climate Models: A Further Assessment Using Coupled Simulations by De-Zheng Sun, Yongqiang Yu, and Tao ZhangAs part of their conclusions, they wrote
“The extended calculation using coupled runs confirms the earlier inference from the AMIP runs that underestimating the negative feedback from cloud albedo and overestimating the positive feedback from the greenhouse effect of water vapor over the tropical Pacific during ENSO is a prevalent problem of climate models. 
While De-Zheng was reluctant to relate his findings to multi-decadal global climate model simulations of the role of humans in the climate system, the new Vonder Haar et al 2012 paper provides further support that the water vapor feedback is overstated by the IPCC models.
Related: posts on water vapor as a negative feedback

Monday, December 16, 2013

Climate scientists 'can only reliably model cloud cover a few hours into the future'

...and a mere 1-2% difference in cloud cover is all that is needed to cause either global warming or global cooling.


A Better Answer to Climate Change Is Hidden in the Clouds


Climate scientists are studying a bewildering array of changes taking place in the air, on land and in the sea. But where should they concentrate their efforts? First and foremost, it seems, are clouds. Better understanding of how clouds affect global warming, and how airborne particles affect cloud formation, is one of three gaps in knowledge that could most improve predictions of how extensively and quickly Earth’s climate will change.
So say three experts who played a major role in writing the latest climate assessment report published in late September by the Intergovernmental Panel on Climate Change (IPCC). They spoke as a group at the American Geophysical Union’s annual fall meeting being held this week in San Francisco. Considering that climate deniers are constantly accusing IPCC scientists of not having airtight data, it took some guts for the experts to identify gaps in knowledge. But they said the gaps do not undermine prevailing climate predictions, which have become increasingly thorough for two decades. 
Filling the gaps, they said, would further enhance the forecasts. In that sense, the experts are calling for scientists to do what scientists always strive to do: learn, then figure out what more needs to be discovered, and go find it.
The climate effect of clouds, especially low clouds, is still a bit of a mystery, said Olivier Boucher, from the Pierre Simon Laplace Institute in Paris, who was the lead author of the IPCC report chapter on clouds and aerosols (airborne particles). “Low-level clouds are the wild card” in many atmospheric models, he noted. And they are changing. For example, low clouds seem to be migrating toward the north and south poles, where they have less affect on blocking incoming heat from the sun and in absorbing heat radiated from the Earth. Scientists also do not have a good handle on whether low clouds are getting thicker, if they are holding more water vapor, or if the dwindling of Arctic sea ice is leading to more or less cloud formation. [Notes: 1) total column water vapor has declined over the past 50+ years, 2) decreased Arctic sea ice allows more evaporation and clouds to form, a negative feedback]
A related gap in knowledge is how aerosols affect clouds. For example, black carbon—the particles emitted by burning fossil fuels—“is more important than we thought” in determining how much heat the atmosphere can trap [because black carbon causes global cooling], Boucher said. “It’s really critical to understand the feedbacks” that may occur between aerosols and clouds, and feedbacks between that interaction and changes in Arctic sea ice. Together, the set of feedbacks could substantially “amplify or dampen climate change,” Boucher said.
Those interactions feed into a second gap in understanding: how carbon is emitted, transported and stored among soils, plants, air and ocean—the so-called carbon cycle. Newly emitted carbon dioxide persists in the atmosphere for hundreds of years [false], so how readily it is absorbed and held in soil and seawater affects the extent of the greenhouse effect, as well as the now-rising acidity of ocean water, noted Philippe Ciais, also at the French institute and lead author of the IPCC chapter on biogeochemical cycles.
What’s happening in the ocean itself is a third gap that must be filled. Oceans absorb a large portion of the carbon dioxide emitted into the atmosphere. Although the top layer of the ocean has been warming somewhat in step with the air above it, that rate of warming may be slowing, even though CO2 emissions continue to increase worldwide. “Where is that [missing] heat going?” asked Dennis Hartmann from the University of Washington, author of the IPCC chapter on measurements of the Earth. Some scientists suspect that ocean currents are transporting that heat to deeper layers, but they just don’t know. A new, global system of buoys that can dive deep down into the water and rise over a series of days, again and again, should help generate an answer, Hartmann said.
A related question is whether the ocean is slowing the current rise of atmospheric temperatures, sometimes called the hiatus or the pause. More scientists are saying the pause may be driven by changes in the El Niño and La Niña cycle of ocean-atmosphere interactions in the central Pacific Ocean. If so, Hartmann asked, “How long will the hiatus persist?”
Other open questions, Hartmann said, are why Arctic sea ice is rapidly disappearing while Antarctic sea ice is increasing, where heavy rainfall is spreading, and how greater humidity in the atmosphere is affecting that rainfall as well as severe storms.
If scientists can fill these particular gaps in knowledge, Hartmann said, they should be able to predict not just long-term trends but changes on a decade-to-decade scale. That kind of fine-grained forecast would greatly help cities, municipalities, businesses, farmers and many others better plan ways to adapt to climate change.
The insight would help local weather forecasters, too. For example, atmospheric scientists can only reliably model cloud cover a few hours into the future, Boucher noted. “We would like to be able to do that for a month,” he said.
Related:
NCAR scientist admits IPCC may be wrong on clouds, may have a net cooling effect instead of warming