Related from Dr. Roy Spencer: Latest Climate Models Warm 3x Too fast
CMIP5 models versus observations
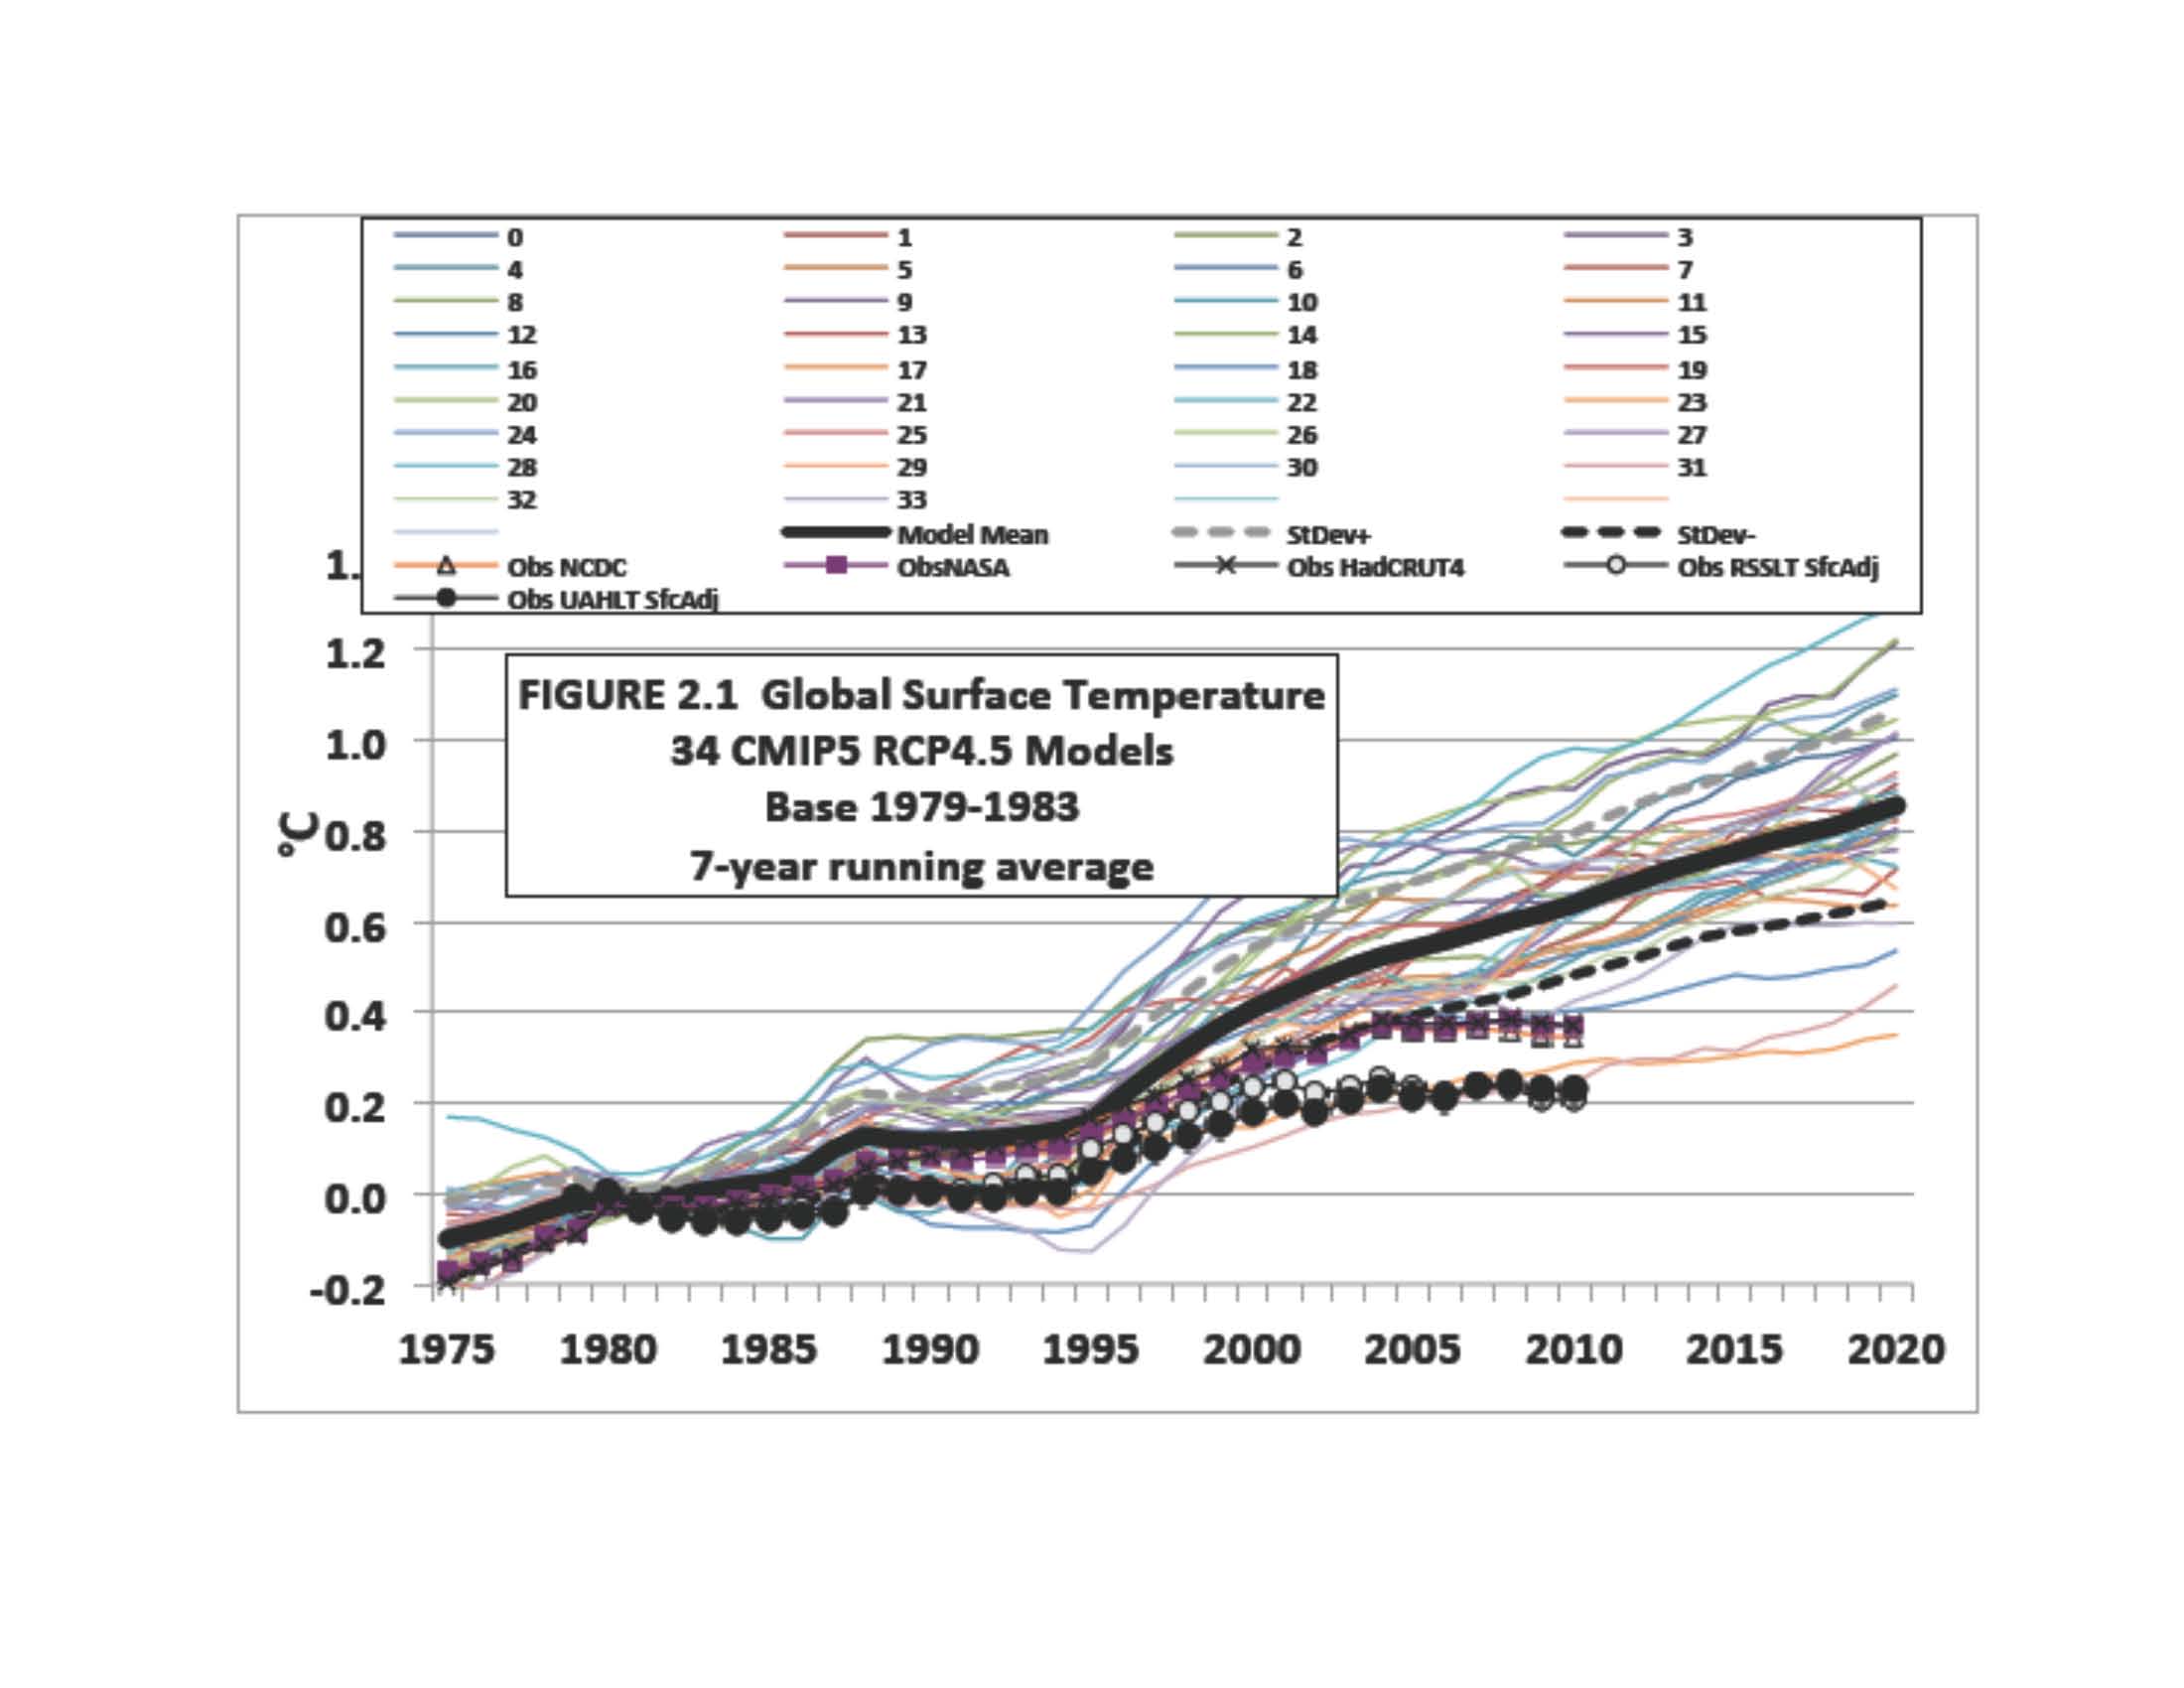
Of equal importance here are the magnitudes of the actual trends of the surface and troposphere. The average global surface trend for 90 model simulations for 1979-2012 (Climate Model Intercomparison Project 5 or CMIP-5 used for IPCC AR5) is +0.232 °C/decade. The average of the observations is +0.157 °C/decade. Therefore models, on average, depict the last 34 years as warming about 1.5 times what actually occurred. Santer et al. 2012 (for 1979-2011 model output) noted that a subset of CMIP-5 models produce warming in LT that is 1.9 times observed, and for a deeper layer of the atmosphere (mid-troposphere, surface to about 18 km) the models warm the air 2.5 times that of observations. These are significant differences, implying the climate sensitivity of models is too high.
Signature
All of the above addresses the two issues mentioned at the beginning. First, global climate models on average depict a relationship between the surface and upper air that is different than that observed, i.e. models depict an amplifying factor into the upper air that is greater than observed. Secondly, the average climate model depicts the warming rate since 1979 as much higher than observed with increasing discrepancies as the altitude increases (which is consistent with the first issue).
Since this increased warming in the upper layers is a signature of greenhouse gas forcing in models, and it is not observed, this raises questions about the ability of models to represent the true vertical heat flux processes of the atmosphere and thus to represent the climate impact of the extra greenhouses gases we are putting into the atmosphere. It is not hard to imagine that as the atmosphere is warmed by whatever means (i.e. extra greenhouse gases) that existing processes which naturally expel heat from the Earth (i.e. negative feedbacks) can be more vigorously engaged and counteract the direct warming of the forcing. This result is related to the idea of climate sensitivity, i.e. how sensitive is the surface temperature to higher greenhouse forcing, for which several recent publications suggest models, on average, have been overly sensitive.
References:
Christy, J.R., B. Herman, R. Pielke, Sr., P. Klotzbach, R.T. McNider, J.J. Hnilo, R.W. Spencer, T. Chase and D. Douglass, 2010: What do observational datasets say about modeled tropospheric temperature trends since 1979? Remote Sens. 2, 2138-2169. Doi:10.3390/rs2092148.
Douglass D. H., J. R. Christy, B. D. Pearson and S. F. Singer (2007) A comparison of tropical temperatures trends with model predictions.. International J of Climatology 5 Dec 2007. doi: 10.1002ijoc.1651
Klotzbach, P.J., R.A. Pielke Sr., R.A. Pielke Jr., J.R. Christy, and R.T. McNider, 2009:
An alternative explanation for differential temperature trends at the surface and in the lower troposphere. J.Geophys. Res., 114, D21102, doi:10.1029/2009JD011841.<http://pielkeclimatesci.wordpress.com/files/2009/11/r-345.pdf>
Klotzbach, P.J., R.A. Pielke Sr., R.A. Pielke Jr., J.R. Christy, and R.T. McNider, 2010:
Correction to: “An alternative explanation for differential temperature trends at the surface and in the lower troposphere. J. Geophys. Res., 114, D21102, doi:10.1029/2009JD011841″, J. Geophys. Res., 115, D1, doi:10.1029/2009JD013655.
Santer B. and 26 others (2012). Identifying human influence on atmospheric temperatures. Proceeding of the National Academy of Sciences. doi:10.1073/pnas.1210514109.
No comments:
Post a Comment