It is well known that glaciation and deglaciation of the North and South poles are not synchronous and frequently out of phase or in opposite phases for periods of thousands of years. This is entirely consistent with Milankovitch theory, the 1000-1500 year Atlantic Meridional Overturning Circulation [AMOC], and the conservation of solar energy/1st law of thermodynamics, by which relatively constant solar energy input is shifted back and forth from one hemisphere to the other while conserving the overall energy input/output of the entire globe.
Could the "mirror graph" below of Arctic and Antarctic sea ice trends since 1979 represent the beginnings of another bipolar seesaw of "abrupt" climate change with opposing trends at the two poles? We have recently observed satellite-record-high levels of Antarctic sea ice, and a decline followed by stabilization over recent years of Arctic sea ice, with global sea ice near the satellite era mean.
Might this be more plausible than claims that global warming is currently simultaneously causing record-high levels of Antarctic sea ice in the Southern Hemisphere, while also allegedly causing record-high levels of snow and record cold temperatures in North America, as well as a stabilization of Arctic sea ice? In fact, climate models robustly predicted the opposite of what has caused the recent record-cold US weather and also robustly predicted the opposite trend of the observed record-high levels of Antarctic sea ice.
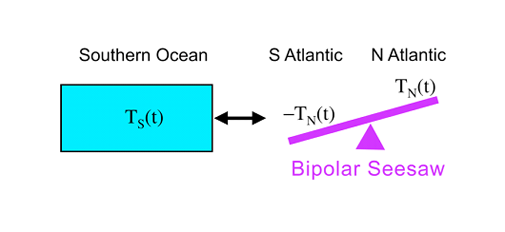 |
Schematic of the bipolar seesaw. North Atlantic temperature changes are mirrored by equal amplitude South Atlantic changes of opposite sign. Southern Ocean temperatures are relaxed toward this South Atlantic temperature. Source: Modeling the Bipolar Seesaw.
|
The seesaw theory of climate is also entirely consistent with the conservation of energy, unlike Trenberth's theory of "missing heat" from man-made CO2 hidden somewhere within in the climate system.
 |
| Graph from the paper shows bipolar seesaw of temperatures between North and South poles with a lag of a few thousand years |
Seesaw theory in action?:
Arctic/Antarctic Mirror Graph Day 260
For those who claim Antarctic Sea Ice Extent increases are small and have nothing in common with Arctic losses:


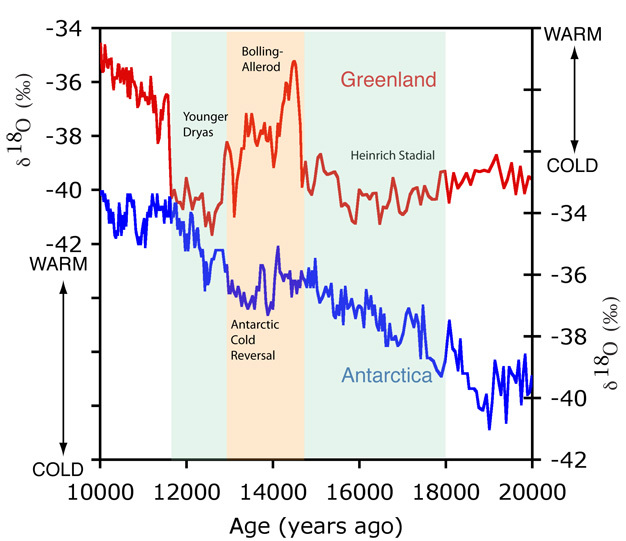

A review of the bipolar see–saw from synchronized and high resolution ice core water stable isotope records from Greenland and East Antarctica
- Greenland vs Antarctica chronologies have a precision of a few centuries. •
- Submillennial Antarctic variability occurs during long Greenland stadials. •
- The timing of abrupt changes differs between Greenland and North Atlantic climate.
Abstract
Numerous ice core records are now available that cover the Last Glacial cycle both in Greenland and in Antarctica. Recent developments in coherent ice core chronologies now enable us to depict with a precision of a few centuries the relationship between climate records in Greenland and Antarctica over the millennial scale variability of the Last Glacial period. Stacks of Greenland and Antarctic water isotopic records nicely illustrate a seesaw pattern with the abrupt warming in Greenland being concomitant with the beginning of the cooling in Antarctica at the Antarctic Isotopic Maximum (AIM). In addition, from the precise estimate of chronological error bars and additional high resolution measurements performed on the EDC and TALDICE ice cores, we show that the seesaw pattern does not explain the regional variability in Antarctic records with clear two step structures occurring during the warming phase of AIM 8 and 12. Our Antarctic high resolution data also suggest possible teleconnections between changes in low latitude atmospheric circulation and Antarctic without any Greenland temperature fingerprint.
Other published papers on the bipolar seesaw theory of abrupt climate change:
Sunday, March 30, 2014
New paper supports the bipolar seesaw theory of abrupt climate change
A paper published today in Nature finds "clear" evidence of a "hydrologic seesaw in which latitudinal migrations of the Intertropical Convergence Zone (ITCZ) produce simultaneous wetting (increased precipitation) in one hemisphere and drying in the other." According to the authors, these shifts can have "serious effects on temperate climate systems. Furthermore, our result implies that insolation-driven ITCZ dynamics may provoke water vapour and vegetation feedbacks in northern mid-latitude regions and could have regulated global climate conditions throughout the late Quaternary ice age cycles."
The paper provides additional, "clear" evidence supporting the "bipolar seesaw theory of abrupt climate change." "Theoretical models and observational data have long suggested that the Northern and Southern Hemisphere climates behave in a seesaw-like fashion: when the northern ocean warms, the southern ocean cools and vice versa."
Mid-latitude interhemispheric hydrologic seesaw over the past 550,000 years
The paper provides additional, "clear" evidence supporting the "bipolar seesaw theory of abrupt climate change." "Theoretical models and observational data have long suggested that the Northern and Southern Hemisphere climates behave in a seesaw-like fashion: when the northern ocean warms, the southern ocean cools and vice versa."
 Glacials and interglacials on the northern and southern hemisphere somehow do not seem to correspond. This has led to a ‘thermal bipolar seesaw theory,’ whereby an off-mode in the thermohaline circulation leads to an ice age in Europe, but excess heat storage down south. |
Given that ice cores show a lag between Arctic and Antarctic climate changes of 300-1500 years, it begs the question given that Antarctic sea ice is at record highs and Arctic sea ice has declined during the satellite era, whether this may represent part of a natural seesaw pattern, shifting heat via the thermohaline circulation from the Southern Hemisphere to the Northern Hemisphere and explaining why less warming has been observed in the Southern Hemisphere since 1850.

Mid-latitude interhemispheric hydrologic seesaw over the past 550,000 years
Nature advance online publication 30 March 2014. doi:10.1038/nature13076
Authors: Kyoung-nam Jo, Kyung Sik Woo, Sangheon Yi, Dong Yoon Yang, Hyoun Soo Lim, Yongjin Wang, Hai Cheng & R. Lawrence Edwards
An interhemispheric hydrologic seesaw—in which latitudinal migrations of the Intertropical Convergence Zone (ITCZ) produce simultaneous wetting (increased precipitation) in one hemisphere and drying in the other—has been discovered in some tropical and subtropical regions. For instance, Chinese and Brazilian subtropical speleothem (cave formations such as stalactites and stalagmites) records show opposite trends in time series of oxygen isotopes (a proxy for precipitation variability) at millennial to orbital timescales, suggesting that hydrologic cycles were antiphased in the northerly versus southerly subtropics. This tropical to subtropical hydrologic phenomenon is likely to be an initial and important climatic response to orbital forcing. The impacts of such an interhemispheric hydrologic seesaw on higher-latitude regions and the global climate system, however, are unknown. Here we show that the antiphasing seen in the tropical records is also present in both hemispheres of the mid-latitude western Pacific Ocean. Our results are based on a new 550,000-year record of the growth frequency of speleothems from the Korean peninsula, which we compare to Southern Hemisphere equivalents. The Korean data are discontinuous and derived from 24 separate speleothems, but still allow the identification of periods of peak speleothem growth and, thus, precipitation. The clear hemispheric antiphasing indicates that the sphere of influence of the interhemispheric hydrologic seesaw over the past 550,000 years extended at least to the mid-latitudes, such as northeast Asia, and that orbital-timescale ITCZ shifts can haveserious effects on temperate climate systems. Furthermore, our result implies that insolation-driven ITCZ dynamics may provoke water vapour and vegetation feedbacks in northern mid-latitude regions and could have regulated global climate conditions throughout the late Quaternary ice age cycles.
Related:
The north–south climate seesaw [Nature 2009]
Theoretical models and observational data have long suggested that the Northern and Southern Hemisphere climates behave in a seesaw-like fashion: when the northern ocean warms, the southern ocean cools and vice versa. So far, however, the data have indicated a much muted response in Antarctic climate compared to the Arctic. An analysis of new records from an ocean core from the South Atlantic — including planktonic foraminifera assemblages, Mg/Ca ratios, temperature and ocean productivity data — shows that the South Atlantic cooled essentially instantaneously with the warming in the North Atlantic during the last deglaciation. This first concrete evidence of an immediate seesaw connection also provides a link between the rapid warming in the North Atlantic and the more gradual Antarctic response, and suggests a mechanism potentially driving rapid Northern Hemisphere deglaciation.
NEWS AND VIEWSClimate change: Southern see-saw seen
The bipolar see-saw hypothesis provides an explanation for why temperature shifts in the two hemispheres were out of phase at certain times. The hypothesis has now passed a test of one of its predictions.
Jeffrey P. Severinghaus
doi:10.1038/4571093a
ARTICLEInterhemispheric Atlantic seesaw response during the last deglaciation
Stephen Barker, Paula Diz, Maryline J. Vautravers, Jennifer Pike, Gregor Knorr, Ian R. Hall & Wallace S. Broecker
doi:10.1038/nature07770
Over long timescales I'm quite sure that changes in insolation from Milankovitch cycles would indeed affect the latitudinal positions of the climate zones and the ITCZ and since the Arctic is an ocean surrounded by land and the Antarctic is land surrounded by oceans the consequences are likely to differ at each pole.
ReplyDeleteHowever, that does not help with the shorter time scale of millennial climate change such as from Roman Warm Period, Dark Ages , Mediaeval Optimum, Little Ice Age and the Modern Warm Period.
For that we need to look here:
http://joannenova.com.au/2015/01/is-the-sun-driving-ozone-and-changing-the-climate/
In both scenarios the fingerprint of a changing global energy budget is the same, namely latitudinally shifting climate zones and jet streams with associated cloudiness changes.
There is evidence that the position of the ITCZ shifted between the Mediaeval Optimum and the LIA and that it shifted again from the LIA until today.
http://onlinelibrary.wiley.com/doi/10.1029/2006RG000204/full
ReplyDeleteBeyond the limited range of historical and instrumental data, the geologic record has provided abundant evidence of natural climate changes that are both abrupt and large in magnitude. The most dramatic insights into this aspect of climate system behavior have come from studies of ice and sediment cores from the northern North Atlantic. Ice core results from Greenland were the first to show that significant changes in regional climate occurred in the past over time scales of a few years to a few decades at most. These excursions, which have come to be known as Dansgaard-Oeschger or D-O events [Dansgaard et al., 1984, 1993], recurred roughly every 1500 years and show up as abrupt warmings over Greenland of as much as 10°C followed by a somewhat more gradual return to cold glacial conditions.
While the amplitude of climate change in the Antarctic is generally dampened at best relative to events in Greenland, rapid shifts in climate are not undocumented for the region. At the site of the Siple Dome ice core, near the edge of the Ross Ice Shelf, Taylor et al. [2004] documented a dramatic rise in air temperature of about 6°C 22,000 years ago. This sharp temperature increase apparently occurred within a few decades and has no obvious counterpart in Greenland nor within other Antarctic sites.
Correlations between Greenland d18O and sediment color in Cariaco Basin [South America] (which is largely a function of organic matter content) imply that surface productivity along the Venezuelan coast varied in lockstep both in timing and abruptness with Greenland temperature variations, presumably in response to variations in trade wind strength and upwelling Mg/Ca data from surfacedwelling foraminifera in a piston core record spanning the last 25,000 years [Lea et al., 2003] indicate an abrupt warming of 3°C at the onset of the Bølling and an equally abrupt decrease in SST of 3°C–4°C during the Younger Dryas, both synchronous within ±30–90 years of their correlative changes in Greenland air temperature.
In summary, the relatively small number of existing high-latitude climate records from the Southern Hemisphere reveal potentially complicated regional patterns of climate change, and few, in truth, possess the length, temporal resolution, and age control needed to provide hard constraints on changes occurring around the time of the abrupt events in Greenland. The most obvious exception is the remarkable new EDML ice core record from the Antarctic (Figure 4), which appears to show a dampened but out-of phase temperature pattern for all D-O events consistent with the bipolar seesaw hypothesis.
http://onlinelibrary.wiley.com/doi/10.1002/2014GL059821/abstract
ReplyDeleteWe present the first proxy record of sea-ice area (SIA) in the Ross Sea, Antarctica, from a 130 year coastal ice-core record. High-resolution deuterium excess data show prevailing stable SIA from the 1880s until the 1950s, a 2–5% reduction from the mid-1950s to the early-1990s, and a 5% increase after 1993. Additional support for this reconstruction is derived from ice-core methanesulphonic acid concentrations and whaling records. While SIA has continued to decline around much of the West Antarctic coastline since the 1950s, concurrent with increasing air and ocean temperatures, the underlying trend is masked in the Ross Sea by a switch to positive SIA anomalies since the early-1990s. This increase is associated with a strengthening of southerly winds and the enhanced northward advection of sea ice.
-----
http://www.cgd.ucar.edu/staff/cdeser/docs/fan.antarctic_seaice_trends.grl14.pdf
This study compares the distribution of surface climate trends over the Southern Ocean in austral summer between 1979–2011 and 1950–1978, using a wide variety of data sets including uninterpolated gridded marine archives, land station data, reanalysis, and satellite products. Apart from the Antarctic Peninsula and adjacent regions, sea surface temperatures and surface air temperatures decreased during 1979–2011, consistent with the expansion of Antarctic sea ice. In contrast, the Southern Ocean and coastal Antarctica warmed during 1950–1978. Sea level pressure (SLP) and zonal wind trends provide additional evidence for a sign reversal between the two periods, with cooling (warming) accompanied by stronger (weaker) westerlies and lower (higher) SLP at polar latitudes in the early (late) period. Such physically consistent trends across a range of independently measured parameters provide robust evidence for multidecadal climate variability over the Southern Ocean and place the recent Antarctic sea ice trends into a broader context.