Showing posts sorted by date for query maxwell clausius. Sort by relevance Show all posts

Friday, July 29, 2016

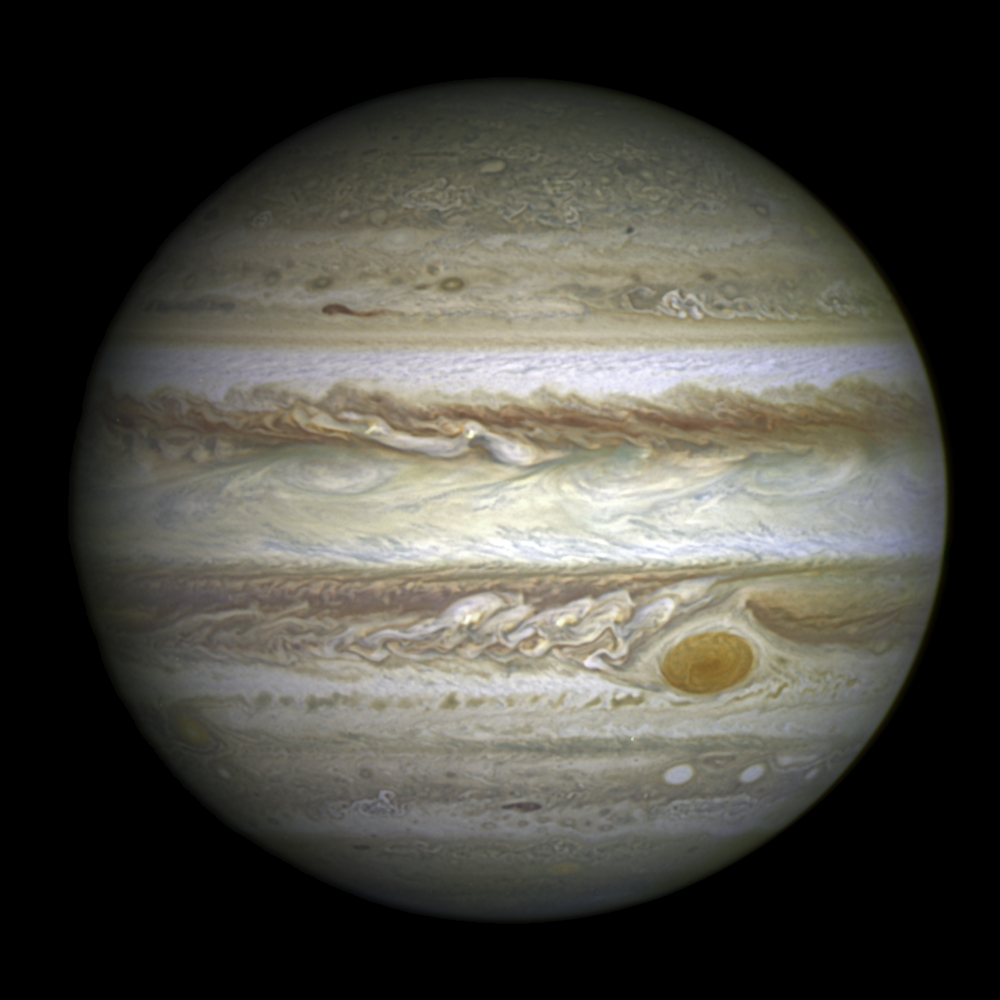
Jupiter's Giant Red Spot is red hot & explained by the gravito-thermal greenhouse effect

A new paper published in Nature finds Jupiter's Great Red Spot is red hot at about 2,420°F or 1,330°C (i.e. almost hot enough to melt steel at 1425°C) and that this observation, 
"could solve the mystery of the unusually high temperatures observed throughout Jupiter's upper atmosphere, which can't be explained by solar heating alone. [nor by a radiative greenhouse effect]"
"Previous heat-distribution models suggested that Jupiter's atmosphere should be much cooler, largely because the planet is about fives times further from the sun than Earth is. So, having ruled out solar heating from above, the authors of the new research found evidence suggesting this atmospheric heating is largely driven by a combination of gravity waves and acoustic waves generated by turbulences in the atmosphere below the Great Red Spot.
"Giant planets like Jupiter are measured to be hundreds of degrees warmer than current temperature models predict. Before now, the extremely warm temperatures observed in Jupiter's atmosphere have been difficult to explain, due to the lack of a known heat source."
In other words, the very hot atmospheric temperatures on Jupiter cannot be due to an Arrhenius radiative greenhouse effect. The atmosphere of Jupiter is mostly comprised of the non-greenhouse gases hydrogen and helium, but does contain small amounts of the IR-active 'greenhouse' gas water vapor. However, the Maxwell/Clausius/Carnot gravito-thermal greenhouse effect perfectly explains the observed atmospheric temperature profile of Jupiter, making Jupiter the ninth planet in our solar system to follow the simple Poisson relationship of atmospheric mass/gravity/pressure to temperature. The Poisson relationship was demonstrated in another recent paper:

Referring to fig. 1 of the paper, we find at 0.1 bar pressure on Jupiter, the corresponding temperature is~112°K, and at 11 bars pressure corresponds to 400°K or 260°F:

Fig 1 from the paper. The dotted line is the atmospheric temperature vs. pressure curve on Jupiter. At 11 bars pressure, the temperature is 400°K or 127°C or 260°F.  
This satisfies the Poisson Relation (which in turn is derived from the Ideal Gas Law) previously demonstrated on 6 8 other celestial bodies in our solar system:


T/To = (P/Po)^0.286 ~= 400°K/112°K = (11 bar/0.1 bar)^.286

where
T = temperature at 11 bars pressure =  400°K
To= temperature at top of atmosphere = 112°K
P = 11 bars
Po= pressure at top of atmosphere = 0.1 bar

and once again demonstrates that the catastrophic anthropogenic global warming (CAGW) theory is a myth, that atmospheric temperatures are controlled by mass/gravity/pressure and are independent of greenhouse gas concentrations on any of these 9 planets with atmospheres, including Earth. Adding additional CO2 plant food to the atmosphere will undoubtedly green the Earth, but Earth's climate sensitivity to CO2 is effectively zero. 

Related: How can Uranus have storms hot enough to melt steel? A runaway greenhouse effect?


Jupiter's Great Red Spot is Also Red Hot, Study Shows

 | 

Jupiter's Great Red Spot is apparently also red hot: The highest temperatures ever observed on the planet were recently detected in the region above the ginormous storm.  
The Great Red Spot (GRS) is a massive storm about twice the diameter of Earth that lies in lowest layer of Jupiter's atmosphere. About 497 miles (800 kilometers) above this humongous storm, astronomers measured temperatures reaching about 700 degrees Fahrenheit (about 370 degrees Celsius) higher than normal, James O'Donoghue, lead author of the new study and a research scientist with Boston University's (BU) Center for Space Physics, told Space.com. 
The new finding could solve the mystery of the unusually high temperatures observed throughout Jupiter's upper atmosphere, which can't be explained by solar heating alone.[Jupiter's Great Red Spot: Photos of the Solar System's Biggest Storm
Generally, atmospheric temperatures on Jupiter are around 1,700 degrees F (around 930 degrees C), with the exception of areas above the planet's poles, which are heated by auroras. Above the Great Red Spot, however, the atmosphere is about 2,420 degrees F (about 1,330 degrees C), O'Donoghue said. 
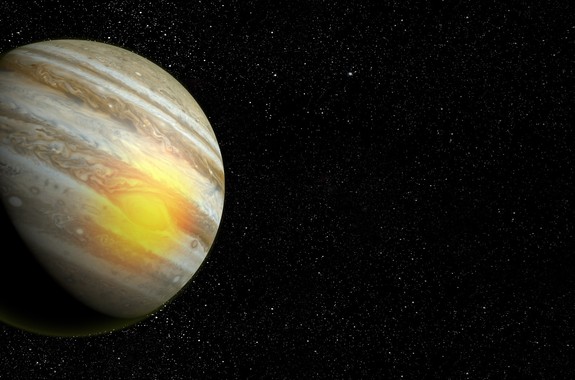


Observations show that Jupiter's upper atmosphere — above the Great Red Spot — is hundreds of degrees hotter than anywhere else on the planet.

Previous heat-distribution models suggested that Jupiter's atmosphere should be much cooler, largely because the planet is about fives times further from the sun than Earth is. So, having ruled out solar heating from above, the authors of the new research found evidence suggesting this atmospheric heating is largely driven by a combination of gravity waves and acoustic waves generated by turbulences in the atmosphere below the Great Red Spot. The new study was published today (July 27) in the journal Nature. 
Atmospheric gravity waves — not to be mistaken for gravitational waves — occur when pockets of air collide with things like mountains. The resulting effect is similar to when a pebble is dropped into a lake, and ripples then form on the surface of the water.  
Acoustic waves, on the other hand, are sound waves, which means they develop from compressions and refractions in the air and travel upward into the atmosphere. There, they encounter regions of lower density and break, much like ocean waves breaking on the shore. When this happens, the acoustic waves release stored kinetic energy and cause molecules and atoms in the air to move around more, which then raises the temperature, O'Donoghue said.  
"Changes in density around the Great Red Spot will shoot waves in all directions," O'Donoghue added. "We believe that acoustic waves are the majority of the heating cause, because gravity waves tend to ship their energy across the planet, rather than vertically up like acoustic waves." 
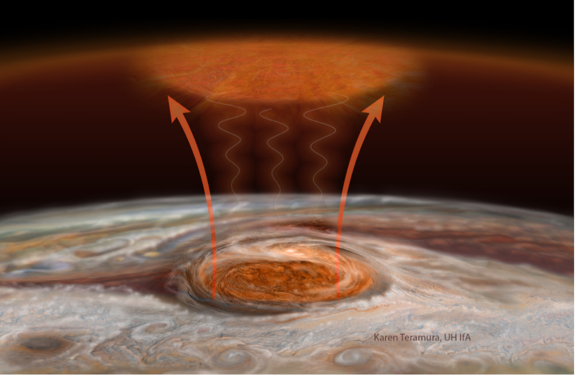


This illustration shows how a combination of gravity and acoustic waves transfers heat above the Great Red Spot to Jupiter's upper atmosphere.
Credit: Art by Karen Teramura, UH IfA, James O'Donoghue

The GRS is a massive storm that rotates counterclockwise, colliding with the natural flow of molecules in the atmosphere, which are moving opposite the storm. These types of collisions create turbulence that creates acoustic and gravity waves, O'Donoghue said. 
Using data from the SpeX instrument on the NASA Infrared Telescope Facility (IRTF) on Mauna Kea mountain in Hawaii, the researchers were able to measure the temperature of Jupiter's atmosphere, specifically around the GRS.  
"The Great Red Spot is the largest storm in the solar system — it is bigger than Earth itself — so it generates a lot of turbulence that impedes the flow of air in the atmosphere," O'Donoghue said. "It is kind of like when you stir a cup of coffee and you turn the spoon around and go the opposite way. Suddenly, there is a lot of sloshing [turbulence] going on that generates sound waves, or compressions of air, upwards for you to hear."  
The heat generated from the acoustic and gravity waves has a localized effect, which suggests there is a coupling between low and high altitudes, as energy is transferred from the lower atmosphere to the upper atmosphere. Previously, the connection between low and high altitudes was thought to be pretty much impossible because the distance is so vast, O'Donoghue explained.
"This new result from Jupiter provides the first evidence of upward coupling of energy that finds its way from the lower atmosphere to the upper atmosphere," Michael Mendillo, a professor of astronomy at BU, who was not involved with the study, told Space.com. "It's a very interesting observation — even on Earth, this mechanism is not well-studied or understood. If this happens on Jupiter, it is possible that it happens on all planets." 
Giant planets like Jupiter are measured to be hundreds of degrees warmer than current temperature models predict. Before now, the extremely warm temperatures observed in Jupiter's atmosphere have been difficult to explain, due to the lack of a known heat source, Tom Stallard, co-author of the new study and an associate professor of astronomy at the University of Leicester in the United Kingdom, told Space.com. 
"Sometimes, ironically, it is easier to see these features on a planet far away [from Earth]," said Stallar, who advised O'Donoghue throughout his research. In other words, "It's much more difficult to step back and see these broadscale effects … on Earth, so it's interesting to use Jupiter as a 'proxy' for what might be happening on other planets, and that includes Earth."
With the Juno spacecraft orbiting Jupiter, the researchers hope to get an up-close view of the Great Red Spot and isolate where the heat observed in the planet's upper atmosphere comes from. They also plan to study the fine details of smaller storms like Red Spot Jr., to see if there is heating above them as well. 

Wednesday, June 15, 2016

New paper demonstrates the gravito-thermal greenhouse effect on Jupiter is due to pressure, not greenhouse gases

A paper published in Science June 3, 2016, Peering through Jupiter's clouds with Radio Spectral Imaging, demonstrates the gravito-thermal greenhouse effect on Jupiter and that atmospheric temperatures are a function of pressure, independent of greenhouse gas concentrations. Jupiter is a gaseous planet with an atmosphere comprised almost entirely of the non-greenhouse gases hydrogen and helium, yet is capable of generating 67% more radiation than it receives from the Sun, and has estimated temperatures at the Jovian core of more than 20,000°C, more than three times as hot as the surface of the Sun. Jupiter, however, only receives 3.6% as much solar radiation per meter squared as the Earth. The only possible explanation for this "temperature enhancement" or "greenhouse effect" is atmospheric mass/pressure/gravity (the gravito-thermal greenhouse effect of Maxwell/Poisson/Clausius et al), and which is entirely independent of greenhouse gas concentrations. 

Prior work has confirmed the gravito-thermal greenhouse effect on 6 8 planets including Earth, and why this falsifies the theory of catastrophic man-made global warming. On the basis of this new paper, we find the gravito-thermal greenhouse effect also holds for Jupiter and that the pressure vs. temperature curve satisfies the Poisson Relation of the gravito-thermal greenhouse effect.

Referring to fig. 1 of the paper, we find at 0.1 bar pressure on Jupiter, the corresponding temperature is~112°K, and at 11 bars pressure corresponds to 400°K or 260°F:


Fig 1 from the paper. The dotted line is the atmospheric temperature vs. pressure curve on Jupiter. At 11 bars pressure, the temperature is 400°K or 127°C or 260°F.  
This satisfies the Poisson Relation (which in turn is derived from the Ideal Gas Law) previously demonstrated on 6 8 other celestial bodies in our solar system:


T/To = (P/Po)^0.286 ~= 400°K/112°K = (11 bar/0.1 bar)^.286

and once again demonstrates that the catastrophic anthropogenic global warming (CAGW) theory is a myth, that atmospheric temperatures are controlled by mass/gravity/pressure and are independent of greenhouse gas concentrations on any of these 9 planets with atmospheres, including Earth. Adding additional CO2 plant food to the atmosphere will undoubtedly green the Earth, but Earth's climate sensitivity to CO2 is effectively zero. 


Fig. 7. 
a)   Dry adiabatic response of the air/surface temperature ratio to pressure changes in the free atmosphere according to Poisson’s formula. The reference pressure is arbitrarily assumed to be po=100 kPa;b) The SB radiation law expressed as a response of a blackbody temperature ratio to variation in photon pressure (see text for details).


image
image
Figure 6. Temperature/potential temperature ratio as a function of atmospheric pressure according to the Poisson formula based on the Gas Law (Po = 100 kPa.). Note the striking similarity in shape with the curve in Fig. 5.

NASA Jupiter Fact Sheet


Jupiter

Jupiter/Earth Comparison


Bulk parameters

                                   Jupiter      Earth   Ratio (Jupiter/Earth)
Mass (1024 kg)                      1,898.19    5.9724      317.83 
Volume (1010 km3)                 143,128     108.321      1321.33
Radius (1 bar level) (km)
    Equatorial                     71,492       6,378.1      11.209    
    Polar                          66,854       6,356.8      10.517
Volumetric mean radius (km)        69,911       6,371.0      10.973
Ellipticity                         0.06487     0.00335      19.36 
Mean density (kg/m3)                1,326       5,514         0.240 
Gravity (eq., 1 bar) (m/s2)        24.79        9.80          2.530 
Acceleration (eq., 1 bar) (m/s2)   23.12        9.78          2.364 
Escape velocity (km/s)             59.5        11.19          5.32
GM (x 106 km3/s2)                 126.687       0.39860     317.83 
Bond albedo                         0.343       0.306         1.12
Visual geometric albedo             0.52        0.367         1.42  
Visual magnitude V(1,0)            -9.40       -3.86           -
Solar irradiance (W/m2)            50.26     1361.0           0.037
Black-body temperature (K)        109.9       254.0           0.433
Moment of inertia (I/MR2)           0.254       0.3308        0.768 
J2 (x 10-6)                        14,736    1082.63         13.611    
Number of natural satellites       67           1
Planetary ring system             Yes          No

Orbital parameters

                                   Jupiter      Earth   Ratio (Jupiter/Earth)
Semimajor axis (106 km)             778.57      149.60        5.204   
Sidereal orbit period (days)      4,332.589     365.256      11.862   
Tropical orbit period (days)      4,330.595     365.242      11.857
Perihelion (106 km)                 740.52      147.09        5.034      
Aphelion (106 km)                   816.62      152.10        5.369
Synodic period (days)               398.88        -             -
Mean orbital velocity (km/s)         13.06       29.78        0.439    
Max. orbital velocity (km/s)         13.72       30.29        0.453        
Min. orbital velocity (km/s)         12.44       29.29        0.425       
Orbit inclination (deg)               1.304       0.000         -
Orbit eccentricity                    0.0489      0.0167      2.928
Sidereal rotation period (hours)      9.9250*    23.9345      0.415  
Length of day (hrs)                   9.9259     24.0000      0.414
Obliquity to orbit (deg)              3.13       23.44        0.134 
Inclination of equator (deg)          3.13       23.44        0.134                                               
* System III (1965.0) coordinates

Jovian Atmosphere

Surface Pressure: >>1000 bars  
Temperature at 1 bar: 165 K (-108 C)
Temperature at 0.1 bar: 112 K (-161 C)
Density at 1 bar: 0.16 kg/m3
Wind speeds
   Up to 150 m/s<30 40="" degrees="" latitude="" m="" s="" to="" up="">
Scale height: 27 km
Mean molecular weight: 2.22 
Atmospheric composition (by volume, uncertainty in parentheses)
    Major:       Molecular hydrogen (H2) - 89.8% (2.0%); Helium (He) - 10.2% (2.0%)
    Minor (ppm): Methane (CH4) - 3000 (1000); Ammonia (NH3) - 260 (40);
                 Hydrogen Deuteride (HD) - 28 (10); Ethane (C2H6) - 5.8 (1.5);
                 Water (H2O) - 4 (varies with pressure)
    Aerosols:    Ammonia ice, water ice, ammonia hydrosulfide

Tuesday, October 27, 2015

Why Tyndall's experiment did not "prove" the theory of anthropogenic global warming

Many warmists cite Tyndall's 1861 experiment as "proof" of the catastrophic anthropogenic global warming theory, but in fact the experiment demonstrated only that CO2 and H2O are IR-active molecules capable of absorbing and emitting infrared radiation, nothing more. 

Of course, CO2 does indeed absorb and emit very low-energy ~15 micron infrared radiation, equivalent to a "partial blackbody" at a temperature of 193K (-80C) by Wien's Law. However, radiation from a true or "partial" blackbody cannot warm the much warmer atmosphere (with an "average" temperature of 255K (-18C), equivalent to the equilibrium temperature of Earth with the Sun), nor the even warmer Earth surface at 288K (15C).

Yet the Arrhenius radiative greenhouse theory falsely assumes that "backradiation" from the 193K CO2 "partial blackbody" can warm the Earth surface temperature from the 255K equilibrium temperature with the Sun by 33K up to 288K. This would require a continuous and dominating heat transfer from cold to hot, thus requiring an impossible decrease of entropy, and therefore a gross violation of the Second Law of Thermodynamics (which requires entropy to increase from any transfer of heat)

In contrast, the alternative 33C gravito-thermal greenhouse theory of Poisson, Helmholtz, Maxwell, Boltzmann, Carnot, Clausius, Feynman, US Standard Atmosphere, International Standard Atmosphere, the HS greenhouse equation, et al instead fully explains the 33C 'greenhouse effect' on Earth, as well as on all 7 additional planets for which we have adequate data. 

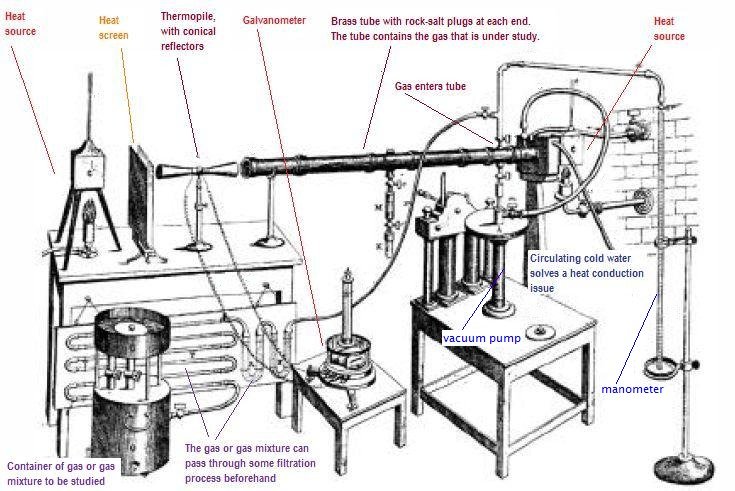
As we can see from the diagram of Tydall's apparatus below, it consists of a horizontal sealed tube containing the gas to be studied. Unlike the actual 100km Earth atmosphere, Tyndall's apparatus does not allow any vertical convective cooling as is found in the real Earth atmosphere. In fact, increased greenhouse gases accelerate convective cooling in the troposphereTyndall's apparatus artificially prevents this convective cooling, just like a sealed greenhouse does, but which does not happen in the real atmosphere. 

Furthermore, as physicist William Happer points out, the probability of CO2 transferring quanta of energy in the troposphere via collisions instead of emitting a photon is one billion times more likely. This transfer of energy via collisions to the remaining 99.06% of the atmosphere causes acceleration of convective cooling by increasing the adiabatic expansion, rising, and cooling of air parcels. Convection dominates radiative-convective equilibrium in the troposphere by a factor of ~8 times and thus cancels any possible warming effect of the low-energy CO2 backradiation upon the surface. 

Further, the presence of IR-active gases in the atmosphere only delays the ultimate passage of IR photons from the surface to space by a few seconds, and is easily reversed and erased during each 12 hour night, and explains why 'greenhouse gases' don't 'trap heat' in the atmosphere.

For these reasons, Tydall's experiment does not in any way prove the Arrhenius radiative greenhouse theory. In contrast, the alternative 33C gravito-thermal greenhouse theory of Poisson, Helmholtz, Maxwell, Boltzmann, Carnot, Clausius, Feynman, US Standard Atmosphere, International Standard Atmosphere, the HS greenhouse equation, et al instead fully explains the 33C 'greenhouse effect' on Earth, as well as on all 7 additional planets for which we have adequate data. 


Tyndall's Setup For Measuring Radiant Heat Absorption By Gases (source: Wikipedia)

This illustration dates from 1861 and it is taken from one of John Tyndall's presentations where he describes his setup for measuring the relative radiant-heat absorption of gases and vapors. The galvanometer quantifies the difference in temperature between the left and right sides of the thermopile. The reading on the galvanometer is settable to zero by moving the Heat Screen a bit closer or farther from the lefthand heat source. That is the only role for the heat source on the left. The heat source on the righthand side directs radiant heat into the long brass tube. The long brass tube is highly polished on the inside, which makes it a good reflector (and non-absorber) of the radiant heat inside the tube. Rock-salt (NaCl) is practically transparent to radiant heat, and so plugging the ends of the long brass tube with rock-salt plates allows radiant heat to move freely in and out at the tube endpoints, yet completely blocks the gas within from moving out. To begin the measurements, both heat sources are turned on, the long brass tube is evacuated as much as possible with an air suction pump, the galvanometer is set to zero, and then the gas under study is released into the long brass tube. The galvanometer is looked at again. The extent to which the galvanometer has changed from zero indicates the extent to which the gas has absorbed the radiant heat from the righthand heat source and blocked this heat from radiating to the thermopile through the tube. If a highly polished metal disc is placed in the space between the thermopile and the brass tube it will completely block the radiant heat coming out of the tube from reaching the thermopile, thereby deflecting the galvanometer by the maximum extent possible with respect to blockage in the tube. Thus the system has minimum and maximum readings available, and can express other readings in percentage terms. (The galvanometer's responsiveness was physically nonlinear, but well understood, and mathematically linearizable.)
In one of his public lectures to non-professional audiences Tyndall gave the following indication of instrument sensitivity: "My assistant stands several feet off. I turn the thermopile towards him. The heat from his face, even at this distance, produces a deflection of 90 degrees [on the galvanometer dial]. I turn the instrument towards a distant wall, judged to be a little below the average temperature of the room. The needle descends and passes to the other side of zero, declaring by this negative deflection that the pile feels the chill of the wall." (quote from Six Lectures On Light). To reduce interference from human bodies, the galvanometer was read through a telescope from across the room. The thermopile & galvanometer system was invented by Nobili and Melloni. Melloni measured radiant heat absorption in solids and liquids but didn't have the sensitivity for gases. Tyndall greatly improved the sensitivity of the overall setup (including putting an offsetting heat source on the other side of the thermopile, and putting the gas in a brass tube), and as a result of his superior apparatus he was able to confidently reach conclusions that were quite different from Melloni's concerning radiant heat in gases (book ref below, in chapter I). Air from which water vapor and carbon dioxide had been removed deflected the galvanometer dial by less than 1 degree, in other words a detectable but very small amount (same ref, chapter II). Many other gases and vapors deflected the galvanometer by a large amount -- thousands of times greater than air.
As a check on his system's reliability, Tyndall painted the inside walls of the brass tube with a strong absorber of radiant heat (namely lampblack). This greatly reduced the radiant heat that reached the thermopile when the tube was empty. Nevertheless the percentage absorptions by the different gases and vapors relative to the empty tube were largely and essentially unchanged by this change to the absorption property of the tube's walls. That's excluding a few gases and vapors such as chlorine that must be excluded because they tarnish brass, changing its heat reflectivity. As another test of the reliability of the system, the long brass tube was cut to about a quarter of its original length, and the exact same quantity of gas was released into the shorter tube. Thus the shorter tube will have about four times higher gas density. It was found that the percentage of radiant heat absorbed by or transmitted through the gas relative to the empty-tube state was entirely unchanged by this (even though the two tubes don't have equal empty-tube states). Varying the absolute quantity of the gas in the tube causes corresponding changes in the absorption percentages, but varying the density doesn't matter, nor does the absolute value of the empty-tube reference point.
The emission spectrum of the particular source of heat makes a difference -- sometimes a big difference -- in the amount of radiant heat a gas will absorb, and different gases can respond differently to a change in the source. Tyndall said in 1864, "a long series of experiments enables me to state that probably no two substances at a temperature of 100°C emit heat of the same quality [i.e. of the same spectral profile]. The heat emitted by isinglass, for example, is different from that emitted by lampblack, and the heat emitted by cloth, or paper, differs from both." Looking at an electrically-heated platinum wire, it is obvious to the human eye that the heat's spectral profile depends on whether the wire is heated to dull red, bright orange, or white hot. Some gases were relatively stronger absorbers of the dull-red platinum heat while other gases were relatively stronger absorbers of the white hot platinum heat, he found. For his original and primary benchmark in 1859, he used the heat from 100°C lampblack (akin to a theoretical "blackbody radiator"). Later he got some of his more interesting findings from using other heat sources. E.g., when the source of radiant heat was any one kind of gas, then this heat was strongly absorbed by another body of the same kind of gas, regardless of whether the gas was a weak absorber of broad-spectrum sources. In the illustration above, the radiant heat that is going into the brass tube comes from a pot of simmering water; the heat radiates from the exterior surface of the pot, not from the water, and not from the gas flame that keeps the water at a simmer. An alternative illustration with a modified setup taken from the same book (page 112) is shown below. The main difference is that the heat source is separated from the brass tube by open air, which eliminates the need for circulating cold water cooling at the interface between heat source and brass tube.

Tuesday, October 20, 2015

Jupiter emits 67% more radiation than it receives from the Sun -only explanation is the gravito-thermal greenhouse effect, not greenhouse gases

An article published at The Conversation asks Is the Red Spot shrinking superstorm evidence of climate change on Jupiter?and indeed finds that this and other observed changes are evidence of climate change (of unknown cause) on Jupiter. 

The article incidentally notes that,
"We do know that Jupiter emits 67% more radiation than it receives from the Sun. This is due to an internal heat source, which is thought to drive much of Jupiter\'s weather, including, presumably, the Great Red Spot. The heat likely is generated by the gradual contraction of matter under Jupiter's enormous gravity."
Warmists claim gravity cannot be the cause of any so-called "greenhouse effect" (or the "gravito-thermal greenhouse effect") on Earth, Jupiter, nor any other planet, yet overwhelming observational evidence for every planet in our solar system (with adequate observational data - 8 planets at this point) clearly demonstrates that surface and atmospheric temperatures are a sole function of gravity/mass/pressure and independent of greenhouse gas concentrations. 

In the case of Jupiter, a gas planet composed almost entirely of the non-IR-active, non-greenhouse gases hydrogen and helium, there is no solid planetary surface nor greenhouse gases to allegedly "trap" solar radiation, yet Jupiter has an "internal heat source" that causes a thermal enhancement ("gravito-thermal greenhouse effect") resulting in emission of 67% more radiation than it receives from the Sun. The only possible explanation of this is gravity, not radiative forcing from the Sun nor greenhouse gases, and hence the mass/pressure/gravity gravito-thermal greenhouse effect of Maxwell, Clausius, Carnot, Boltzmann, Helmholtz, Feynman, US Std Atmosphere, the HS greenhouse equation is corroborated on 9 planets.

Likewise, the ice planet Uranus has recently been observed to have storms at the top of the atmosphere radiating at blackbody temperatures hotter than required to melt steel. In addition, 
"the base of the troposphere on the planet Uranus is 320K, considerably hotter than on Earth [288K], despite being nearly 30 times further from the Sun. The base of the troposphere on Uranus is 320K at 100 bars pressure, despite the planet only receiving 3.71 W/m2 energy from the Sun. By the Stefan-Boltzmann Law, a 320K blackbody radiates 584.6 W/m2. This is 157.5 times the energy received from the Sun, due to the atmospheric temperature gradient produced within a planetary gravity field. The temperature at the base of the troposphere is determined by the ideal gas law PV=nRT, where pressure from gravity and atmospheric mass raise the temperature at the base of the troposphere from the equilibrium temperature with the Sun of Uranus of 89.94K to 320K, regardless of the atmospheric mixture of greenhouse gases."
Once again, the only possible explanation of both of these phenomena on Uranus is the Maxwell et al gravito-thermal greenhouse effect, thus bringing the number of planets for which very strong evidence exists to a total of ten. 

On Venus, we know from the NASA Fact Sheet:


Venus Atmosphere

Surface pressure: 92 bars = 92000 mbar 
Surface density: ~65. kg/m3 = 65000 g/m3
Scale height: 15.9 km
Total mass of atmosphere:  ~4.8 x 10²⁰ kg
Average temperature: 737 K (464 C)
Diurnal temperature range: ~0 
Wind speeds: 0.3 to 1.0 m/s (surface)
Mean molecular weight: 43.45 
Atmospheric composition (near surface, by volume): 
    Major:       96.5% Carbon Dioxide (CO2), 3.5% Nitrogen (N2) 
    Minor (ppm): Sulfur Dioxide (SO2) - 150; Argon (Ar) - 70; Water (H2O) - 20;
                 Carbon Monoxide (CO) - 17; Helium (He) - 12; Neon (Ne) - 7

We can easily calculate the gravito-thermal greenhouse effect surface temperature of Venus using the ideal gas law 

T = PV/nR = 92000/(65000/43.45*0.083144621) = 739K 

which is within 2K (or 2C) of NASA observations of 737K as noted above, leaving essentially no room for any sort of Arrhenius radiative greenhouse effect on Venus. Note below also, the blackbody temperature of Venus is 184.2K, therefore mass/gravity/pressure alone has thermally enhanced the surface temperature of Venus by a factor of

737K/184.2K = 4 times

Thus, the Arrhenius radiative greenhouse effect is falsified on the basis of observations and first physical principles, and the only possible alternative greenhouse theory of Maxwell et al confirmed. 


Bulk parameters Venus vs. Earth

                                   Venus          Earth     Ratio (Venus/Earth)
Mass (1024 kg)                      4.8676         5.9726         0.815 
Volume (1010 km3)                  92.843        108.321          0.857
Equatorial radius (km)            6051.8         6378.1          0.949     
Polar radius (km)                  6051.8         6356.8          0.952
Volumetric mean radius (km)        6051.8         6371.0          0.950
Ellipticity (Flattening)            0.000          0.00335        0.0  
Mean density (kg/m3)               5243           5514            0.951 
Surface gravity (eq.) (m/s2)        8.87           9.80           0.905 
Surface acceleration (eq.) (m/s2)   8.87           9.78           0.907 
Escape velocity (km/s)             10.36          11.19           0.926
GM (x 106 km3/s2)                   0.3249         0.3986         0.815
Bond albedo                         0.90           0.306          2.94
Visual geometric albedo             0.67           0.367          1.83  
Visual magnitude V(1,0)            -4.40          -3.86             -
Solar irradiance (W/m2)            2613.9         1367.6          1.911
Black-body temperature (K)          184.2          254.3          0.724 
Topographic range (km)               15             20            0.750 
Moment of inertia (I/MR2)           0.33           0.3308         0.998
J2 (x 10-6)                         4.458       1082.63           0.004  
Number of natural satellites          0              1
Planetary ring system                No             No


Thermal enhancement or gravito-thermal greenhouse curve for 8 planets

Is shrinking superstorm evidence of climate change on Jupiter?

Is shrinking superstorm evidence of climate change on Jupiter?
Andrew Coates is Professor of Physics, Head of Planetary Science at the Mullard Space Science Laboratory, UCL. 
(CNN) It makes our most turbulent terrestrial storms look like mere pipsqueaks. But remarkable new Hubble footage shows that Jupiter\'s Great Red Spot -- an anticyclonic storm system twice the size of Earth -- is shrinking and turning orange. Is this evidence of Jovian climate change? And could the planet\'s violent storm finally be giving way to more clement conditions, at least by Jupiter\'s dramatic standards?
Jupiter, the largest planet in our solar system, is a gas giant dominated by hydrogen with some helium and smaller amounts of other gases, a mixture that resembles the composition of the early solar nebula and results in some staggeringly beautiful weather. The planet\'s cloud systems, which counter-rotate in zones and belts, with eastward and westward winds reaching 100 meters per second, are among the solar system\'s most spectacular sights and come in a blaze of different colors -- red due to ammonia, white due to ammonium hydrosulphide, and brown and blue due to additions to water ice.
A raging storm
But one of the most recognizable and persistent features of Jupiter\'s atmosphere is the Great Red Spot (GRS). Swirling around the planet\'s southern hemisphere, it covers a huge 10 degrees of latitude. (2-3 times the size of Earth)
This vast anticyclonic (high pressure) storm system has been observed raging for perhaps 350 years -- the first likely observations were reported in 1664-1655 by Robert Hooke and Gian-Dominique Cassini. It is cooler than its surroundings, rotates anticlockwise with a four to six day period, and is located between zonal winds moving at 100 meters per second.
The Great Red Spot\'s stability over such a long period of time is remarkable. A fluid instability would disappear in a few days to weeks, as in the case of the scars caused when several fragments of the comet Shoemaker-Levy 9 struck Jupiter in 1994 -- so an energy source must be powering it. Models have been suggested, but none fully explain the Great Red Spot: is it really a hurricane, a shear instability, an eddy or a solitary wave?
Inside the pressure cooker
We do know that Jupiter emits 67% more radiation than it receives from the Sun. This is due to an internal heat source, which is thought to drive much of Jupiter\'s weather, including, presumably, the Great Red Spot. The heat likely is generated by the gradual contraction of matter under Jupiter\'s enormous gravity. In the planet\'s deeper layers, for example, hydrogen enters a liquid metallic state and the pressure is 3m atmospheres.
We also know that after years of relative stability, the Great Red Spot is now changing. Since 2012, Hubble observations as part of the Outer Planets Atmospheres Legacy (OPAL) program have shown that the spot has been shrinking -- and that the rate of shrinkage has increased in recent years. The latest measurement, published by Amy Simon and colleagues, show a further reduction of 240km, although this rate of shrinkage is less than in preceding years and there are not enough observations yet to know if this is a periodic feature as seen with Neptune\'s great dark spot.
It is not just a matter of size, however. The Hubble results also show that the spot\'s shape is continuing its evolution from oval to circular, and that a new wispy filament, spiralling inwards and driven by winds of at least 150 meters per second, has developed within the Great Red Spot. The core region has also been shrinking, consistent with the overall trend, and is also becoming less distinct. It is also now deep orange in color.
Jovian climate change
There are other changes in the Jovian atmosphere, too. The Hubble observations show a new wave structure about 16 degrees north of Jupiter\'s equator, in a region of cyclones and anticyclones. It is similar to the only previous observation of such a structure by Voyager 2 in 1979 and may herald the birth of a new cyclone there.
It\'s clear that Jupiter\'s atmosphere is changing, and the Great Red Spot is evolving. The question is: why? Is the Great Red Spot fizzling out, or oscillating over time?
The jury is still out, but continued observations by the annual OPAL campaign, combined with in-situ measurements of the atmospheric dynamics and interior structure, may yet reveal intriguing new clues. The JUNO polar orbiter will also reach Jupiter in July next year and doubtless offer answers of its own.
Jupiter\'s mysterious Great Red Spot may be shrinking, then, but the world will be talking about Jupiter\'s weather for a good while yet.