A recent paper published in the Hydrological Sciences Journal examines precipitation in southern China from 1956-2000 and finds precipitation has become both less extreme and less variable. Contrary to claims of climate alarmists, the paper adds to many others demonstrating that global warming decreases extreme weather including extreme precipitation, floods, droughts, and cyclone activity.
Furthermore, the authors find that the primary determinant of precipitation variability is the Sun, stating, "the annual precipitation in every sub-region in Guangdong province correlates with Sunspot Number with a 3-year lag."
Via the latest NIPCC Report:
Reference
Liu, D., Guo, S., Chen, X. and Shao, Q. 2012. Analysis of trends of annual and seasonal precipitation from 1956 to 2000 in Guangdong Province, China. Hydrological Sciences Journal 57: 358-369.
Writing as background for their study, Liu et al. (2012) state that "climate change is consistently associated with changes in a number of components of the hydrological cycle," including "precipitation patterns and intensity, and extreme weather events." Therefore, and in order to "provide advice for water resource management under climate change," they conducted a study of the subject in the Guangdong Province of Southern China, which occupies a land area of approximately 178,000 km2 and has a population of just over 96 million people (as of 2009).
Specifically, Liu et al. analyzed "trends of annual, seasonal and monthly precipitation in southern China (Guangdong Province) for the period 1956-2000 ... based on the data from 186 high-quality gauging stations," and they employed "statistical tests, including the Mann-Kendall rank test and wavelet analysis," in order to determine whether the precipitation series exhibited any regular trends or periodicities.
In describing their findings the four researchers report that "annual precipitation has a slightly decreasing trend in central Guangdong and slight increasing trends in the eastern and western areas of the province," but they say that "all the annual trends are not statistically significant at the 95% confidence level." In addition, they discovered that "average precipitation increases in the dry season in central Guangdong, but decreases in the wet season," such that "precipitation becomes more evenly distributed within the year." Last of all, they state that "the results of wavelet analysis show prominent precipitation with periods ranging from 10 to 12 years in every [italics added] sub-region in Guangdong Province." And comparing precipitation with the 11-year sunspot cycle, they find that "the annual precipitation in every [italics added] sub-region in Guangdong province correlates with Sunspot Number with a 3-year lag."
Rather than becoming more extreme in the face of 1956-2000 global warming, Liu et al.'s analysis of the pertinent data suggest that precipitation in China's Guangdong Province has become both less extreme and less variable. And the temporal precipitation patterns that do emerge upon proper analysis suggest that the primary player in their determination is the sun.
Showing posts sorted by relevance for query extreme precipitation. Sort by date Show all posts
Showing posts sorted by relevance for query extreme precipitation. Sort by date Show all posts
Wednesday, December 12, 2012


Sunday, August 3, 2014
New paper finds another non-hockey-stick in Corsica & no trend in precipitation past 815 years
A new paper published in Quaternary Science Reviews reconstructs temperature and precipitation on the Mediterranean island of Corsica and finds no long-term trends or pronounced periods with extreme high or low precipitation over the past 815 years. Reconstructed temperatures also show relatively stable temperatures over the past 600 years with no evidence of a hockey stick in the 20th century.
According to the authors,
However, there's little doubt that Michael Mann could find a hockey stick in this data using his hockey-stick generating computer code, which also creates hockey sticks from Monte Carlo random numbers, baseball statistics, and telephone book numbers.
According to the authors,
"No long-term trends or pronounced periods with extreme high/low precipitation are recorded in our reconstruction, indicating relatively stable moisture conditions over the entire time period."The paper joins over 1,000 other non-hockey-sticks worldwide published in the scientific literature and clearly rebuts alarmist claims of a "hockey stick" rise in temperature, precipitation, or increased extreme weather with extreme precipitation either wet or dry.
 |
| No long-term trends in precipitation or pronounced periods with extreme high or low precipitation are found in the reconstruction over the past 815 years |
 |
| Top 7 graphs show various non-hockey-stick tree-ring chronologies, d18O graph is a proxy of temperature and precipitation which shows a decline over the past 600 years, decreases in d13C are a proxy for the quantity of volcanic + anthropogenic CO2 in the atmosphere as volcanic & fossil-fuel CO2 is depleted in 13C. |
Highlights
- •
- We present a multi-parameter dataset from Pinus nigra.
- •
- Isotope values and wood anatomical parameters are compared over 600 years.
- •
- Carbon isotopes and tree-ring width are suitable for climate reconstructions.
- •
- Summer temperature and precipitation is reconstructed back to AD 1450.
- •
- Extreme climate conditions during summer influence cell parameter characteristics.
Abstract
We present a new multi-parameter dataset from Corsican black pine growing on the island of Corsica in the Western Mediterranean basin covering the period AD 1410–2008. Wood parameters measured include tree-ring width, latewood width, earlywood width, cell lumen area, cell width, cell wall thickness, modelled wood density, as well as stable carbon and oxygen isotopes. We evaluated the relationships between different parameters and determined the value of the dataset for climate reconstructions. Correlation analyses revealed that carbon isotope ratios are influenced by cell parameters determining cell size, whereas oxygen isotope ratios are influenced by cell parameters determining the amount of transportable water in the xylem. A summer (June to August) precipitation reconstruction dating back to AD 1185 was established based on tree-ring width. No long-term trends or pronounced periods with extreme high/low precipitation are recorded in our reconstruction, indicating relatively stable moisture conditions over the entire time period. By comparing the precipitation reconstruction with a summer temperature reconstruction derived from the carbon isotope chronologies, we identified summers with extreme climate conditions, i.e. warm-dry, warm-wet, cold-dry and cold-wet. Extreme climate conditions during summer months were found to influence cell parameter characteristics. Cold-wet summers promote the production of broad latewood composed of wide and thin-walled tracheids, while warm-wet summers promote the production of latewood with small thick-walled cells. The presented dataset emphasizes the potential of multi-parameter wood analysis from one tree species over long time scales.
Friday, May 2, 2014
New paper finds extreme precipitation and flooding in Spain were much worse in the past
A paper published today in Quaternary Science Reviews reconstructs precipitation of the Iberian Peninsula and finds the past 95 years from 1917-2012 experienced relatively low extreme precipitation and flooding in comparison to the past 665 years. The authors instead find two periods with much more frequent and extreme precipitation and flooding from 1347–1400 and 1844–1894 AD, which correlated to periods of relatively high solar activity. According to the authors, there is a "possible link of extreme rainfall to solar variability prior the 20th century."
Alarmists claim man is causing the climate to become more variable extreme, but hundreds of published paleoclimate studies indicate today's climate is less variable and quite benign in comparison to the rest of the Holocene [past ~11,000 years]. A warmer climate decreases the temperature differentials between the poles and the tropics, and since temperature differentials, not absolute temperatures, drive all weather phenomena, a warmer climate will be a more benign climate with less extreme weather.
 |
| Solar activity shown in 2nd graph from top. Grey bands indicate periods with the highest frequency of extreme precipitation and flooding. |


Highlights
- •
- An annual record of extreme rainfall from Lake Montcortès (NE Iberian Peninsula).
- •
- Quantitative rainfall threshold achieved for various detrital micro-facies.
- •
- Maxima in extreme rainfall events during the periods AD 1347–1400 and AD 1844–1894.
- •
- Minimum extreme rainfall at AD 1441–1508, 1547–1592, 1656–1712, 1765–1822, 1917–2012.
- •
- Possible link of extreme rainfall to solar variability prior the 20th century.
Abstract
We present an annual reconstruction of extreme rainfall events interpreted from detrital layers and turbidites interbedded within a varved sediment record since the 14th century in Montcortés Lake (NE Spain, 1027 m a.s.l.). Clastic microfacies intercalated within the biochemical calcite varves were characterized and their depositional dynamics interpreted using high-resolution geochemical and sedimentological analyses. Annual number of detrital layers was compared against instrumental records of extreme daily rainfalls providing minimum rainfall thresholds and return periods associated to the identified types of clastic microfacies. Non-continuous detrital layers were deposited during rainfall events higher than 80 mm (>2-year return period) while graded detrital layers and turbidites were associated with higher magnitude rainfall events (>90 mm and >4-year return period). The frequency distribution of extreme hydro-meteorological events is not stationary and its pattern coincides with historical floods from the nearby Segre River. High frequency of heavy rainfalls occurred during the periods AD 1347–1400 and AD 1844–1894. A lower frequency of heavy rainfall was found during the periods AD 1441–1508, 1547–1592, 1656–1712, 1765–1822 and 1917–2012. The 20th century stands out as the longest interval within the studied period of very low number of extreme rainfall events. Variability in extreme rainfall events prior to the 20th century is in phase with solar activity, suggesting a mechanistic link in mid-latitude atmospheric circulation patterns that ceased during the 20thcentury.
Friday, December 28, 2012
New paper finds floods and extreme precipitation were more common during the Little Ice Age
A recent paper published in Quaternary Research examines floods in the Mediterranean French Alps over the past 1400 years and finds that extreme precipitation and flooding were less common and less extreme during warm periods compared to cold periods. The authors find "a low flood frequency during the Medieval Warm Period and more frequent and more intense events during the Little Ice Age." The paper provides yet another example of real-world data disproving climate alarmist (IPCC) contentions that warming results in more extreme weather, extreme precipitation, or floods. The paper also shows that summer temperatures in southwestern Europe were warmer during the Medieval Warming Period [MWP] in comparison to the year 2000, and adds to the work of over 1000 scientists demonstrating that the global MWP was as warm or warmer than the present.
In addition, the paper shows that Total Solar Irradiance sharply increased by about 1 Wm-2 throughout most of the 20th century, dwarfing the alleged effect of CO2 during the 20th century [allegedly about 0.35 Wm-2 per the IPCC formula].
From the latest NIPCC Report:
Paleofloods of the Mediterranean French Alps
Introducing their work, Wilhelm et al. (2012) say that "mountain-river floods triggered by extreme precipitation events can cause substantial human and economic losses (Gaume et al., 2009)," adding that "global warming is expected to lead to an increase in the frequency and/or intensity of such events," citing the IPCC (2007), "especially in the Mediterranean region (Giorgi and Lionello, 2008)." They then proceed to conduct a historical examination of floods in the French Alps.
Working at Lake Allos (44°14'N, 6°42'35" E) - a 1-km-long by 700-m-wide high-altitude lake in the French Alps - Wilhelm et al. carried out a coupled bathymetric and seismic survey of the lake's sediment infill, analyzing three sediment cores for grain size, geochemical composition, total organic carbon content, and pollen content and identity; while small-size vegetal macro-remains (pine needles, buds, twigs and leaves) were sampled at the base of the flood deposits and used for AMS 14C analysis, which was conducted at France's LMC14 carbon-dating laboratory. And although acknowledging the complicating fact that "changes in vegetation and/or land-use can modify soil stability/erodibility," they report that "the size of the coarsest sediment fraction still reflects stream flow velocity," citing Beierle et al. (2002) and Francus et al. (2002).
In addition, the paper shows that Total Solar Irradiance sharply increased by about 1 Wm-2 throughout most of the 20th century, dwarfing the alleged effect of CO2 during the 20th century [allegedly about 0.35 Wm-2 per the IPCC formula].
 |
| Graph from the poster presentation of the same paper shows flooding was more frequent and extreme during the Little Ice Age |
Paleofloods of the Mediterranean French Alps
Introducing their work, Wilhelm et al. (2012) say that "mountain-river floods triggered by extreme precipitation events can cause substantial human and economic losses (Gaume et al., 2009)," adding that "global warming is expected to lead to an increase in the frequency and/or intensity of such events," citing the IPCC (2007), "especially in the Mediterranean region (Giorgi and Lionello, 2008)." They then proceed to conduct a historical examination of floods in the French Alps.
Working at Lake Allos (44°14'N, 6°42'35" E) - a 1-km-long by 700-m-wide high-altitude lake in the French Alps - Wilhelm et al. carried out a coupled bathymetric and seismic survey of the lake's sediment infill, analyzing three sediment cores for grain size, geochemical composition, total organic carbon content, and pollen content and identity; while small-size vegetal macro-remains (pine needles, buds, twigs and leaves) were sampled at the base of the flood deposits and used for AMS 14C analysis, which was conducted at France's LMC14 carbon-dating laboratory. And although acknowledging the complicating fact that "changes in vegetation and/or land-use can modify soil stability/erodibility," they report that "the size of the coarsest sediment fraction still reflects stream flow velocity," citing Beierle et al. (2002) and Francus et al. (2002).
In further discussing their methodology, the thirteen French scientists report that some 160 graded layers of sedimentary deposits over the last 1400 years were compared with records of historic floods; and they indicate that these comparisons "support the interpretation of flood deposits and suggest that most recorded flood events are the result of intense meso-scale precipitation events." And they make a point of noting that the temporal history of these deposits reveals "a low flood frequency during the Medieval Warm Period and more frequent and more intense events during the Little Ice Age."
Once again, we have another example of climate-alarmist (IPCC) contentions widely missing the mark when it comes to predicting which temperature extreme - hot or cold - produces both more frequent and more intense precipitation events, as well as the flooding that accompanies them.
Reference:
Wilhelm, B., Arnaud, F., Sabatier, P., Crouzet, C., Brisset, E., Chaumillon, E., Disnar, J.-R., Guiter, F., Malet, E., Reyss, J.-L., Tachikawa, K., Bard, E. and Delannoy, J.-J. 2012. 1400 years of extreme precipitation patterns over the Mediterranean French Alps and possible forcing mechanisms. Quaternary Research 78: 1-12.
Additional References
Beierle, B.D., Lamoureux, S.F., Cockburn, J.M.H. and Spooner, I. 2002. A new method for visualizing sediment particle size distributions. Journal of Paleolimnology 27: 279-283.
Beierle, B.D., Lamoureux, S.F., Cockburn, J.M.H. and Spooner, I. 2002. A new method for visualizing sediment particle size distributions. Journal of Paleolimnology 27: 279-283.
Francus, P., Bradley, R.S., Abbott, M.B., Patridge, W. and Keimig, F. 2002. Paleoclimate studies of minerogenic sediments using annually resolved textural parameters.Geophysical Research Letters 29: 10.1029/2002GL015082.
Gaume, E., Bain, V., Bernardara, P., Newinger, O., Barbuc, M., Bateman, A., Blaskovicova, L., Bloschl, G., Borga, M., Dumitrescu, A., Daliakopoulos, I., Garcia, J., Irimescu, A., Kohnova, S., Koutroulis, A., Marchi, L., Matreata, S., Medina, V., Preciso, E., Sempere-Torres, D., Stancalie, G., Szolgay, J., Tsanis, I., Velasco, D. and Viglione, A. 2009. A compilation of data on European flash floods. Journal of Hydrology 367: 70-78.
Giorgi, F. and Lionello, P. 2008. Climate change projections for the Mediterranean region. Global and Planetary Change 63: 90-104.
IPCC. 2007. Climate Change 2007: The Physical Science Basis. Solomon, S., Qin, D., Manniing, M., Chen, Z., Marquis, M., Averyt, K.B., Tignor, M. and Miller, H.L. (Eds.), Contribution of Working Group I to the Fourth Assessment Report of the Intergovernmental Panel on Climate Change. Cambridge University Press, Cambridge, United Kingdom.
Tuesday, July 15, 2014
New paper finds key IPCC assumption of model independence is false; leads to overconfidence in projections
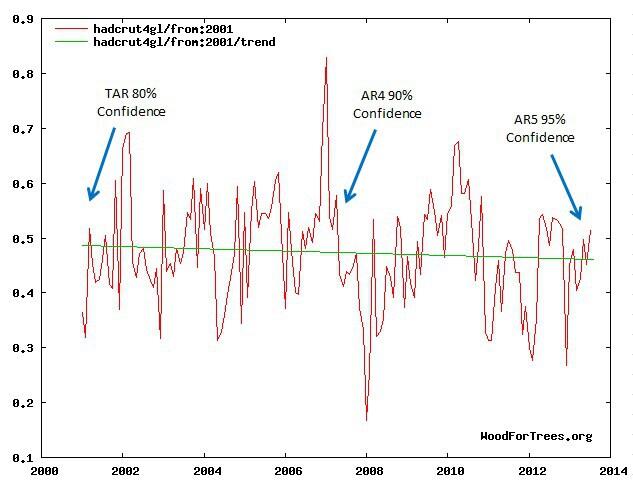
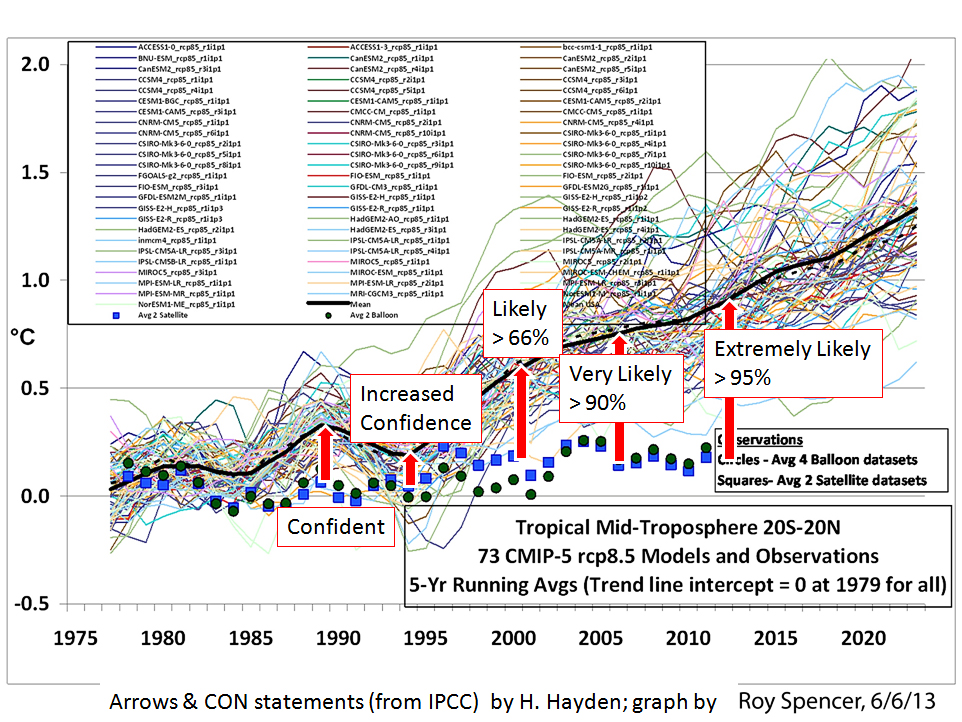
A important paper published today in the Journal of Climate finds that a central IPCC assumption is false: climate models can not be considered to be independent and that ensemble means of models can not be used to quantify uncertainty of climate change. In essence, the models themselves exhibit confirmation bias and are largely based upon the same underlying true or false assumptions.
Reliance by the IPCC upon this false assumption of model independence leads to "results [that] will be overconfident and may be treated as more precise than they really are," such as the increase of IPCC confidence in anthropogenic global warming despite global cooling over the past three assessment reports, and IPCC model ensembles which exaggerate warming by a factor of 3-5 times.
According to the authors,
Climate change impact studies are subject to numerous uncertainties and assumptions. One of the main sources of uncertainty arises from the interpretation of climate model projections. Probabilistic procedures based on multi-model ensembles have been suggested in the literature to quantify this source of uncertainty. However, the interpretation of multi-model ensembles remains challenging. Several assumptions are often required in the uncertainty quantification of climate model projections. For example, most methods often assume that the climate models are independent or/and that changes in climate model biases are negligible. This study develops a Bayesian framework that accounts for model dependencies and changes in model biases and compares it to estimates calculated based on a frequentist approach. The Bayesian framework is used to investigate the effects of the two assumptions on the uncertainty quantification of extreme precipitation projections over Denmark. An ensemble of regional climate models from the ENSEMBLES project is used for this purpose.
Reliance by the IPCC upon this false assumption of model independence leads to "results [that] will be overconfident and may be treated as more precise than they really are," such as the increase of IPCC confidence in anthropogenic global warming despite global cooling over the past three assessment reports, and IPCC model ensembles which exaggerate warming by a factor of 3-5 times.
According to the authors,
"The results confirm that the climate models cannot be considered independent and show that the bias depends on the value of precipitation. This has an influence on the results of the uncertainty quantification. Both the mean and spread of the change in extreme precipitation depends on both assumptions. If the models are assumed independent and the bias constant, the results will be overconfident and may be treated as more precise than they really are. This study highlights the importance of investigating the underlying assumptions in climate change impact studies, as these may have serious consequences for the design of climate change adaptation strategies.
Journal of Climate 2014 ; e-View
A Bayesian Approach for Uncertainty Quantification of Extreme Precipitation Projections Including Climate Model Interdependency and Non-Stationary Bias
Maria Antonia Sunyer
Dan Rosbjerg
Karsten Arnbjerg-Nielsen
Department of Environmental Engineering, Technical University of Denmark, Miljøvej building 113, Kgs. Lyngby 2800, Denmark. masu@env.dtu.dk
Henrik MadsenDan Rosbjerg
Karsten Arnbjerg-Nielsen
| Abstract |
|---|
The results confirm that the climate models cannot be considered independent and show that the bias depends on the value of precipitation. This has an influence on the results of the uncertainty quantification. Both the mean and spread of the change in extreme precipitation depends on both assumptions. If the models are assumed independent and the bias constant, the results will be overconfident and may be treated as more precise than they really are. This study highlights the importance of investigating the underlying assumptions in climate change impact studies, as these may have serious consequences for the design of climate change adaptation strategies.
Sunday, February 9, 2014
Evidence demonstrates global warming decreases flooding & extreme precipitation
The UK Meteorological Office chief scientist Julia Slingo proclaimed yesterday "all the evidence suggests that climate change has a role to play" in the current precipitation and floods in SW England, and that "There is no evidence to counter the basic premise that a warmer world will lead to more intense daily and hourly rain events."
Rebuttal to Slingo's challenge to the climate skeptics "to provide me with the same level of scientific integrity of the evidence base - I can't see it, and nobody has come forward to counter...":
IPCC:
“There is limited to medium evidence available to assess climate-driven observed changes in the magnitude and frequency of floods at regional scales because the available instrumental records of floods at gauge stations are limited in space and time, and because of confounding effects of changes in land use and engineering. Furthermore, there is low agreement in this evidence, and thus overall low confidence at the global scale regarding even the sign of these changes.”
Floods 10X More Likely During Global Cooling Periods Vs. Global Warming Periods, EU Scientists Discover
Testimony of Dr. John Christy at House Subcommittee on Energy and Power Hearing
New paper finds floods and extreme precipitation were more common during the Little Ice Age
New paper finds mechanism by which the Sun controls floods in the European Alps
Article in nature says extreme weather events can't currently be attributed to global warming
New paper finds solar activity controlled heavy rainfall & flooding along major river in China over past 2000 years
New paper finds climate of northeastern US is highly sensitive to solar activity
New paper finds warming decreases floods
New paper shows no increase in precipitation over past 105 years, counter to global warming theory
New paper finds extreme floods and droughts occurred in China when CO2 was "safe"
New paper finds warming decreases floods
Was Nashville's flood caused by global warming?
Whoops: Global Warming Decreased Floods
New paper finds more evidence the Medieval Warming Period was global
Dame Slingo at UKMO Crosses the Line on Extreme Weather Attribution
Met Office blames global warming for floods. But then it also predicted below average precipitation for this winter. [@afneil on Twitter]
These are blatantly false statements countered by over 200 peer-reviewed published studies demonstrating that global warming decreases extreme precipitation and flooding. Slingo's claims are based highly flawed climate models, which even the IPCC admits cannot be used to support such claims. Slingo's MET Office report claims Britian's storms are "consistent with global warming," weasel words to defend a theory which is always said to be "consistent" with any weather event including warming, cooling, snow, droughts, and floods.
Excerpts below of Slingo's statements from the BBC and Bishop Hill, followed by links to several published papers demonstrating that global cooling leads to more frequent and extreme flooding, rather than global warming which climate alarmists claim is the culprit. Also included below are several papers finding decreased solar activity is linked to increased precipitation and flooding.
BBC: Met Office: Evidence 'suggests climate change link to storms'
Continue reading the main story
Climate change is likely to be a factor in the extreme weather that has hit much of the UK in recent months, the Met Office's chief scientist has said.
Dame Julia Slingo said the variable UK climate meant there was "no definitive answer" to what caused the storms.
“In a nutshell, while there is no definitive answer for the current weather patterns that we have seen, all the evidence suggests that climate change has a role to play in it,” Dame Julia said.The “clustering and persistence” of storms that have hit the UK was extremely unusual, she added. “We have seen exceptional weather. It is consistent with what we might expect from climate change.”
"But all the evidence suggests there is a link to climate change," she added.
"There is no evidence to counter the basic premise that a warmer world will lead to more intense daily and hourly rain events."
Julia Slingo on the storms
The Met Office and the Centre for Ecology and Hydrology (CEH) - a government research centre - have issued a joint report into the storms in south-west England. To mark the occasion Julia Slingo has taken to the airwaves, trying desperately to insinuate that there is a link to climate change:
Dame Julia said while none of the individual storms had been exceptional, the "clustering and persistence" were extremely unusual.
"We have seen exceptional weather," she said.
"We cannot say it's unprecedented, but it is certainly exceptional.
"Is it consistent with what we might expect from climate change?
"Of course.
"As yet there can be no definitive answer on the particular events that we have seen this winter, but if we look at the broader base of evidence then we see things that support the premise that climate change has been making a contribution."
Event: Julia Slingo on the weather: "what was that little bit extra that climate change has added...?"
Credit: BBC Radio 4
People:
Shaun Ley: BBC journalistProfessor Julia Slingo: Chief Scientist, UK Met Office
Shaun Ley: But what about the root causes of this winter's extreme weather? Well, the Chief Scientist at the Met Office has now come out more strongly than ever before, seeming to make a link between extreme weather and climate change. And Dame Julia Slingo joins us on the line, now. Dame Julia, you're convinced - or as satisfied as you can be - that there is a link between this winter's extreme weather and climate change.
Julia Slingo: Well, what we're saying very clearly is that, first of all, we understand the root causes of our very extreme run of weather - very prolonged unsettled weather, very, very wet - the wettest we've seen since 1766 in the southern part of the UK. We're saying that they - although we can understand it from the natural variability of the climate system, the extreme nature of the impacts, and indeed of the rainfall and the storminess, could be a manifestation of climate change. And we discuss that in some detail, in a very complete report that we've published today on our website, and it's available for the public to read.
Shaun Ley: The government always says it must rely on scientists, when it deals with issues of climate change. You, as a scientist, seem to be pointing the way towards more vigorous action by our government in Britain, and by governments around the world, to tackle climate change.
Julia Slingo: Yes, I think that's right. I think those of us who've worked in climate science, as I have for my whole career, we understand the fundamental physics that underpins climate change. We're looking now at what the records around the world are telling us - they're very clear, it's what the IPCC has published last year. And we're looking at a situation where: yes, the world is warming, we know that warmer air holds more water, we're beginning to detect an increase in intensity of daily and hourly rainfall rates, over the UK. We're looking at ongoing sea-level rise, a manifestation, of course, of global warming. And there are now some studies emerging that suggest that storminess is increasing, if we look at the long-term trends over the last century or so.
Shaun Ley: You seem to be saying that climate change deniers are simply wrong, and it's now time for governments to be much more robust - we're in danger of missing carbon emission targets, and really we've got to put on a much stronger act.
Julia Slingo: That's right. I mean, I think as scientists we always go back to the evidence base, and the report we've published is very clear about the evidence. I always challenge the climate sceptics to provide me with the same level of scientific integrity of the evidence base - I can't see it, and nobody has come forward to counter, as I say, the basic premise that if you have a warmer world, you are going to get more intense heavy rain rates on the daily/hourly time scale, as we're beginning to detect now, over the UK.
Shaun Ley: What you're saying is stark. You're saying this winter's extreme weather was avoidable, and man - mankind, all of us together - could have avoided this winter's extreme weather.
Julia Slingo: I'm not saying that entirely, because I think until we have done the definitive study on the contribution of global warming to this winter's extreme weather, we have to be very careful on statements as strong as that. Extreme weather is part of the natural cycle of weather and climate - that's very clear. What we need to understand now is how much global warming is adding to the extreme weather events that we see - and have always seen, I mean, we have always seen damaging weather in the UK. The question is: what was that little bit extra that climate change has added to it already? And how will climate change continue to add to extreme weather, as we go forward over the next few decades?
Shaun Ley: The Prime Minister, David Cameron, came to government pledging to be a "green" party. Are you disappointed? There seems to have been some sort of retreat from that, particularly under the pressure of austerity and recession.
Julia Slingo: It's not my place to comment. It's my job, as Chief Scientist of the Met Office, to give the government the best possible scientific evidence on which they can then make their decisions. And that's our job - we continue to work extremely hard to make sure that the science that we do is at the highest integrity, that we report it openly and transparently in the peer-reviewed science literature, and that is basically the way in which we've put together the report that was published today. It's a scientific report, it's the evidence base - I think, you know, the government then has to make its judgement on the best way to shape its policies, based on that evidence.
Shaun Ley: Dame Julia Slingo, Chief Scientist at the Met Office, thank you very much indeed.
REBUTTAL
IPCC:
“There is limited to medium evidence available to assess climate-driven observed changes in the magnitude and frequency of floods at regional scales because the available instrumental records of floods at gauge stations are limited in space and time, and because of confounding effects of changes in land use and engineering. Furthermore, there is low agreement in this evidence, and thus overall low confidence at the global scale regarding even the sign of these changes.”
Floods 10X More Likely During Global Cooling Periods Vs. Global Warming Periods, EU Scientists Discover
Testimony of Dr. John Christy at House Subcommittee on Energy and Power Hearing
New paper finds floods and extreme precipitation were more common during the Little Ice Age
New paper finds mechanism by which the Sun controls floods in the European Alps
Article in nature says extreme weather events can't currently be attributed to global warming
New paper finds solar activity controlled heavy rainfall & flooding along major river in China over past 2000 years
New paper finds climate of northeastern US is highly sensitive to solar activity
New paper finds warming decreases floods
New paper shows no increase in precipitation over past 105 years, counter to global warming theory
New paper finds extreme floods and droughts occurred in China when CO2 was "safe"
New paper finds warming decreases floods
Was Nashville's flood caused by global warming?
Whoops: Global Warming Decreased Floods
New paper finds more evidence the Medieval Warming Period was global
Dame Slingo at UKMO Crosses the Line on Extreme Weather Attribution
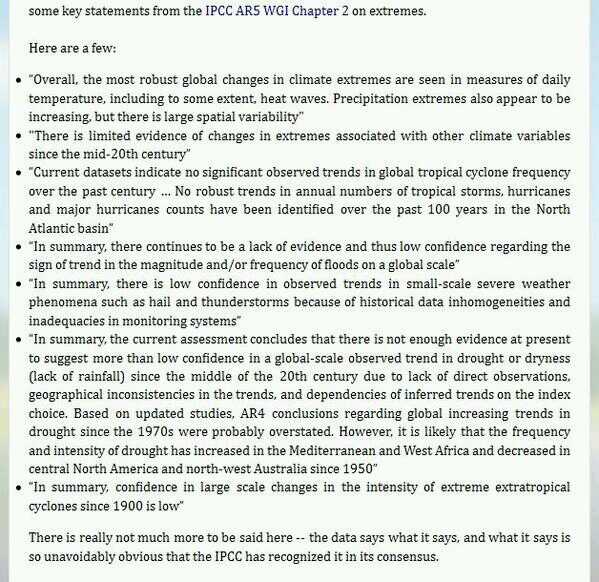
Key statements from the IPCC AR5 on extremes, courtesy of Dr. Roger Pielke, Jr.:
Met Office blames global warming for floods. But then it also predicted below average precipitation for this winter. [@afneil on Twitter]
Thursday, January 24, 2013
New paper finds IPCC climate models have 'wide disagreement about the sign of change' for precipitation
A paper published today in the Journal of Geophysical Research finds that the IPCC climate models do not agree on whether precipitation will increase or decrease in some regions. According to the authors, "Particularly for the precipitation-based indices, there can be a wide disagreement about the sign of change between the models in some regions. "
Climate extreme indices in the CMIP5 multi-model ensemble. Part 2: Future climate projections
J. Sillmann1,*,
V. V. Kharin1,
F. W. Zwiers2,
X. Zhang3,
D. Bronaugh4
Abstract
Climate extreme indices in the CMIP5 multi-model ensemble. Part 2: Future climate projections
J. Sillmann1,*,
V. V. Kharin1,
F. W. Zwiers2,
X. Zhang3,
D. Bronaugh4
Abstract
This study provides an overview of projected changes in climate extreme indices defined by the Expert Team on Climate Change Detection and Indices (ETCCDI). The temperature- and precipitation-based indices are computed with a consistent methodology for climate change simulations using different emission scenarios in the Coupled Model Intercomparison Project Phase 3 (CMIP3) and Phase 5 (CMIP5) multi-model ensembles. We analyze changes in the indices on global and regional scales over the twenty-first century relative to the reference period 1981–2000. In general, changes in indices based on daily minimum temperatures are found to be more pronounced than in indices based on daily maximum temperatures. Extreme precipitation generally increases faster than total wet-day precipitation. In regions, such as Australia, Central America, South Africa and the Mediterranean region, increases in consecutive dry days coincide with decreases in heavy precipitation days and maximum consecutive 5-day precipitation, which indicates future intensification of dry conditions in these regions. Particularly for the precipitation-based indices, there can be a wide disagreement about the sign of change between the models in some regions. Changes in temperature and precipitation indices are most pronounced under RCP8.5, with projected changes exceeding those discussed in previous studies based on SRES scenarios. The complete set of indices is made available via the ETCCDI indices archive to encourage further studies on the various aspects of changes in extremes.
Tuesday, November 27, 2012
New paper shows extreme weather was less common over past 30 years compared to past 2 centuries
A paper published today in Environmental Research Letters reconstructs climate extreme events between 1500 and 2009 from tree ring data throughout Europe and shows extreme events have been relatively less common over the past 30 years in comparison to the past 2 centuries. The data also shows the 20th century [1900-2009] had 24 years with the climate extreme index at 2 or greater vs. 27 years during the 19th century. The paper adds to several other peer-reviewed papers demonstrating that extreme weather is less common with global warming.
 |
| Blow-up of the last 230 years from the bottom graph below. Number of extreme events shown on vertical axis. The 20th century had two highly extreme years in 1948 and 1976, whereas the 19th century had three. The 20th century had 24 years with climate extreme index => 2 vs. the 19th century had 27 years with climate extreme index => 2. |
 |
Note from the paper:
"In the pre-instrumental period, spatial patterns of reconstructed growth extremes become less distinct with decreasing site replication back in time. Yet—while we refrain from making direct comparisons with early instrumental data (e.g. Bohm¨ et al 2010)—it is clear from our results that climatically driven and spatially pervasive extensive growth extremes occurred in Europe during the past centuries."
Environmental Research Letters Volume 7 Number 4
Flurin Babst et al 2012 Environ. Res. Lett. 7 045705 doi:10.1088/1748-9326/7/4/045705
500 years of regional forest growth variability and links to climatic extreme events in Europe
OPEN ACCESS FOCUS ON EXTREME EVENTS AND THE CARBON CYCLE
Flurin Babst1, Marco Carrer2, Benjamin Poulter3, Carlo Urbinati4, Burkhard Neuwirth5 and David Frank1,6
Show affiliationsLetter
Climatic extreme events strongly affect forest growth and thus significantly influence the inter-annual terrestrial carbon balance. As we are facing an increase in frequency and intensity of climate extremes, extensive empirical archives are required to assess continental scale impacts of temperature and precipitation anomalies. Here we divide a tree-ring network of approximately 1000 sites into fifteen groups of similar high-frequency growth variability to reconstruct regional positive and negative extreme events in different parts of Europe between 1500 and 2008. Synchronized growth maxima or minima within and among regions indicate eighteen years in the pre-instrumental period and two events in the 20th century (1948, 1976) with extensive radial growth fluctuations. Comparisons with instrumental data showed that the European tree-ring network mirrors the spatial extent of temperature and precipitation extremes, but the interpretation of pre-instrumental events is challenged by lagged responses to off-growing season climate extremes. We were able to attribute growth minima in subsequent years to unfavourable August–October conditions and to mild climate during winter months associated with respiratory carbon losses. Our results emphasize the importance of carry-over effects and species-specific growth characteristics for forest productivity. Furthermore, they promote the use of regional tree-ring chronologies in research related to climate variability and terrestrial carbon sink dynamics.
Saturday, May 25, 2013
Did we say wet becomes wetter and dry becomes drier?
Oops.....we meant wet becomes drier and drier becomes wetter. And we found that there has been a global decline in drought over the last 70 years.
From the latest edition of the NIPCC Report:
Changes in global precipitation over land in a warming world
Reference: Sun, F., Roderick, M.L. and Farquhar, G.D. 2012. Changes in the variability of global land precipitation. Geophysical Research Letters 39: 10.1029/2012GL053369.
From the latest edition of the NIPCC Report:
Changes in global precipitation over land in a warming world
Reference: Sun, F., Roderick, M.L. and Farquhar, G.D. 2012. Changes in the variability of global land precipitation. Geophysical Research Letters 39: 10.1029/2012GL053369.
Writing as background for their study, Sun et al. (2012) state that "with global warming, climate models project increased precipitation variability in most regions at daily (O'Gorman and Schneider, 2009), monthly (Benestad, 2006) and inter-annual (Rind et al., 1989; Held and Soden, 2006; Boer, 2009; Wetherald, 2010) timescales," while additionally noting that "expectations are for precipitation extremes in storm events to increase with the saturation vapor pressure in the atmosphere," citing Trenberth et al. (2003).
In a study designed to assess the virtues (or not) of climate model precipitation projections, Sun et al. analyzed "observations of monthly precipitation (1940-2009) over the global land surface using a new theoretical framework that can distinguish changes in global precipitation variance between space and time."
In doing so, the three Australian researchers report discovering that "on average, dry regions/months became wetter and wet regions/months became drier over the 1940-2009 period," and they say that "this conclusion holds in all available databases and also holds for 1940-1999." In addition, they further remark that the patterns observed "show no relationship to local or global changes in temperature," and that "if anything, these results constitute a slight decline in meteorological drought over the last 70 years."
Once again, some of the most basic predictions of the world's climate alarmists are found to be invalid for the entire world.
Additional References:
Benestad, R.E. 2006. Can we expect more extreme precipitation on the monthly time scale? Journal of Climate 19: 630-637.
Boer, G.J. 2009. Changes in interannual variability and decadal potential predictability under global warming. Journal of Climate 22: 3098-3109.
Held, I.M. and Soden, B.J. 2006. Robust responses of the hydrological cycle to global warming. Journal of Climate 19: 5686-5699.
O'Gorman, P.A. and Schneider, T. 2009. The physical basis for increases in precipitation extremes in simulations of 21st-century climate change. Proceedings of the National Academy of Sciences USA 106: 14,773-14,777.
Rind, D., Goldberg, R. and Ruedy, R. 1989. Change in climate variability in the 21st century. Climatic Change 13: 5-37.
Trenberth, K.E., Dai, A., Rasmussen, R.M. and Parsons, D.B. 2003. The changing character of precipitation. Bulletin of the American Meteorological Society 84: 1205-1217.
Wetherald, R.T. 2010. Changes of time mean state and variability of hydrology in response to a doubling and quadrupling of CO2. Climatic Change 102: 651-670.
In a study designed to assess the virtues (or not) of climate model precipitation projections, Sun et al. analyzed "observations of monthly precipitation (1940-2009) over the global land surface using a new theoretical framework that can distinguish changes in global precipitation variance between space and time."
In doing so, the three Australian researchers report discovering that "on average, dry regions/months became wetter and wet regions/months became drier over the 1940-2009 period," and they say that "this conclusion holds in all available databases and also holds for 1940-1999." In addition, they further remark that the patterns observed "show no relationship to local or global changes in temperature," and that "if anything, these results constitute a slight decline in meteorological drought over the last 70 years."
Once again, some of the most basic predictions of the world's climate alarmists are found to be invalid for the entire world.
Additional References:
Benestad, R.E. 2006. Can we expect more extreme precipitation on the monthly time scale? Journal of Climate 19: 630-637.
Boer, G.J. 2009. Changes in interannual variability and decadal potential predictability under global warming. Journal of Climate 22: 3098-3109.
Held, I.M. and Soden, B.J. 2006. Robust responses of the hydrological cycle to global warming. Journal of Climate 19: 5686-5699.
O'Gorman, P.A. and Schneider, T. 2009. The physical basis for increases in precipitation extremes in simulations of 21st-century climate change. Proceedings of the National Academy of Sciences USA 106: 14,773-14,777.
Rind, D., Goldberg, R. and Ruedy, R. 1989. Change in climate variability in the 21st century. Climatic Change 13: 5-37.
Trenberth, K.E., Dai, A., Rasmussen, R.M. and Parsons, D.B. 2003. The changing character of precipitation. Bulletin of the American Meteorological Society 84: 1205-1217.
Wetherald, R.T. 2010. Changes of time mean state and variability of hydrology in response to a doubling and quadrupling of CO2. Climatic Change 102: 651-670.
Thursday, August 9, 2012
New paper finds little evidence of changes in extreme weather or link to AGW
A paper published today in the Bulletin of the American Meteorological Society presents a review of the current state of knowledge regarding extreme weather. The authors, most of whom are from NOAA, find no significant trends in severe thunderstorms, overall ice storms, or change in the percentage of the contiguous US impacted by extreme snowfall. According to the authors, trends in tropical cyclones are controversial and indeterminate, although other authors find global cyclone activity is at a historical low. The authors state, "attribution of trends to anthropogenic forcing [man-made global warming] remains controversial."
Although the authors do find an increase in extreme precipitation, they are uncertain of the cause, "although there is evidence that increasing atmospheric water vapor may be one factor." Satellite and weather balloon records, however, indicate atmospheric water vapor has been on a generally declining trend since 1948.
Bulletin of the American Meteorological Society 2012 ; e-View
doi: http://dx.doi.org/10.1175/BAMS-D-11-00262.1
Monitoring and Understanding Trends in Extreme Storms: State of Knowledge
Kenneth E. Kunkel1, Thomas R. Karl2, Harold Brooks3, James Kossin2, Jay H. Lawrimore2Derek Arndt2, Lance Bosart4, David Changnon5, Susan L. Cutter6, Nolan Doesken7, Kerry Emanuel8, Pavel Ya. Groisman2, Richard W. Katz9, Thomas Knutson10, James O'Brien11, Christopher J. Paciorek19, Thomas C. Peterson2, Kelly Redmond12, David Robinson13, Jeff Trapp14, Russell Vose2, Scott Weaver15, Michael Wehner16, Klaus Wolter17, Donald Wuebbles18
Abstract: The state of knowledge regarding trends and an understanding of their causes is presented for a specific subset of extreme weather and climate types. For severe convective storms (tornadoes, hail storms, and severe thunderstorms), differences in time and space of practices of collecting reports of events make the use of the reporting database to detect trends extremely difficult. Overall, changes in the frequency of environments favorable for severe thunderstorms have not been statistically significant. For extreme precipitation, there is strong evidence for a nationally-averaged upward trend in the frequency and intensity of events. The causes of the observed trends have not been determined with certainty, although there is evidence that increasing atmospheric water vapor may be one factor. For hurricanes and typhoons, robust detection of trends in Atlantic and western North Pacific tropical cyclone (TC) activity is significantly constrained by data heterogeneity and deficient quantification of internal variability. Attribution of past TC changes is further challenged by a lack of consensus on the physical linkages between climate forcing and TC activity. As a result, attribution of trends to anthropogenic forcing remains controversial. For severe snowstorms and ice storms, the number of severe regional snowstorms that occurred since 1960 was more than twice that of the preceding 60 years. There are no significant multi-decadal trends in the areal percentage of the contiguous U.S. impacted by extreme seasonal snowfall amounts since 1900. There is no distinguishable trend in the frequency of ice storms for the U.S. as a whole since 1950.
Although the authors do find an increase in extreme precipitation, they are uncertain of the cause, "although there is evidence that increasing atmospheric water vapor may be one factor." Satellite and weather balloon records, however, indicate atmospheric water vapor has been on a generally declining trend since 1948.
Bulletin of the American Meteorological Society 2012 ; e-View
doi: http://dx.doi.org/10.1175/BAMS-D-11-00262.1
Monitoring and Understanding Trends in Extreme Storms: State of Knowledge
Kenneth E. Kunkel1, Thomas R. Karl2, Harold Brooks3, James Kossin2, Jay H. Lawrimore2Derek Arndt2, Lance Bosart4, David Changnon5, Susan L. Cutter6, Nolan Doesken7, Kerry Emanuel8, Pavel Ya. Groisman2, Richard W. Katz9, Thomas Knutson10, James O'Brien11, Christopher J. Paciorek19, Thomas C. Peterson2, Kelly Redmond12, David Robinson13, Jeff Trapp14, Russell Vose2, Scott Weaver15, Michael Wehner16, Klaus Wolter17, Donald Wuebbles18
Abstract: The state of knowledge regarding trends and an understanding of their causes is presented for a specific subset of extreme weather and climate types. For severe convective storms (tornadoes, hail storms, and severe thunderstorms), differences in time and space of practices of collecting reports of events make the use of the reporting database to detect trends extremely difficult. Overall, changes in the frequency of environments favorable for severe thunderstorms have not been statistically significant. For extreme precipitation, there is strong evidence for a nationally-averaged upward trend in the frequency and intensity of events. The causes of the observed trends have not been determined with certainty, although there is evidence that increasing atmospheric water vapor may be one factor. For hurricanes and typhoons, robust detection of trends in Atlantic and western North Pacific tropical cyclone (TC) activity is significantly constrained by data heterogeneity and deficient quantification of internal variability. Attribution of past TC changes is further challenged by a lack of consensus on the physical linkages between climate forcing and TC activity. As a result, attribution of trends to anthropogenic forcing remains controversial. For severe snowstorms and ice storms, the number of severe regional snowstorms that occurred since 1960 was more than twice that of the preceding 60 years. There are no significant multi-decadal trends in the areal percentage of the contiguous U.S. impacted by extreme seasonal snowfall amounts since 1900. There is no distinguishable trend in the frequency of ice storms for the U.S. as a whole since 1950.
Subscribe to:
Posts (Atom)