Showing posts sorted by relevance for query water vapor negative feedback. Sort by date Show all posts

Sunday, February 2, 2014

New paper finds negative-feedback cooling from water vapor could almost completely offset warming from CO2

A new paper published in the Journal of Geophysical Research Atmospheres finds water vapor can act as a negative-feedback cooling effect to significantly counteract anthropogenic global warming. 

According to the paper, "The satellite observations have shown that warming of the tropical Indian Ocean and tropical Western Pacific Ocean -- with resulting increased precipitation and water vapor there -- causes the opposite effect of cooling in the tropical tropopause region above the warming sea surface. Once the tropical tropopause cools, less water vapor is present in the tropical tropopause and also above in the stratosphere,

Since water vapor is a very strong greenhouse gas, this effect leads to a negative feedback on climate change. That is, the increase in water vapor due to enhanced evaporation from the warming oceans is confined to the near- surface area, while the stratosphere becomes drier. Hence, this effect may actually slightly weaken the more dire forecasted aspects of an increasing warming of our climate, the scientists say."


The paper itself says, "In the lower stratosphere, the changes in water vapor and temperature due to projected future sea surface temperatures are of similar strength to, though slightly weaker than, that due directly to projected future CO2, ozone, and methane," which would indicate that this negative-feedback cooling effect is almost equivalent to the warming effect of man-made CO2, ozone, and methane and could almost fully offset global warming. 

The paper is similar to another recent paper published in Nature Climate Change, finding warming of sea surface temperatures in the Indian and Pacific Ocean 'warm pool' is causing less water vapor to enter the top of the troposphere and could cause global cooling from this negative-feedback. The papers add to many others finding water vapor acts as a negative-feedback, not positive as assumed by IPCC climate models. Climate model false assumptions of positive-feedback from water vapor are the entire basis of Mann-made global warming alarm. 


Nature can, selectively, buffer human-caused global warming, say scientists

February 2, 2014

Summary:


Can naturally occurring processes selectively buffer the full brunt of global warming caused by greenhouse gas emissions resulting from human activities? Yes, says a group of researchers in a new study.


As the globe warms, ocean temperatures rise, leading to increased water vapor escaping into the atmosphere. Water vapor is the most important greenhouse gas, and its impact on climate is amplified in the stratosphere.

Can naturally occurring processes selectively buffer the full brunt of global warming caused by greenhouse gas emissions resulting from human activities?

Yes, find researchers from the Hebrew University of Jerusalem, Johns Hopkins University in the US and NASA's Goddard Space Flight Center.

As the globe warms, ocean temperatures rise, leading to increased water vapor escaping into the atmosphere. Water vapor is the most important greenhouse gas, and its impact on climate is amplified in the stratosphere.

In a detailed study, the researchers from the three institutions examined the causes of changes in the temperatures and water vapor in the tropical tropopause layer (TTL). The TTL is a critical region of our atmosphere with characteristics of both the troposphere below and the stratosphere above.

The TTL can have significant influences on both atmospheric chemistry and climate, as its temperature determines how much water vapor can enter the stratosphere. Therefore, understanding any changes in the temperature of the TTL and what might be causing them is an important scientific question of significant societal relevance, say the researchers.

The Israeli and US scientists used measurements from satellite observations and output from chemistry-climate models to understand recent temperature trends in the TTL. Temperature measurements show where significant changes have taken place since 1979.

The satellite observations have shown that warming of the tropical Indian Ocean and tropical Western Pacific Ocean -- with resulting increased precipitation and water vapor there -- causes the opposite effect of cooling in the TTL region above the warming sea surface. Once the TTL cools, less water vapor is present in the TTL and also above in the stratosphere,

Since water vapor is a very strong greenhouse gas, this effect leads to a negative feedback on climate change. That is, the increase in water vapor due to enhanced evaporation from the warming oceans is confined to the near- surface area, while the stratosphere becomes drier. Hence, this effect may actually slightly weaken the more dire forecasted aspects of an increasing warming of our climate, the scientists say.
The researchers are Dr. Chaim Garfinkel of the Fredy and Nadine Herrmann Institute of Earth Sciences at the Hebrew University and formerly of Johns Hopkins University, Dr. D. W. Waugh and Dr. L. Wang of Johns Hopkins, and Dr. L. D. Oman and Dr. M. M. Hurwitz of the Goddard Space Flight Center. Their findings have been published in theJournal of Geophysical Research: Atmospheres, and the research was also highlighted in Nature Climate Change.

Story Source:

The above story is based on materials provided by Hebrew University of Jerusalem.Note: Materials may be edited for content and length.

Journal Reference:
C. I. Garfinkel, D. W. Waugh, L. D. Oman, L. Wang, M. M. Hurwitz. Temperature trends in the tropical upper troposphere and lower stratosphere: Connections with sea surface temperatures and implications for water vapor and ozone. Journal of Geophysical Research: Atmospheres, 2013; 118 (17): 9658 DOI: 10.1002/jgrd.50772


Temperature trends in the tropical upper troposphere and lower stratosphere: Connections with sea surface temperatures and implications for water vapor and ozone


C. I. Garfinkel1,2,*, D. W. Waugh1, L. D. Oman3, L. Wang1, M. M. Hurwitz3,4

Satellite observations and chemistry-climate model experiments are used to understand the zonal structure of tropical lower stratospheric temperature, water vapor, and ozone trends. The warming in the tropical upper troposphere over the past 30 years is strongest near the Indo-Pacific warm pool, while the warming trend in the western and central Pacific is much weaker. In the lower stratosphere, these trends are reversed: the historical cooling trend is strongest over the Indo-Pacific warm pool and is weakest in the western and central Pacific. These zonal variations are stronger than the zonal-mean response in boreal winter. Targeted experiments with a chemistry-climate model are used to demonstrate that sea surface temperature (hereafter SST) trends are driving the zonal asymmetry in upper tropospheric and lower stratospheric tropical temperature trends. Warming SSTs in the Indian Ocean and in the warm pool region have led to enhanced moist heating in the upper troposphere, and in turn to a Gill-like response that extends into the lower stratosphere. The anomalous circulation has led to zonal structure in the ozone and water vapor trends near the tropopause, and subsequently to less water vapor entering the stratosphere. The radiative impact of these changes in trace gases is smaller than the direct impact of the moist heating. Projected future SSTs appear to drive a temperature and water vapor response whose zonal structure is similar to the historical response. In the lower stratosphere, the changes in water vapor and temperature due to projected future SSTs are of similar strength to, though slightly weaker than, that due directly to projected future CO2, ozone, and methane.

Wednesday, November 19, 2014

Why water vapor slows cooling at night & slows warming during the day

Recent comments by physicist Daniel Sweger explain why water vapor/humidity slows cooling at night, and why water vapor has the opposite effect of slowing warming during the day. The comments relate to recent posts including "Modeling of the Earth’s Planetary Heat Balance with an Electrical Circuit Analogy," as well as posts from a few years ago (reposted below) discussing Dr. Sweger's analysis finding the correlation of humidity and temperature is clearly negative, and the effect of water vapor on climate is a net negative-feedback cooling effect:

Dr. Sweger: In this paper I compiled 2 years of data showing the relationship of both relative and absolute humidity and daily temperature in two different locations on the continent of Africa. In this paper I demonstrated that the correlation of humidity and temperature is clearly negative.

Reply: Humidity increases nighttime temperatures

Dr. Sweger: I agree, and for the same reason that during the day high humidity slows the increase in temperature. The reason is that heat energy only flows in one direction: from a higher to a lower temperature. It is the same as in an electrical circuit. Electricity only flows from a higher potential to a lower one. During the day the energy from the sun is flowing from the sun towards the surface of the earth. The high specific heat of water impedes the flow of heat in the same way as a higher value of a resistor impedes the flow of electrons. At night the situation is reversed. Now the heat energy is flowing away from the earth into a very cold space, and the presence of water vapor impedes the flow of heat energy away from the earth’s surface. Thus the surface temperature decreases less on a humid night than a dry night.

The purpose of the paper was to demonstrate that any feedback loop between the effect of “greenhouse gases” and the earth’s surface must be negative, since it would result in an increase in water vapor, and thus an increase in the impedance of heat flow.


Reposts of two prior HS posts on Dr. Sweger's analysis:

Tuesday, March 13, 2012 [REPOST]

Water vapor, not CO2, controls climate and acts as a negative feedback

Physicist Daniel Sweger refutes the catastrophic AGW hypothesis in his paper The Climate Engine, showing that CO2 has a negligible effect upon climate and that water vapor acts as a negative feedback to global warming. Dr. Sweger uses data from 3 locales to show an inverse relationship between humidity and temperature. He notes,
"In the positive feedback mechanism as proposed by the global warming proponents this behavior would be reversed. Then the data would show a positive relationship between moisture content and temperature. But it does not. As suggested before, data is the language of science, not mathematical models."

The data clearly shows that the relationship between the amount of water vapor in the air and temperature is negative 

From the conclusion of The Climate Engine:

The role of water vapor in determining  surface temperatures is ultimately a dominant one. During daylight hours it moderates the sun’s energy, at night it acts like a blanket to slow the loss of heat, and carries energy from the warm parts of the earth to the cold. Compared to that, if carbon dioxide has an effect, it must be negligible.

It is also clear from the data presented above that water vapor acts with a negative feedback. The data clearly shows that the relationship between the amount of water vapor in the air and temperature is negative; that is, the higher the amount of water vapor in the atmosphere the lower the surface temperature. In that regard, it almost acts as a thermostat.

As the air cools as a result of an increasing moisture content in the atmosphere, there is a decrease in the amount of water vapor produced by evaporation. Eventually this decrease of the level of water vapor being introduced into the atmosphere results in a decrease in moisture content. At this point more sunlight reaches the earth’s surface resulting in higher temperatures and increasing evaporation.

In the positive feedback mechanism as proposed by the global warming proponents this behavior would be reversed. Then  the data would show  a positive  relationship  between moisture  content and temperature. But it does not.

As suggested before, data is the language of science, not mathematical models.

About the Author:
Dr. Daniel M. Sweger, AB (Physics, Duke University, 1965) and Ph.D. (Solid State Physics, American University, 1974) has been a research scientist at NIST, where he was active in a variety of research areas, including cryogenic thermometry, solid state and nuclear physics, and molecular spectroscopy. He also operated a computer software business and performed  consulting for the US Army. He is now semi- retired and is an adjunct instructor at National College of Business and Technology (www.ncbt.edu), where, among other subjects, he teaches Environmental Science.

Saturday, April 2, 2011 [REPOST]

Physicist: Carbon dioxide has negligible effect on climate
Semi-retired physicist Dr. Daniel M. Sweger has been a research scientist at the National Institute of Standards and Technology, where he was active in a variety of research areas, including cryogenic thermometry, solid state and nuclear physics, and molecular spectroscopy.

Dr. Sweger's new paper, Earth’s Climate Engine (PDF), finds that if carbon dioxide has an effect on climate, it must be negligible. Instead, he finds on the basis of data and theory that water vapor is the dominant influence on climate, and its influence is the opposite of that assumed by the IPCC climate computer models.

From the Summary:
… While models can be useful, the results must be compared to actual measurements, i.e. data. Data is the language of science, but little has been done in that regard with the climate change models.

It is the premise of the author that water vapor is the dominant influence in determining and understanding global climate. Water vapor is much more abundant in the atmosphere than carbon dioxide, and its physical properties make it more important as well. During daylight hours it moderates the sun’s energy, at night it acts like a blanket to slow the loss of heat, and it carries energy from the warm parts of the earth to the cold. Compared to that, if carbon dioxide has any effect it must be negligible. Thus, the purpose of this paper is to explore the effect of water vapor on climate.

Detailed calculations and analysis of data from several locations clearly demonstrate that the effect of water vapor on temperature dominates any proposed effect of carbon dioxide. Furthermore, it is clear from the data presented that water vapor acts with a negative feedback on temperature, not a positive one. That is, the data demonstrate that increasing the level of water vapor in the atmosphere results in a decrease of temperature,not an increase as predicted by the climate models. In essence, atmospheric water vapor acts as a thermostat.

These results call into question the validity of using the results of the current general climate change models, particularly as the basis for policy decision making.
SOURCE

Related: Greenhouse Gases DO Have A Profound Effect On The Climate

Wednesday, May 23, 2012

New paper finds water vapor feedback is strongly negative

The IPCC manufactures climate alarm by assuming CO2 controls water vapor to produce a runaway positive feedback system. Physicist Clive Best has posted his new paper showing that water vapor feedback is instead strongly negative, based on both the Faint Sun Paradox and a comparison of 5600 weather stations in the global CRUTEM4 temperature and humidity database. Peer-reviewed publications by Paltridge and others also find water vapor feedback is strongly negative. Without positive water vapor feedback, the IPCC's case for catastrophic man-made climate change collapses.

Related: A simple disproof of the runaway greenhouse theory and basis for climate alarm


Evidence for Negative Water Feedback

Abstract: Positive linear climate feedback for combined water effects is shown to be incompatible with the Faint Sun Paradox. In particular, feedback values of ~2.0 W/m2K-1favored by current GCM models lead to non physical results at solar radiation levels present one billion years ago. A simple model is described whereby Earth like planets with large liquid water surfaces can self-regulate temperature for small changes in incident solar radiation. The model assumes that reflective cloud cover increases while normalized greenhouse effects decrease as the sun brightens. Net water feedback of the model is strongly negative.  Direct evidence for negative water feedback is found in CRUTEM4 station data by comparing temperature anomalies for arid regions (deserts and polar regions) with those for humid regions (mainly saturated tropics). All 5600 weather stations were classified according to the Köppen-Geiger climatology [9]. Two separate temperature anomaly series from 1900 to 2011 were calculated for each region. A clear difference in temperature response is observed. Assuming the difference is due to atmospheric water content, a water feedback value of -1.5 +/- 0.8 W/m2K-1 can be derived.

I.            INTRODUCTION

The Faint Sun Paradox was first proposed by Carl Sagan [1] who pointed out that the geological evidence that liquid oceans existed on Earth 4 billion years ago appears incompatible with a solar output 30% dimmer than today. The sun is a main sequence star whose output is known to increase slowly with age. The total change in solar radiation over this long period turns out to be huge ~ 87 W/m2.   It has been argued that an enhanced greenhouse effect due to very high CO2 and/or CH4 concentrations could resolve this paradox [2]. However, recent geological evidence does not support CO2 as being responsible but instead the authors propose a greater ocean surface leading lower albedo as a likely solution [3]. Others have suggested that high cirrus clouds effectively warmed the Earth [4]. Although the atmosphere must have been very different before photosynthesis began, the presence of large liquid oceans still implies that clouds and water vapor played a similar role in the Earth’s energy balance then, as they do today.

II.            MODELS

All current IPCC models adopt net positive feedbacks for water vapor and clouds [6]. A doubling of CO2 increases TOA radiative forcing by ~3.6 W/m2 causing a baseline surface temperature rise of about 1°C to restore global energy balance through increased outgoing Infrared [5]. GCM models predict larger temperature rises ranging from 2-5°C due to these positive feedbacks. What do positive feedbacks imply for the Faint Sun Paradox? For a change in forcing DS, a feedback strength F, and G0 as the baseline response, the temperature rise DT is given by
DT = (DS +F.DT)G0
Black body radiation from the Earth’s surface is the primary negative feedback to any temperature rise DT.
DT  =DS/(1/ G0 -F)                         1/ G0 = 4?T= 3.75 W/m2K-1    T=288K
GCM model feedbacks F range from +1.6 to 2.5 with an average positive feedback of ~ 2.0 W/m2K-1  [6].
The sun has brightened 30% over the last 4 billion years and current average incident solar radiation is ~342 watts/m2. Assuming a slow linear increase of solar radiation with time yields a net forcing increase of 0.02 W/m2 every 1 million years. The temperature response to this forcing has been calculated for feedback values   F=-2, 0, +2. This can be integrated backwards 4 billion years from current temperatures. The results are shown in Figure 1.
Figure 1: Past temperatures extrapolating backwards from today (T=288ºK) assuming different linear feedback values.
It is apparent that a simple linear positive feedback of +2 leads to unphysical results. The basic problem is that if the temperature falls sufficiently so that 4?T3= F then a singularity occurs ~1.5 billion years ago.  Instead a negative feedback value of -2 W/m2K-1  is more compatible both with current temperatures and with the Faint Sun Paradox..
The evidence is that global surface temperatures have changed rather little over the Earth’s history.  It therefore seems likely that feedbacks were negative during the early lifetime of the Earth to avoid run away surface heating as the sun brightened.  The continuous ~70% surface coverage of water on Earth has apparently stabilized global temperatures. A simple model of how this could work is described next, in analogy with Daisy World proposed by James Lovelock to justify Gaia theory [7].
remainder at CliveBest.com

Thursday, March 15, 2012

A simple disproof of the runaway greenhouse theory & basis of climate alarm

Commenter Carl Brehmer has produced a highly-recommended video of his scientific study of the effect of humidity on daily, monthly and yearly temperatures. The video explains in simple terms why the alarmist runaway greenhouse theory is impossible due to the negative feedback from water vapor.

Carl's comment on the Water vapor, not CO2, controls climate and acts as a negative feedback thread:
What an interesting example of synergy. I recently posted a video on YouTube that outlined the results of an experiment that I performed that showed the same results--the presence of water in a climate system produces an overwhelming negative feedback against diurnal changes in temperature and overall those climate systems that are more humid are on average cooler than arid climates. 
Beyond that, and something that I didn't get into in the video, is the fact that the phenomenon of "moist convection" that drives the strong upward convection currents that creates thunderstorms operates in direct opposition to the idea that warm moist air somehow resists the forces of nature that compel it to ascend and cool while it dwells near the surface of the earth driving a heating feedback loop. 


From Carl Brehmer's website


“An essential element of the “greenhouse effect” hypothesis is the positive “water vapor feedback” hypothesis.  That is, if something causes an increase in the temperature this will cause an increase in the evaporation of water into water vapor.  This new humidity will absorb more of the infrared radiation coming off of the ground.  This increased absorption of infrared radiation is believed to warm the air even further. This makes the air able to hold even more water vapor and this result in even more evaporation, which increases the humidity even further and the cycle starts over.  This is called a “positive” feedback, since water vapor is believed to amplify atmospheric warming.  Being curious about the truth of this hypothesis I designed a simple experiment to study the effect of rising and falling levels of humidity on soil and air temperature and discovered that 1) the addition of water to a climate system exerts a significant negative feedback against temperature changes night and day, 2) water vapor has the same graphical relationship to temperature that insulin has to blood sugar and insulin is known to exert a strong negative feedback against blood sugar levels and 3) over the course of time the addition of water to a climate system causes a perceptible drop in the yearly mean temperature.”


Full script of the above video:  Is Water Vapor Feedback Positive or Negative.pdf

Monday, December 9, 2013

Analysis finds both water vapor & increased CO2 act as negative feedbacks to cool the Earth surface

A post today from physicist Clive Best's blog demonstrates why both increased CO2 and water vapor act as net negative feedbacks to cool the earth surface, the opposite of climate model assumptions.

Lapse rate feedback


In the tropics the tropopause is much higher in altitude than in temperate regions. The reason is for this is that warm ocean surfaces cool by evaporation moving latent heat upwards where it heats the upper atmosphere through condensation. The lapse rate moves towards the moist lapse rate. The tropopause is where the lapse rate peters out because radiation from GHGs to space dominates over convection. The tropopause is much higher in the tropics because there is so much water vapour in the atmosphere that radiation can only dominate where H2O wavelengths are no longer opaque. Despite this the temperature at these heights is not less than in temperate zones and the radiation loss is significant. This shows how the troposphere lapse rate and height is defined by greenhouse gas concentrations. If you add more water vapour to the atmosphere the troposphere increases in height. This is a negative feedback because more H2O does not lead to enhanced surface warming. On the contrary surface temperatures are stabilised by evaporation
What then happens if you add more CO2 ? Essentially the same negative feedback must occur. The effective height for CO2 radiative cooling to space increases to an initially colder level so leading to a slight increase in forcing. This slight forcing at the surface must also lead to more evaporation from the ocean reducing the lapse rate and thereby increasing the temperature of the effective height for CO2 radiation to space. The result is a negative feedback counteracting the original CO2 forcing.
This same effect happens every day in the tropics as solar radiation increases around midday then so too does evaporation. This is a strong negative feedback keeping ocean temperatures below ~30 deg.C . Exactly the same effect must occur for CO2.
I have been away from the UK for 5 weeks in Australia and Vietnam. Even Darwin ocean temperatures are below 30c while the air approaches 100% relative humidity and 38 C during midday. It then rains most days cooling the surface. Extreme temperatures only occur in deserts where there are no evaporation sources. Otherwise the oceans stabilise temperatures on Earth.

Sunday, March 6, 2011

Paper: Water vapor feedback is negative, not positive as assumed by IPCC alarmists

A new paper finds that observations of atmospheric water vapor show a decrease with global warming, leading to a negative feedback on global temperature, not positive as assumed by alarmist IPCC computer model projections. The entire basis of global warming alarmism is that a supposed 1.0-1.2C warming due to a doubling of CO2 levels (which will take 234 years at the current rate) is amplified by positive water vapor feedback to 2-5C. This paper finds water vapor feedback is instead negative, resulting in only a 0.3C warming due to doubled CO2 with water vapor feedback.

THE ASSOCIATION OF ALBEDO AND OLR RADIATION WITH VARIATIONS OF PRECIPITATION – IMPLICATIONS FOR AGW
William M. Gray and Barry Schwartz
Colorado State University, Fort Collins, Colorado

1. INTRODUCTION

Global warming scenarios from CO2 increases are envisioned to bring about rainfall enhancement and resulting upper troposphere temperature and water vapor increases. The initial warming resulting from the blockage of infrared (IR or OLR) radiation due to CO2’s increases has been programmed in climate models to develop yet additional rainfall, temperature, and water vapor increases. This causes an additional blockage of IR energy to space which is substantially larger than the original CO2 blockage of IR by itself. This additional longwave IR blockage of energy to space (a positive feedback mechanism) is simulated in the models to be twice or more as strong as the original IR blockage from CO2 alone. We question the reality of this positive feedback mechanism. This study is directed towards determining the reality of such large positive feedback processes. This is a crucial question for determining the likely amount of global warming that will result from the anticipated doubling of CO2 by the end of the 21st century.

We have analyzed a wide variety of albedo and IR differences which are associated with rainfall variations on many different space and time scales. Our goal is to determine the extent to which we are able to accept or reject the reality of the Global Climate Model (GCM) simulations. The following analysis indicates that the GCM simulation of the influence of a doubling of CO2 give far too much global warming. We anticipate that a doubling of CO2 will act in a way to cause the global hydrologic cycle to increase in strength by approximately 3-4 percent. Our analysis indicates that there will be very little global temperature increase (~0.3oC) for a doubling of CO2, certainly not the 2-5oC projected by the GCMs.
...
The modelers have made the crucial, but faulty, assumption that as temperature rises from increased CO2 that it will do so in a way that keeps RH [relative humidity] constant. This requires that CO2 increases that produce temperature increases must also cause water vapor increases and further blockage of IR to space. This leads to yet higher temperature and higher water vapor contents and greater blockage of energy to space.

Our observations do not agree with these GCM scenarios. Our observations indicate that upper-level moisture actually goes down as precipitation rates increase. Upper tropospheric temperature in the tropics and around the globe increase very little for increased rates of precipitation of 2-4 percent. Precipitation rate increases of 2-4 percent are similar to those assumed by GCMs for a doubling of CO2.

THE NAS OR CHARNEY REPORT OF 1979 – BEGINNING SOURCE OF THE FAULTY AGW SCENARIOS

The basic error of the GCMs has been their general belief in the National Academy of Science (NAS) 1979 study – often referred to as The Charney Report - which hypothesized that a doubling of atmospheric CO2 would bring about a general warming of the globe’s mean temperature of between 1.5 – 4.5oC (or an average of ~ 3.0oC). These high warming values were based on the report’s assumption that the RH of the atmosphere would remain quasi-constant as the globe’s temperature increased. This assumption was made without any type of cumulus convective cloud model and was based solely on the Clausius-Clapeyron (CC) equation1 and the assumption that the RH of the air will remain constant during any future CO2-induced temperature changes. If RH remains constant as atmospheric temperature increases then water vapor content in the atmosphere must rise exponentially (Figures 10 and 11). The water vapor content of the atmosphere rises by about 50 percent if atmospheric temperature is increased by 5oC and RH remained constant. Upper tropospheric water vapor increases act to raise the atmosphere’s radiation emission level to a higher and colder level. This reduces (decreases σT4) the amount of outgoing IR energy which can escape to space.

Figure 10. The influential NAS report of 1979 which deduced that any warming of the globe from increased CO2 would occur with constant RH. This would assure an increase in atmospheric water vapor (q) with any temperature rise. This deduction was made without consideration for how the globe’s hydrologic cycle functions.

Some of the climate modelers, such as the early NASA-GISS (Hansen 1988) model, have even gone further than the CC equation would specify for water vapor increasing with temperature. Hansen’s early GISS model assumed that for increases of CO2, that upper tropospheric RH would not just stay constant but actually increase. The upper tropospheric water vapor (q) which Hansen’s assumed for a doubling of CO2 in his early model led him to increase water vapor (∆q) in the upper troposphere by nearly 50 percent. This caused his model to specify a tropical upper tropospheric atmospheric warming for a doubling of CO2 of as much as 7oC (Figure 12 and Figure 13). No wonder Hansen got such high global warming estimates for a doubling of CO2. It was these excessive warming values from grossly unrealistic model assumptions that he presented to a US Senate Committee during his famous hearing in June of 1988. It is a mystery that this gross technical flaw was not pointed out at that time.

Not only were Hansen’s extreme and unrealistically high values of upper tropospheric moisture and temperature increases (for a doubling of CO2) not challenged by his fellow modelers at the time, they were instead closely emulated by most of the other prominent GCMs of NOAA-GFDL (Figure 14), NCAR (Figure 15) and the UK Met Office (Figure 16). All of these early GCM simulations were designed to give unrealistically high amounts of upper tropospheric water vapor increases for doubling of CO2 and, as a result, additional extra large blockage of IR energy to space with resulting large and unrealistic upper level temperature increases.

Our analysis does not show significant increases of upper tropospheric temperature and moisture with enhancement of tropical or global rainfall amounts of 2-4 percent that are similar to what would be expect to occur with a doubling of CO2. This has also been discussed by Douglass et al. (2007) who show that tropical upper-tropospheric measurements and GCM results do not agree.
...
CONCLUSIONS

Observations of upper tropospheric water vapor over the last 3-4 decades from the NCEP/NCAR reanalysis data and ISCCP data show that upper tropospheric water vapor appears to undergo a small decrease while IR or outgoing longwave radiation (OLR) undergo a small increase. This is opposite to what has been expected from the GCMs. These models have erroneously exaggerated the magnitude of the water vapor feedback. They have also neglected the strong enhancement of albedo which occurs over the rain and cloud elements.

We should disregard what the GCMs have been saying about global warming from CO2 doubling.
  We should not set mandatory quotas on replacement of fossil fuel energy with renewable energy (wind, solar, etc.) at this time. The honest and objective science to support such serious energy utilization changes is just not there.

Tuesday, March 13, 2012

Water vapor, not CO2, controls climate and acts as a negative feedback

Physicist Daniel Sweger refutes the catastrophic AGW hypothesis in his paper The Climate Engine, showing that CO2 has a negligible effect upon climate and that water vapor acts as a negative feedback to global warming. Dr. Sweger uses data from 3 locales to show an inverse relationship between humidity and temperature. He notes, "In the positive feedback mechanism as proposed by the global warming proponents this behavior would be reversed. Then the data would show a positive relationship between moisture content and temperature. But it does not. As suggested before, data is the language of science, not mathematical models."
The data clearly shows that the relationship between the amount of water vapor in the air and temperature is negative 
From the conclusion of The Climate Engine:

The role of water vapor in determining  surface temperatures is ultimately a dominant one. During daylight hours it moderates the sun’s energy, at night it acts like a blanket to slow the loss of heat, and carries energy from the warm parts of the earth to the cold. Compared to that, if carbon dioxide has an effect, it must be negligible.

It is also clear from the data presented above that water vapor acts with a negative feedback. The data clearly shows that the relationship between the amount of water vapor in the air and temperature is negative; that is, the higher the amount of water vapor in the atmosphere the lower the surface temperature. In that regard, it almost acts as a thermostat.

As the air cools as a result of an increasing moisture content in the atmosphere, there is a decrease in the amount of water vapor produced by evaporation. Eventually this decrease of the level of water vapor being introduced into the atmosphere results in a decrease in moisture content. At this point more sunlight reaches the earth’s surface resulting in higher temperatures and increasing evaporation.

In the positive feedback mechanism as proposed by the global warming proponents this behavior would be reversed. Then  the data would show  a positive  relationship  between moisture  content and temperature. But it does not.


As suggested before, data is the language of science, not mathematical models.


About the Author
Dr. Daniel M. Sweger, AB (Physics, Duke University, 1965) and Ph.D. (Solid State Physics, American University, 1974) has been a research scientist at NIST, where he was active in a variety of research areas, including cryogenic thermometry, solid state and nuclear physics, and molecular spectroscopy. He also operated a computer software business and performed  consulting for the US Army. He is now semi- retired and is an adjunct instructor at National College of Business and Technology (www.ncbt.edu), where, among other subjects, he teaches Environmental Science.

Wednesday, March 6, 2013

Man-made global warming theory is falsified by satellite water vapor observations

Reblogged from Clive Best and Ken Gregory at Friends of Science.org:


Water Vapor Decline Cools the Earth: NASA Satellite Data

by Ken Gregory P.Eng., Friends of Science.org

An analysis of NASA satellite data shows that water vapor, the most important greenhouse gas, has declined in the upper atmosphere causing a cooling effect that is 16 times greater than the warming effect from man-made greenhouse gas emissions during the period 1990 to 2001.
The world has spent over $ 1 trillion on climate change mitigation based on climate models that don’t work. They are notoriously poor at simulating the 20th century warming because they do not include natural causes of climate change – mainly due to the changing sun -  and they grossly exaggerate the feedback effects of greenhouse gas emissions.
Most scientists agree that doubling the amount of carbon dioxide (CO2) in the atmosphere, which takes about 150 years, would theoretical warm the earth by one degree Celsius if there were no change in evaporation, the amount or distribution of water vapor and clouds. Climate models amplify the initial CO2 effect by a factor of three by assuming positive feedbacks from water vapor and clouds, for which there is little direct evidence. Most of the amplification by the climate models is due to an increase in upper atmosphere water vapor.
The Satellite Data
The NASA water vapor project (NVAP) uses multiple satellite sensors to create a standard climate dataset to measure long-term variability of global water vapor. NASA recently released the Heritage NVAP data which gives water vapor measurement from 1988 to 2001 on a 1 degree by 1 degree grid, in three vertical layers.1 The NVAP-M project, which is not yet available, extends the analysis to 2009 and gives five vertical layers. Water vapor content of an atmospheric layer is represented by the height in millimeters (mm) that would result from precipitating all the water vapor in a vertical column to liquid water. The near-surface layer is from the surface to where the atmospheric pressure is 700 millibar (mb), or about 3 km altitude. The middle layer is from 700 mb to 500 mb air pressure, or from 3 km to 6 km attitude. The upper layer is from 500 mb to 300 mb air pressure, or from 6 km to 10 km altitude.
The global annual average precipitable water vapor by atmospheric layer and by hemisphere from 1988 to 2001 is shown in Figure 1.
The graph is presented on a logarithmic scale so the vertical change of the curves approximately represents the forcing effect of the change. For a steady earth temperature, the amount of incoming solar energy absorbed by the climate system must be balanced by an equal amount of outgoing longwave radiation (OLR) at the top of the atmosphere. An increase of water vapor in the upper atmosphere would temporarily reduce the OLR, creating a forcing of more incoming than outgoing energy, which raises the temperature of the atmosphere until the balance is restored.
NVAP_pwv
Figure 1.  Precipitable water vapor by layer, global and by hemisphere.
The graph shows a significant percentage decline in upper and middle layer water vapor from 1995 to 2001. The near-surface layer shows a smaller percentage increase, but a larger absolute increase in water vapor than the other layers. The upper and middle layer water vapor decreases are greater in the Southern Hemisphere than in the Northern Hemisphere.
Table 1 below shows the precipitable water vapor for the three layers of the Heritage NVAP and the CO2 content for the years 1990 and 2001, and the change.
LayerL1 near-surfaceL2 middleL3 upperSumCO2
1013-700700-500500-300
mmmmmmmmppmv
199018.994.61.4925.08354.16
200120.724.030.9425.69371.07
change1.73-0.57-0.550.6116.91
Table 1.  Heritage NVAP 1990 and 2001 water vapour and CO2.
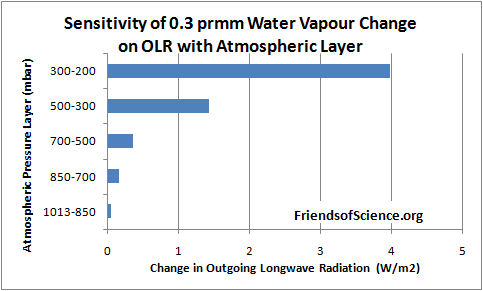
Dr. Ferenc Miskolczi performed computations using the HARTCODE line-by-line radiative code to determine the sensitivity of OLR to a 0.3 mm change in precipitable water vapor in each of 5 layers of the NVAP-M project. The program uses thousands of measured absorption lines and is capable of doing accurate radiative flux calculations.  Figure 2 shows the effect on OLR of a change of 0.3 mm in each layer.
The results show that a water vapor change in the 500-300 mb layer has 29 times the effect on OLR than the same change in the 1013-850 mb near-surface layer. A water vapor change in the 300-200 mb layer has 81 times the effect on OLR than the same change in the 1013-850 mb near-surface layer.
OLR_PWV_bar
Figure 2. Sensitivity of 0.3 mm precipitable water vapor change on outgoing longwave radiation by atmospheric layer.
Table 2 below shows the change in OLR per change in water vapor in each layer, and the change in OLR from 1990 to 2001 due to the change in precipitable water vapor (PWV).
L1L2L3SumCO2
OLR/PWVW/m2/mm-0.329-1.192-4.75
OLR/CO2W/m2/ppmv-0.0101
OLR changeW/m2-0.5690.6792.6132.723-0.171
Table 2.  Change of OLR by layer from water vapor and from CO2 from 1990 to 2001.
The calculations show that the cooling effect of the water vapor changes on OLR is 16 times greater than the warming effect of CO2 during this 11-year period. The cooling effect of the two upper layers is 5.8 times greater than the warming effect of the lowest layer.
These results highlight the fact that changes in the total water vapor column, from surface to the top of the atmosphere, is of little relevance to climate change because the sensitivity of OLR to water vapor changes in the upper atmosphere overwhelms changes in the lower atmosphere.
The precipitable water vapour by layer versus latitude by one degree bands for the year 1991 is shown in Figure 3. The North Pole is at the right side of the figure. The water vapor amount in the Arctic in the 500 to 300 mb layer goes to a minimum of 0.53 mm at 58.5 degrees North, then increases to 0.94 mm near the North Pole.
Nvap_lpw_1991
Figure 3. Precipitable water vapor by layer in 1991.
The NVAP-M project extends the analysis to 2009 and reprocesses the Heritage NVAP data. This layered data is not publicly available. The total precipitable water (TPW) data is shown in Figure 4, reproduced from the paper Vonder Haar et al (2012) here. There is no evidence of increasing water vapor to enhance the small warming effect from CO2.
fig4c_tpw
Figure 4. Global month total precipitable water vapor NVAP-M.
The Radiosonde Data
Water vapor humidity data is measured by radiosonde (on weather balloons) and by satellites.  The radiosonde humidity data is from the NOAA Earth System Research Laboratory here.
GlobalRelativeHumidity300_700mb
Figure 5. Global relative humidity, middle and upper atmosphere, from radiosonde data, NOAA Earth System Research Laboratory.
A graph of the global average annual relative humidity (RH) from 300 mb to 700 mb is shown in Figure 5. The specific humidity in g/kg of moist air at 400 mb (8 km) is shown in Figure 6. It shows that specific humidity has declined by 14% since 1948 using the best fit line.
SH400mb
Figure 6.  Specific humidity at 400 mb pressure level
In contrast, climate models all show RH staying constant, implying that specific humidity is forecast to increase with warming. So climate models show positive feedback and rising specific humidity with warming in the upper troposphere, but the data shows falling specific humidity and negative feedback.
Many climate scientists dismiss the radiosonde data because of changing instrumentation and the declining humidity conflicts with the climate model simulations. However, the radiosonde instruments were calibrated and the data corrected for changes in response times. The data before 1960 should be regarded as unreliable due to poor global coverage and inferior instruments. The near surface radiosonde measurements from 1960 to date show no change in relative humidity which is consistent with theory. Both the satellite and radiosonde data shows declining upper atmosphere humidity, so there is no reason to dismiss the radiosonde data. The radiosonde data only measures humidity over land stations, so it is interesting to compare to the satellite measurements which have global coverage.
Comparison Between Radiosonde and Satellite Data
The specific humidity radiosonde data was converted to precipitable water vapor for comparison with the satellite data. Figure 7 compares the satellite data to the radiosonde data for the years 1988 to 2001.
PW_NOAA&NVAP
Figure 7. Comparison between NOAA radiosonde and NVAP satellite derived precipitable water vapor.
The NOAA and NVAP data compares very well for the period 1988 to 1995. The NVAP satellite data shows less water vapor in the upper and middle layers than the NOAA data. In 2000 and 2001 the NVAP data shows more water vapor in the near-surface layer than the NOAA data. The vertical change on the logarithmic graph is roughly equal to the forcing effect of each layer, so the NVAP data shows water vapor has a greater cooling effect than the radiosonde data.
The Tropical Hot Spot
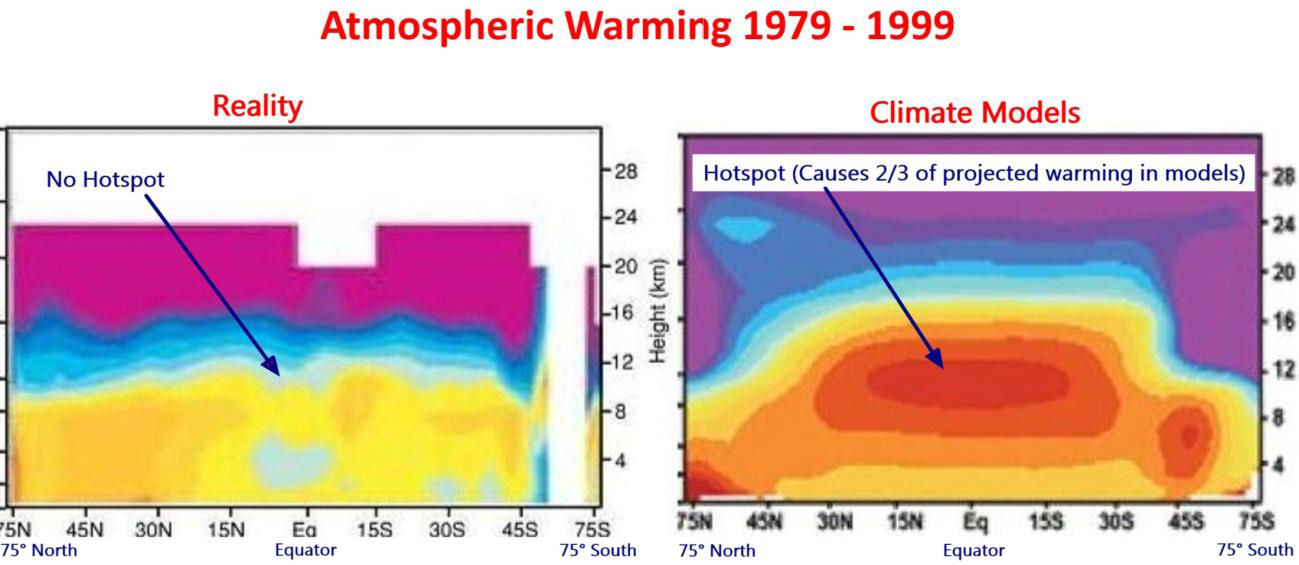
The models predict a distinctive pattern of warming – a “hot-spot” of enhanced warming in the upper atmosphere at 8 km to 13 km over the tropics, shown as the large red spot in Figure 8. The temperature at this “hot-spot” is projected to increase at a rate of two to three times faster than at the surface. However, the Hadley Centre’s real-world plot of radiosonde temperature observations from weather balloons shown below does not show the projected hot-spot at all. The predicted hot-spot is entirely absent from the observational record. If it was there it would have been easily detected.
The hot-spot is forecast in climate models due to the theory that the water vapor profile in the tropics is dominated by the moist adiabatic lapse rate, which requires that water vapor increases in the upper atmosphere with warming. The moist adiabatic lapse rate describes how the temperature of a parcel of water-saturated air changes as it move up in the atmosphere by convection such as within a thunder cloud. A graph here shows two lapse rate profiles with a larger temperature difference in the upper atmosphere than at the surface. The projected water vapor increase creates the hot-spot and is responsible for half to two-thirds of the surface warming in the IPCC climate models.
Hot_spot
Figure 8. Climate models predict a hot spot of enhanced warming rate in the tropics, 8 km to 13 km altitude. Radiosonde data shows the hot spot does not exist. Red indicates the fastest warming rate. Source: http://joannenova.com.au
The projected upper atmosphere water vapor trends and temperature amplification at the hot-spot are intricately linked in the IPCC climate theory. The declining upper atmosphere humidity is consistent with the lack of a tropical hot spot, and both observations prove that the IPCC climate theory is wrong.
A recent technical paper Po-Chedley and Fu (2012) here compares the temperature trends of the lower and upper troposphere in the tropics from satellite data to the climate model projections from the period 1981 to 2008.2 The upper troposphere is the part of the atmosphere where the pressure ranges from 500 mb to 100 mb, or from about 6 km to 15 km. The paper reports that the warming trend during 1981 to 2008 in the upper troposphere simulated by climate models is 1.19 times the simulated warming trend of the lower atmosphere in the tropics.  (Note this comparison is to the lower atmosphere, not the surface, and includes 10 years of no warming to 2008.) Using the most current version (5.5) of the satellite temperature data from the University of Alabama in Huntsville (UAH), the warming trend of the upper troposphere is only 0.973 of the lower troposphere in the tropics for the same period. This is different from that reported in the paper because the authors used an obsolete version (5.4) of the data. The satellite data shows not only a lack of a hot-spot, it shows a cold-spot just where a hot-spot was predicted.
Conclusion
Climate models predict upper atmosphere moistening which triples the greenhouse effect from man-made carbon dioxide emissions. The new satellite data from the NASA water vapor project shows declining upper atmosphere water vapor during the period 1998 to 2001. It is the best available data for water vapor because it has global coverage. Calculations by a line-by-line radiative code show that upper atmosphere water vapor changes at 500 mb to 300 mb have 29 times greater effect on OLR and temperatures than the same change near the surface. The cooling effect of the water vapor changes on OLR is 16 times greater than the warming effect of CO2 during the 1990 to 2001 period. Radiosonde data shows that upper atmosphere water vapor declines with warming. The IPCC dismisses the radiosonde data as the decline is inconsistent with theory. During the 1990 to 2001 period, upper atmosphere water vapor from satellite data declines more than that from radiosonde data, so there is no reason to dismiss the radiosonde data. Changes in water vapor are linked to temperature trends in the upper atmosphere. Both satellite data and radiosonde data confirm the absence of any tropical upper atmosphere temperature amplification, contrary to IPCC theory. Four independent data sets demonstrate that the IPCC theory is wrong. CO2 does not cause significant global warming.
Note 1. The NVAP data in Excel format is here.
Note 2.  The lower troposphere data is: http://www.nsstc.uah.edu/public/msu/t2lt/uahncdc.lt
The upper troposphere data is calculated as 1.1 x middle troposphere – 0.1 x lower stratosphere; where middle troposphere is: http://www.nsstc.uah.edu/public/msu/t2/uahncdc.mt and the lower stratosphere is:http://www.nsstc.uah.edu/public/msu/t4/uahncdc.ls