Showing posts sorted by relevance for query van andel. Sort by date Show all posts

Tuesday, October 28, 2014

Analysis shows the "missing heat" has gone to space & less "heat trapping" from increased greenhouse gases

A post today from Kiwi Thinker examines recent trends in the greenhouse effect from satellite data since 1979 and shows, opposite of warmist claims, that the greenhouse effect and "heat-trapping" of the atmosphere has steadily decreased along with the increase in greenhouse gas levels. The author concludes from this empirical NOAA data,

1. The "missing heat" has gone back to space as it always has...via outgoing longwave infrared radiation.

2. And more importantly, the greenhouse effect is not increasing as per IPCC dogma.

Thus, Trenberth's "missing heat," which only exists in falsified climate models, is not present in the atmosphere or oceans, and is now past Alpha Centauri located 4.3 light years away, i.e. it's not "in the pipeline" and is never coming back.

The analysis supports that of Dr. Noor van Andel, who unfortunately passed away three years ago, finding that IR radiation to space increased over the past 62 years, the exact opposite of the predictions of CAGW theory and computer models. 


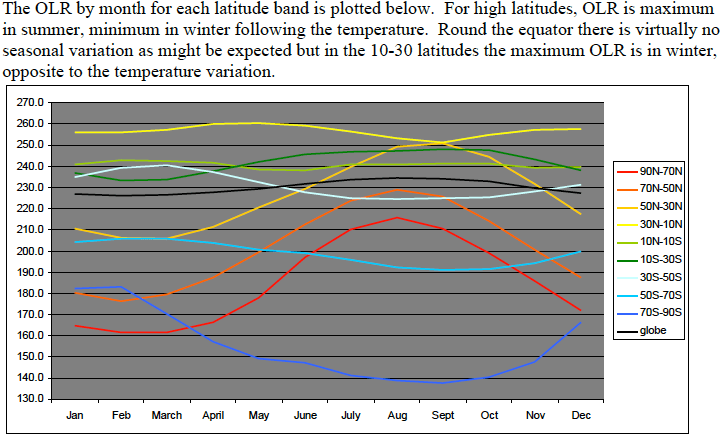
Slide from one of Dr. van Andel's lectures
In a post at Australian biologist Jennifer Marohasy's site, spectroscopist and engineer Michael Hammer also comes to the same conclusion finding the last 30 years of NOAA satellite data is incompatible with AGW theory. And the NOAA data plotted below by climate4you.com also demonstrates an increase in outgoing IR radiation over the satellite era. 

Diagram showing outgoing longwave radiation (OLR) at the top of the atmosphere between 180oW and 179oE (0oE and 359.5oE) and 90oN and 90oS since December 1978 ( red line; National Oceanographic and Atmospheric Administration (NOAA), and the global monthly average lower troposphere temperature (blue line; University of Alabama at Huntsville, USA). The thin lines represent the monthly values, while the thick lines are the simple running 37 month averages, nearly corresponding to running 3 yr averages. The infrared wavelength covered is 10.5-12.5 µm (Gruber and Winston 1978) and covers the main part of the atmospheric infrared window. Last month shown: October 2010 (OLR) and January 2011 (UAH). Last diagram update: 13 February 2011. Click here to download the entire series of NOAA monthly OLR-values since June 1974. Choose first 'OLR' then 'Select field'.

An Empirical Look at Recent Trends in the Greenhouse Effect

Just in case you were not aware, since about 1997 or so, there has been nearly no global temperature rise. This is despite atmospheric CO2 concentration continuing to rise. To date there are some 55 ideas to explain this slowdown in global warming. Some of the ‘explanations’ presume the so-called ‘greenhouse effect’ is operating as the IPCC models calculated; it’s just that the heat has hidden elsewhere, maybe deep in the ocean.
I wondered if there was empirical data available of the greenhouse effect? And could it show whether or not the greenhouse effect is increasing with increasing CO2, as the IPCC models expect?
First a very quick summary of the IPCC’s greenhouse theory goes something like this.  Increasing CO2 absorbs some of the upwards radiation from the surface, and then re-emits it back toward earth. This has the effect of increasing earth’s atmospheric temperature as outgoing longwave infrared radiation (OLWIR) is reduced by increasing quantities of CO2. Then, recognising that water vapour is the main greenhouse gas, the IPCC models propose that positive feedbacks dominate. This is where some warming leads to increased water vapour, and as water vapour is the main greenhouse gas this increases the greenhouse effect, this further lowers OLWIR, and increases the temperature.
So let’s see how the measurements fit the theory. I needed two data sets, one for OLWIR, and the other global temperature.
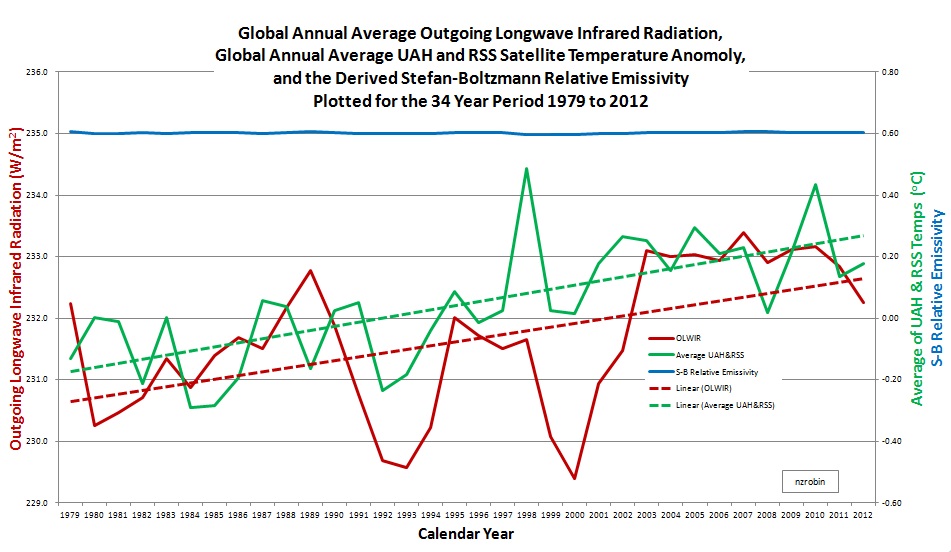
I emailed the National Oceanographic and Atmospheric Administration (NOAA) asking for website directions to their OLWIR data. Their response was quick and I downloaded monthly average OLWIR (W/m2) for each 2.5 degree latitude by 2.5 degree longitude area of the globe. After converting the netCDF files to Excel, I scaled each area’s OLWIR to account for the varying size of the area, resulting in a global average OLWIR. (I used Cosine(Latitude) to approximate the relative areas). (There was also some missing data mid 1994 to early 95. I populated this by a linear interpolation). The resulting annual average OLWIR is shown in the graph below for the years 1979 to 2012. A linear regression fit shows a generally increasing trend in OLWIR over this period.[i.e. less "heat trapping" from increased greenhouse gases]
The temperature data I chose is the average of both University of Alabama Huntsville (UAH) and Remote Sensing Systems (RSS). The result is also plotted on the graph below. A linear regression fit shows a generally increasing trend for years 1979 to 2013.
And now we’ll take a look at the Stefan-Boltzmann (SB) relative emissivity trend. Using an average global temperature of 14C, the SB relative emissivity has been derived using E/(K*T^4) for each year and plotted on the graph. If the greenhouse effect was increasing, the relative SB should be declining.  It’s not.  It’s flat lining.
The two primary results of this empirical study are:
The missing heat has gone back to space as it always has – as per SB law, via OLWIR.
And more importantly, the greenhouse effect is not increasing as per IPCC dogma.
There are probably about 55 reasons why … and there’s likely more to be said …
OLWIR, Temp and SB

h/t Has The Missing Heat Gone Back To Space? from NOT A LOT OF PEOPLE KNOW THAT by Paul Homewood
Related:
Feb 15, 2011
Dr. Noor van Andel has updated his paper CO2 and Climate Change and explains in greater detail how climate scientists have adjusted radiosonde (weather balloon) data to try to bring it into agreement with their computer ...
Jan 30, 2011
Dr. Noor van Andel, former head of research at Akzo Nobel, has a new paper out showing the available data to date contradicts the notion of greenhouse gas induced global warming or 'climate change.' He notes that while ...
Sep 14, 2010
Dr. Ir. Noor van Andel, former head of research at Akzo Nobel, recently presented a talk at the Dutch Meteorological Institute KNMI, concluding there is • No observational evidence for influence of CO2 on past or present ...

Sunday, January 30, 2011

Scientist: Climate changes are not caused by greenhouse gases

Dr. Noor van Andel, former head of research at Akzo Nobel, has a new paper out showing the available data to date contradicts the notion of greenhouse gas induced global warming or 'climate change.' He notes that while there have been extensive efforts to 'prove' the 'greenhouse' warming theory by bringing computer models and observations into agreement, this has been done "strangely only by adjusting the measurements instead of adjusting the models," in other words, via unscientific means. Dr. van Andel instead finds that ocean oscillations and the cosmic ray theory of Svensmark et al best explain climate changes.

CO2 and climate change
Noor van Andel, noor@xs4all.nl, 17-01-2011.

Abstract: It is shown that tropical Pacific sea surface temperature anomalies are closely congruent to global temperature anomalies, and that over more than a century. When we understand the cooling mechanism over the tropical Pacific, and especially its CO2 dependency, we can draw conclusions for the global CO2 climate sensitivity.

It is shown that the cooling of the tropics, or trade wind belt, is by deep convection, i.e. by a few thousand concentrated tropical thunderstorms that carry all the sensible and latent heat swept up by the trade winds all the way on to the tropopause. The physics of deep convection have been formulated since 1958 and are based on sound thermodynamics and measurements on location.

The trends of the temperature in the high atmosphere in the last half century are very negative, starting on this height where the convection reaches. That means that more CO2 has a cooling effect rather than a warming effect. Cloud tops radiate much more intense than the thin air on this height. This is the cause behind the cooling, as much as the CO2 increase.

The cooling trend is quite in discrepancy with the “greenhouse-gas-induced-global-warming” theory, but is quite in accord with increasing deep convection. The adjustment of these temperature measurements to bring them more in line with the climate models leads to unphysical conditions and processes. The response of the upper atmosphere temperature on volcanic eruptions also fits in the deep convection theory, but not in the mainstream theory.

Not CO2 increase, but two other parameters are the cause of climate change: ENSO or El Niño Southern Oscillation, a large change in the cold water upwelling along the coast of South America correlates well to short term climate change, and change in the intensity of hard, deeply penetrating Galactic Cosmic Radiation, well documented by 10Be deposits and 14C levels, correlates very well with long-term climate change including ice ages.

My conclusion is that climate changes are not caused by greenhouse gases.

selected excerpt from the paper:
The global warming started in 1976 with the “big climate shift”, the trend stopped in 1999 but the climate stayed warm until 2010. We see that in the warming period 1079-2009 not only the warming trend at the surface is higher, but the cooling trend in the high tropical troposphere is more clearly enhanced. We see even a cooling trend 1979-2009 replacing a warming trend 1958-2009 at the tropical 500-800 hPa height. We could even conclude that more CO2 cools the climate, because it cools the upper regions where the deep convection reaches, increasing the effective lapse rate over the whole height with 0.35 K/decade, over 2 decades and 12 km that means 0.07*2/12=0.012 K/km, not much, but we see in the table that a 0.1 K/km lapse rate increase at SST -302K increases the convection top 1.5 km. So this CO2 cooling trend over 2 decades brings the convection top 1.5 km/0.1*0.012=180 m higher, which is not negligible.

This behavior has been a problem for many, as it contradicts the global-warming-by-greenhouse- gases theory. So there has been a large activity to bring models and observations into agreement, strangely only by adjusting the measurements instead of adjusting the models.

and from the paper's conclusion:

Our present climate is due to an increased length of the last interglacial period, more than 10000 years, due to a low level of GCR [galactic cosmic rays] that maintains a low cloud cover, a low albedo, more absorbed sunshine and a pleasant climate. In the very long run, we need not mind about CO2 or global warming, but instead about higher GCR activity and global cooling. There is no way we can influence GCR activity, originating in active black holes and imploding supernovae.

h/t climategate.nl
see also Dr. van Andel's highly recommended presentation to the Dutch Meteorological Institute

Tuesday, February 15, 2011

Dr. Noor van Andel: The data does not agree with the theory of greenhouse gas induced global warming

Dr. Noor van Andel has updated his paper CO2 and Climate Change and explains in greater detail how climate scientists have adjusted radiosonde (weather balloon) data to try to bring it into agreement with their computer models and concept of greenhouse gas induced global warming. This is the opposite of the normal scientific procedure of adjusting the models to fit the data. The unadjusted data does not show the elusive "hot spot" predicted by climate models and conventional 'greenhouse' theory. Dr. van Andel's latest version also expands on the descriptions of Miskolczi's 'saturated greenhouse' theory and the cosmic ray theory of Svensmark et al.   
 
Excerpt:
"...This behavior has been a problem for many, as it falsifies a main point of the global-warming-by- greenhouse-gases- hypothesis. The warming by increased CO2 can only result from “increased back radiation” from the atmosphere to the surface, and for this the warming of the troposphere due to increased CO2 must be more than the surface warming. all models predict much more warming at 300 - 400 hPa compared to the surface warming trend. This is not observed.

There has been a large activity to bring models and observations in line, strangely only by adjusting the measurements instead of adjusting the models. The radiosonde measurements are adjusted so that they show the larger warming trend around 300 hPa that the models must assume to exist to get antropogenic CO2 induced warming, or to attribute the surface warming to increased CO2. Scores of publications and discussions try to prove this “atmospheric hot spot” must exist in the real world because the models say so. One example I show below:

From: Toward Elimination of the Warm Bias in Historic Radiosonde Temperature Records—Some New Results from a Comprehensive Intercomparison of Upper-Air Data, HAIMBERGER et al, JOURNAL OF CLIMATE, VOLUME 21, 4587) we take the following figure: Fig. 14 shows that the unadjusted 1979-2006 tropical temperature profile trends in the tropics, left graph, dotted line, shows a constant 0.1 K/decade warming with height until 200 Pa [11 km in the tropics], and above this height a substantial cooling trend, with a minimum of -1.2 K/decade [minus twelve times the surface warming trend!] at 70 Pa. Exactly like the fig.12 observations from Hadoffice show. This behavior is does not agree with the accepted theory of Greenhouse-gas induced global warming, that assumes a decrease of the convection activity with rising SST, because the temperature and moisture at 500-100 hPa in theory both rise, and this rising θe prevents convection. This is known as the “hot spot”. It is the main “positive feedback” assumed by the models to get the high climate sensitivity to be able to attribute the warming 1976-2010 to the CO2 increase. It is also called the “super Greenhouse Effect’. It exists only in climate models. This is the reason that so many corrections or adjustments have been proposed to the radiosonde measurements; the maximum adjustment [see left graph] reaching 0.9 K/10y, or 10ºC/decade from 1979 to 2009, that makes an adjustment of 2.7 ºC between the HadAT temperature measurement. and the unadjusted radiosonde measurement. Radiosonde sensors have a precision of 0.1 ºC! Physically it is impossible that convection decreases as the driving force for convection increases. Riehl & Malkus measured and quantified this deep convection in 1958 for the first time by flying into thunderstorms and derived the θe mathematics, which are soundly and simply founded in atmospheric thermodynamics. Thunderstorms are very local phenomena, they cannot and are not well parameterized in climate models. Clearly frequency and intensity of these storms is increasing fast with SST. Any CO2 in the atmosphere, if it would increase SST, is regulated back by this deep convective cooling mechanism.

The main error in the climate models is that they suppose heating and moistening, and thus higher θe [temperature], of the upper troposphere by CO2, in contradiction with radiosonde and satellite measurements. This assumed heating & moistening leads the model to assume an increase of θe [temperature] at this height, which makes deep convection decrease as a result of increasing SST, very unphysical as we have seen here above.

In the real world however, the upper troposphere will dry out as a result of stronger deep convection, because cloud top temperature goes down and condensation efficiency increases with deep convection intensity. In the region that the air spreads from the ITCZ and subsides, radiation into space is therefore enhanced. The lowest temperatures in the troposphere are to be found in the deep convection cumulonimbus tops, sometimes -80 ºC. All water is then in solid form, which coalesces easier and snows [rains] out more efficiently. This drying out has been documented well in the ERA and in the NCEP reanalysis historical time series. But it is hotly contested by IPCC- quoted authors, again because it is incompatible with climate models. "

prior posts on Dr. van Andel

Wednesday, April 20, 2011

Farewell to Dr. Noor van Andel

According to the climategate.nl blog, Dr. Noor van Andel, a Netherlands prominent skeptic of anthropogenic global warming, died yesterday. Dr. van Andel's papers showing climate changes are not caused by greenhouse gases are featured here and a farewell tribute is here.

Tuesday, August 17, 2010

Energy & Environment full special issue available

The British journal Energy & Environment is currently publishing a special issue focusing on paradigms in climate research. The German EIKE site is now hosting a pdf of the entire issue.


Some of these papers have already been the subject of posts here, such as those by Miskolczi, Clark, and Rorsch, and there are several additional papers of interest. The Guest Editorial by Rorsch introduces some of the papers in the special issue:
          The first paper by R. Clark presents the arguments that a further increase of CO2 in the atmosphere may not lead to an enhanced greenhouse effect. Especially the processes of radiation transfer in the atmosphere and the mass- and heat transfer at the surface are being reconsidered. The next paper by W. Eschenbach deals with thermostat hypothesis, that is the regulatory function of weather events.
          N. van Andel then further quantifies the effect of wind speed on mass transfer by water vapour and heat transfer by evaporation. In the fourth paper W. Kininmonth notes that current computer models of the climate system appear to underestimate the rate of increase of surface evaporation (and latent heat exchange) with temperature – leading to a gross exaggeration of the surface temperature response to radiative forcing. D. Thoenes then deals with the stabilising effect of the oceans on climate, a topic of major importance based on calculations supported by experience with salt evaporation pools on Bonaire. P. Siegmund comments briefly on the papers by Thoenes and in N. van Andel’s paper this issue is also considered.

          The paper by F. Miskolczi explores basic physics and could be subtitled “A new interpretation of weather balloon observations”. It leads the author to deduce new relationships between the energy fluxes in and out of the atmosphere, which has become known as the ‘Miskolczi theory’. W. Gilbert explores the relationship between surface temperature and water vapour concentration and augments the Miskolczi paper with respect to the thermodynamic forces driving the hydrological cycle. The title of the last paper by van Andel expands on the consequences of the Miskolczi Theory.

Wednesday, December 18, 2013

Analysis finds NOAA satellite data is incompatible with theory of man-made global warming

Previous posts by Dr. Noor van Andel have demonstrated that the theory of anthropogenic global warming [AGW] is falsified by observations over the past 62 years which show outgoing radiation from greenhouse gases has significantly increased, rather than decreased as predicted by the AGW theory. The observations instead show the 'greenhouse effect' has decreased over the past 62 years instead of increased due to an exponential rise in greenhouse gases. 

Slide from one of Dr. van Andel's lectures
In a new post at Australian biologist Jennifer Marohasy's site, spectroscopist and engineer Michael Hammer comes to the same conclusion finding the last 30 years of NOAA satellite data is incompatible with AGW theory:

AGW Falsified: NOAA Long Wave Radiation Data Incompatible with the Theory of Anthropogenic Global Warming


ANTHROPOGENIC Global Warming (AGW) theory claims the earth is warming because rising CO2 is like a blanket, reducing Earth’s energy loss to space. However, data from the US National Oceanic and Atmospheric Administration (NOAA) shows that at least for the last 30 years, Earth’s energy loss to space has been rising. The last 30 years of NOAA data is not compatible with the theory of AGW. It would appear that either 30 years of NOAA data is wrong or the theory of AGW is flawed. This is Michael Hammer’s conclusion following analysis of the official outgoing long wave radiation (OLR) data.
Michael Hammer Chart
The research uncovers some interesting trends and most importantly highlights that:
1. Earth can only warm if the rate of energy input exceeds the rate of energy loss;
2. Thus earth would warm if energy absorbed from the sun increased or energy loss to space (outgoing longwave radiation or OLR for short) decreased – or of course both;
3. The theory of AGW claims that Earth is warming because rising CO2 is reducing the energy loss to space i.e. is causing OLR to decrease;
4. Thirty years of experimental data published by NOAA (one of the prime AGW reference sites) shows OLR has been rising progressively between 1980 and 2010 and is now 2.5 watt/sqM higher than in 1980; and
5. The period between 1980 and 2010 is when almost all the CO2 induced warming is supposed to have taken place.
“If the corner stone of AGW theory says earth is warming because outgoing long wave radiation is decreasing yet 30 years of experimental data shows OLR is rising (remember 30 years is the time AGW proponents claim is the interval necessary to separate climate from weather) it would seem the theory of AGW is as a minimum extremely seriously compromised.”
****
Michael Hammer has a B Eng Sci and M Eng Sci from Melbourne university. His original training was as an electrical engineer but for the last 35 years he has been employed to carry out research across a wide range of technologies for a major multinational spectroscopy company. Over that time he has taken around 20 patents and his work has resulted in a significant number of commercially successful products.

Related:

Analysis finds both water vapor & increased CO2 act as negative feedbacks to cool the Earth surface

New data falsifies basis of man-made global warming alarm, shows water vapor feedback is negative

Tuesday, February 11, 2014

AGW believers refuse to admit the 'missing' heat was lost to space, claim it sank to bottom of ocean

The Mann-made global warming true believers continue their daily crusade to convince us that the 'missing' global warming has sunk to the bottom of the ocean, undetected by observations, instead of admitting the observations show the missing heat has been lost to space.


Reblogged from The Climate Skeptics Party, Australia:

You have to pinch yourself to see if you are awake when you read the lengths believers in man made global warming (AGW) go to avoid accepting evidence against their belief.

Matthew England is an academic and fervent believer in AGW. He has written a new paper which supposedly shows that increasing trade winds are responsible for the hiatus in temperature increase.

According to England increased Trade wind speeds are causing the “missing heat” to be carried down to the ocean bottom. Apparently when the Trade winds resume their normal speed the heat will spring out of the ocean and AGW will continue with a vengeance.

(see The warming is hiding in the bottom of the ocean. Someday it will pop out and say BOO!)

Seriously, that’s what his paper says.

The hiatus in temperature, that is temperature has stopped, is a complete contradiction to AGW. Lord Monckton shows this in his usual elegant fashion:

Even Skeptical Science has warmed to the idea:


So there it is, temperature as measured by the most reliable of the temperature indices from satellites shows temperature flat for over 17 years, which according to Ben Santer, a leading pro-AGW scientist, makes it climatically significant.

Santer says this:

Our results show that temperature records of at least 17 years in length are required for identifying human effects on global-mean tropospheric temperature
The converse of this of course is that 17 years is also sufficient to identify NO human effects on climate.

This 17 year threshold obviously explains why England 2 years ago denied there was a “pause” in the temperature trend.

But he’s now on board and he accepts that the temperature has stopped rising.

But like Trenberth before him he cannot face this fundamental contradiction of AGW. Trenberth in the infamous emails said:

"The fact is that we can't account for the lack of warming at the moment and it is a travesty that we can't."
And like England now Trenberth also headed for the winds to explain how the pesky heat sunk to the bottom of the ocean. For Trenberth the “missing heat” was moved to the ocean bottom by “surface wind variability”.

In one of the AGW debate’s greatest ripostes Roy Spencer provided a graph showing that wind variability had actually declined:


Trenberth’s mechanism for the transfer of heat to the bottom of the ocean was contradicted by the reality of the data and that is as good a symbol of the AGW debate as possible: theory and assumptions defeated by reality.

This graph also defeats England’s paper, but there are further dimensions to how wrong his paper is.

In 2006 another of the leading AGW scientists, Gabriel Vecchi wrote a paper which concluded the Trade winds were not strengthening but weakening. Vecchi said:
The vast loop of winds that drives climate and ocean behavior across the tropical Pacific has weakened by 3.5% since the mid-1800s, and it may weaken another 10% by 2100.
This is a profound contradiction to England’s conclusions. In fact Vecchi concluded every aspect of the climate system was weakening including the Walker Circulation the World’s greatest energy movement system. Astoundingly, the ABC, just as they reported England as gospel this time, also reported Vecchi in 2006!

But even Vecchi’s conclusions, contrary though they may be to England, are not certain with other research showing the Walker Circulation is not weakening.

To complete this totally confusing picture about winds leading Australian researcher, Michael Roderick, has published research showing global winds are declining in a process termed “Stilling”.

The final nail in the coffin to England’s confusing paper is strong evidence that the radiation that both England and Trenberth claim to be wind-driven to the ocean bottom doesn’t exist. NOAA records show Outgoing Long-wave Radiation is increasing:


Slide from one of Dr. van Andel's lectures [Figure added by the Hockey Schtick]

There it is. That heat which England and Trenberth and all the rest think is at the bottom of the ocean has left the planet. It’s a pity the climate scientists couldn’t leave too and leave the rest of us alone.

Also published today from Terra Daily:

Is global warming hiding underwater?

by Staff Writers Paris (ESA) Feb 11, 2014


Global monthly mean sea-surface temperature (SST) anomalies relative to a 1961-90 climatology from satellites (ATSRs: Along-Track Scanning Radiometers) and in-situ records (HadSST3). Black lines: the 100-member HadSST3 ensemble. Red lines: ATSR-based night-time subsurface temperature at 0.2 m depth (SST0.2m) estimates from the ATSR Reprocessing for Climate (ARC) project. Retrievals based on three spectral channels (D3, solid line) are more accurate than retrievals based on only two (D2, dotted line). Contributions of the three different ATSR missions to the curve shown are indicated at the bottom. The in-situ and satellite records were collocated within 5+ 5 degree monthly grid boxes: only those where both datasets had data for the same month were used in the comparison. (Adapted from Merchant et al. 2012.)

Satellite observations of global sea-surface temperature show that a 30-year upward trend has slowed down within the last 15 years. Climate scientists say this is not the end of global warming, but the result of a rearrangement in the energy flow of the climate system and, in particular, how the ocean stores heat.

Like flying thermometers, some satellites carry instruments that provide a global view of the surface temperature of oceans and seas. Measuring the sea-surface temperature is important for improving weather and ocean forecasting and climate change research.

Satellite and local readings show that sea-surface temperature has been rising rapidly since the 1970s, in line with the overall warming of our planet. But this increase has significantly slowed in the last 15 years.

In contrast, other variables such as increasing atmospheric carbon dioxide, rising sea levels and declining Arctic sea ice have not experienced the same reduction in trend and therefore demonstrate that Earth's climate continues to change.

Scientists have speculated that one of the causes of this 'plateau' in sea-surface temperature could be a change in the exchange of ocean water between warm, surface waters and cold, deep waters below 700 m - as if the warming is 'hiding' underwater. Temperature measurements at this depth cover a relatively short period.

But the warm water won't hide below the surface forever: scientists believe that it may re-emerge later or affect other climate indicators, such as sea level or ocean circulation.

ESA's Climate Change Initiative, or CCI, responds to the need for continuous data on the energy budget in our climate system to understand better the slowing increase in sea-surface temperature. Satellite readings enable the detection of real trends in climate.

"We can observe changes in sea-surface temperature from the 19th century onwards using millions of measurements gathered by voluntary observers at sea and by buoys that drift around the oceans," said Nick Rayner from the Met Office Hadley Centre in the UK.

"CCI is developing sea-surface temperature information from satellites that provides an independent assessment of these changes over the last few decades."

Science leader for this project, Chris Merchant, says, "When comparing changes in global average sea-surface temperature from these two sources, we see they provide a consistent picture since 1996, when the most reliable satellite measurements began.

"We are now working on applying our methods to earlier satellites, in order to extend reliable satellite-based information back into the 1980s."

Nick Rayner adds: "That will allow us to combine, with increased confidence, the sea-surface temperature information from satellites with measurements gathered in the ocean, to build a better, more complete picture of past changes."

These topics, among others, were discussed this week during the CCI's Collocation Meeting at ESA's Centre for Earth Observation in Frascati, Italy.

ESA began monitoring sea-surface temperature in 1991 with the first Along-Track Scanning Radiometer on the ERS-1 satellite, followed by instruments on ERS-2 and Envisat.

ESA will continue observations of sea-surface temperature with the upcoming Sentinel-3 mission, being developed for Europe's Copernicus programme.

Related:

Yes, the ocean has warmed; no, it’s not ‘global warming’ And warm water does not sink

Dr. Noor van Andel: The data does not agree with the theory of greenhouse gas induced global warming


Global Wind excuse — monkey-modeling shows global warming theory is Still Not Wrong

Monday, November 10, 2014

New paper "changes fundamental understanding of how greenhouse warming comes about"

Today's settled science update:

A new paper published in PNAS on the greenhouse effect allegedly "changes the fundamental understanding of how greenhouse warming comes about." Pardon? 

The paper attributes a role to increased CO2 only during the first couple decades to "start the process," after which "global energy accumulation is primarily caused by an increase in absorbed solar radiation rather than reduced outgoing longwave radiation" [from greenhouse gases]. 

However, observations show that outgoing longwave infrared radiation [OLR] has increased over the past 62 years, not decreased as predicted by AGW theory:


Source: Dr. van Andel: There is no observational evidence for influence of CO2 on present or past climate

However, the only way the Earth can warm is by decreasing outgoing longwave infrared radiation in relation to incoming energy from shortwave solar radiation, changing the radiative balance. In addition, any such radiative imbalance in the troposphere would be counteracted by the dominant negative-feedback cooling from convection. 

The thermodynamics of convection, evaporation, adiabatic lapse rate/pressure/atmospheric mass/gravity dominate the troposphere and “short-circuit” most of the radiative imbalance as shown in fig 4 of this paper describing radiative-convective equilibrium in planetary atmospheres:


Source: http://www.lpl.arizona.edu/~rlorenz/convection.pdf

also subsequently demonstrated by a paper in Nature by Robinson & Catling to apply to all planets with thick atmospheres in our solar system [one of several posts describing the Robinson & Catling paper]

Convection dominates over radiative forcing in the troposphere until the atmosphere becomes too thin to sustain convection at P=0.1 bar, i.e. where the tropopause begins and radiative forcing takes over. Above the troposphere, CO2 is well-known to be a cooling, not warming, agent.

The real 33C atmospheric greenhouse effect is instead entirely explainable on the basis of atmospheric mass/gravity/heat capacity/adiabatic lapse rate, and the "ocean greenhouse effect" explainable on the basis of the ~0.76 - 0.89 far-IR emissivity of the oceans, which "traps" heat from solar radiation in the oceans.


Related: Why global warming is also not explained by a change in "effective radiating level"


Study suggests shortwave absorption may rise

Reportingclimatescience.com

"New research suggests global warming is not just a blanket - in the long run, it's more like tanning oil. Climate models forced with CO2 reveal that global energy accumulation is primarily caused by an increase in absorbed solar radiation rather than reduced outgoing longwave radiation."


by Hannah Hickey, University of Washington
While computer models churn out bleak forecasts for the planet's future, we also have a more conceptual understanding of what is happening as humans pump carbon dioxide into the air. But the conceptual understanding of carbon dioxide wrapping the planet in a blanket that traps more heat is not quite right.
A new study from the University of Washington and the Massachusetts Institute of Technology hopes to complete the understanding of what happens to the planet under climate change. Instead of carbon dioxide, or CO2, creating a blanket to slowly warm the planet, a paper this week in the Proceedings of the National Academy of Sciences shows the story is a little more complicated - though the ending is, unfortunately, the same.
"This is a neat study in that it changes the way we think about the climate system," said lead author Aaron Donohoe, a postdoctoral researcher at MIT who is now beginning as a research associate at the UW's Applied Physics Laboratory. "We looked at processes that are well captured in the models, but the conceptual understanding of how they work hasn't been fleshed out before."

When CO2 is first added, it does act as a blanket, trapping long-wave infrared energy coming off the Earth. The atmosphere then emits less of this long-wave radiation to space because the upper atmosphere is cooler than the Earth's surface, just as the top of your blanket is cooler than your body. But the Earth gradually heats up under this blanket, and hotter objects emit more long-wave radiation, so within about a decade the effect of adding the thicker blanket has been canceled by the warmer body emitting more energy. [because radiation is proportional to the fourth power of temperature per Stefan-Boltzmann Law]
So what keeps the planet warming after the first decade? In the longer term, the study shows that the Earth begins to absorb more shortwave radiation - the high-energy rays coming directly from the sun.

Previously people had shied away from talking about shortwave [solar] radiation because clouds can reflect this visible light back to space, and clouds remain one of the big unknowns under climate change.
Regardless of what happens to clouds [baloney], these researchers say, the planet is likely to have less ice and the air will become more humid under climate change, both of which will act to absorb more shortwave radiation from the sun. Those effects will be like putting tanning oil on the planet, letting it absorb more of the sun's incoming rays.
Melting ice creates darker surfaces that can absorb more heat, and the more melting the more heat it can absorb. Likewise, warmer air holds more water vapor, causing it to absorb solar radiation that might otherwise bounce back off clouds, ice or snow.
"While greenhouse gases trap one type of radiation, it's the other type - visible, shortwave radiation - that is really sustaining global warming over the long term," said co-author Kyle Armour, a postdoctoral researcher at MIT who will join the UW faculty this fall with a joint appointment in oceanography and atmospheric sciences.
The result could help people better conceptualize global warming. It could also help better detect climate change in satellite data, which can measure both shortwave radiation reflected by the Earth and long-wave radiation emitted by the Earth.
Most of the study's simulations involved a one-time addition of carbon dioxide into the atmosphere. One scenario simulated continuously increasing CO2, as is happening now - in that case, the long-wave radiation effect lasted about 20 years before the shortwave effect took over.
"Our results do not change our overall expectation that the planet will continue to warm due to the burning of fossil fuels, but they do change our fundamental understanding of how that warming comes about," said co-author David Battisti, a UW professor of atmospheric sciences.
The study supports what scientists are seeing in models and observations, Battisti added.

PNAS describes the significance of this research as: The greenhouse effect is well-established. Increased concentrations of greenhouse gases, such as CO2, reduce the amount of outgoing longwave radiation (OLR) to space [observations show the opposite of increasing OLR over the past 62 years]; thus, energy accumulates in the climate system, and the planet warms. However, climate models forced with CO2 reveal that global energy accumulation is, instead, primarily caused by an increase in absorbed solar radiation (ASR). This study resolves this apparent paradox. The solution is in the climate feedbacks that increase ASR with warming—the moistening of the atmosphere and the reduction of snow and sea ice cover. Observations and model simulations suggest that even though global warming is set into motion by greenhouse gases that reduce OLR, it is ultimately sustained by the climate feedbacks that enhance ASR.

Abstract: In response to increasing concentrations of atmospheric CO2, high-end general circulation models (GCMs) simulate an accumulation of energy at the top of the atmosphere not through a reduction in outgoing longwave radiation (OLR)—as one might expect from greenhouse gas forcing—but through an enhancement of net absorbed solar radiation (ASR). A simple linear radiative feedback framework is used to explain this counterintuitive behavior. It is found that the timescale over which OLR returns to its initial value after a CO2 perturbation depends sensitively on the magnitude of shortwave (SW) feedbacks. If SW feedbacks are sufficiently positive, OLR recovers within merely several decades, and any subsequent global energy accumulation is because of enhanced ASR only. In the GCM mean, this OLR recovery timescale is only 20 y because of robust SW water vapor and surface albedo feedbacks. However, a large spread in the net SW feedback across models (because of clouds) produces a range of OLR responses; in those few models with a weak SW feedback, OLR takes centuries to recover, and energy accumulation is dominated by reduced OLR. Observational constraints of radiative feedbacks—from satellite radiation and surface temperature data—suggest an OLR recovery timescale of decades or less, consistent with the majority of GCMs. Altogether, these results suggest that, although greenhouse gas forcing predominantly acts to reduce OLR, the resulting global warming is likely caused by enhanced ASR.

Shortwave and longwave radiative contributions to global warming under increasing CO2 by Aaron Donohoe, Kyle C. Armour, Angeline G. Pendergrass, and David S. Battisti published in the Proceedings of the National Academy of Sciences, doi: 10.1073/pnas.1412190111

Read the abstract and get the paper here.
University of Washington news release here

Wednesday, May 28, 2014

New paper finds climate models violate the 'basic physics' of the 2nd law of thermodynamics

A paper published today in the Quarterly Journal of the Royal Meteorological Society finds climate models violate the 'basic physics' of the Second Law of Thermodynamics with respect to simulating conventional turbulent heat flow, one of the most important mechanisms of heat transfer in the atmosphere. 

According to the authors, 
"Numerical models of the atmosphere should fulfill fundamental physical laws. The Second Law of thermodynamics is associated with positive local entropy production and dissipation of available energy."
i.e. entropy always increases and energy always dissipates per the second law of thermodynamics.
"Inspecting commonly used parameterizations for subgrid-fluxes, we find that some of them obey the Second Law of thermodynamics, and some do not... Conventional turbulent heat flux parameterizations do not conform with the Second Law. A new water vapor flux formulation is derived from the requirement of locally positive entropy production. The conventional and the new water vapor fluxes are compared using high-resolution radiosonde data. Conventional water vapor fluxes are wrong by up to 10% and exhibit a negative bias." 
"...Both test cases indicate that negative thermal dissipation can occur for the conventional heat flux. Obviously, the additional energy made available by this negative dissipation to the resolved turbulence is later on dissipated by friction, so that the total dissipation is again comparable [for the wrong physical reasons], at least for the boundary layer experiment."
In other words, the computer models falsely claim that entropy can decrease, heat can "negatively dissipate" [i.e. concentrate itself], and that "additional energy [a violation of the 1st law of thermodynamics] is made available by this "negative dissipation" [a violation of the 2nd law of thermodynamics]." Thus, the climate models violate the basic physics of both the 1st and 2nd laws of thermodynamics.

The finding is quite ironic given the climate alarmist meme that computer-modeled global warming is just "elementary basic physics" and "settled science" upon which all scientists agree. However, it is doubtful that many scientists know that the black-box climate models aren't even programmed to obey the most fundamental laws of thermodynamics.


UPDATE: Dr. Roy Spencer explains why IPCC climate models violate the basic physics of conservation of energy (1st Law of Thermodynamics).


How is local material entropy production represented in a numerical model?

Almut Gassmann and Hans-Joachim Herzog

Numerical models of the atmosphere should fulfill fundamental physical laws. The Second Law of thermodynamics is associated with positive local entropy production and dissipation of available energy. In order to guarantee this positivity in numerical simulations, subgrid-scale turbulent fluxes of heat, water vapor, and momentum are required to depend on numerically resolved gradients in a unique way. The task of parameterization remains to deliver phenomenological coefficients.

Inspecting commonly used parameterizations for subgrid-fluxes, we find that some of them obey the Second Law of thermodynamics, and some do not. The conforming approaches are the Smagorinsky momentum diffusion, phase changes, and sedimentation fluxes for hydrometeors. Conventional turbulent heat flux parameterizations do not conform with the Second Law. A new water vapor flux formulation is derived from the requirement of locally positive entropy production. The conventional and the new water vapor fluxes are compared using high-resolution radiosonde data. Conventional water vapor fluxes are wrong by up to 10% and exhibit a negative bias.

Two numerical tests (the Boulder windstorm testc ase and a convective boundary layer experiment) are performed with the ICON-IAP model. The experiments compare conventional and entropy-consistent heat flux parameterizations. Both test cases indicate that negative thermal dissipation can occur for the conventional heat flux. Obviously, the additional energy made available by this negative dissipation to the resolved turbulence is later on dissipated by friction, so that the total dissipation is again comparable [for the wrong reasons], at least for the boundary layer experiment.

Related: 

Sunday, October 27, 2013

Huffington Post shows how anthropogenic global warming circumvents the 1st Law of Thermodynamics

A 'physicist'/blogger on the Huffington Post admits that while "The laws of physics dictate that energy is conserved," somehow the Earth/atmosphere system is exempted in the case of global warming, since "more energy is coming in than going out." His claim is directly opposed by satellite measurements, the NASA Earth Observatory site, and many, many other references clearly demonstrating that in accordance with the 1st Law of Thermodynamics, the "flow of energy into the atmosphere must be balanced by an equal flow of energy out of the atmosphere and back to space."

In addition, outgoing infrared radiation to space from greenhouse gases has increased over the past 62 years, instead of decreased as predicted by AGW theory, proving that there is no observational evidence for influence of CO2 on present or past climate.

Source: Dr. Noor van AndelThere is no observational evidence for influence of CO2 on present or past climate

From the NASA Earth Observatory:
The Atmosphere’s Energy Budget 
Just as the incoming and outgoing energy at the Earth’s surface must balance, the flow of energy into the atmosphere must be balanced by an equal flow of energy out of the atmosphere and back to space.

The Earth's Energy Budget II -- Radiation Emitted by the Earth, the Greenhouse Effect, and the Overall Energy Balance

For the entire planet, the radiation energy in equals the radiation energy out

The Amount of Energy the Earth Radiates to Space Equals the Amount Received Received from the Sun, So Energy going Out Equals Energy Coming In

and about 525,000 other references.


Global Warming, Asteroid Impacts, and the Laws of Physics

  Mark Boslough  Physicist; Fellow of the Committee for Skeptical Inquiry, Huffington Post

When I was a first-year graduate student at Caltech, my Ph.D. adviser published a paper called "Impact-induced energy partitioning." He asked how an asteroid's energy would change form if it collided with the Earth. He used computer models to estimate what fraction would go into lofting debris, heating, melting, vaporizing rocks, and so on.

This subject was not settled science then, and is still not. One thing is for sure, however. The laws of physics dictate that energy is conserved. If an asteroid is hurtling toward your city, you might not be concerned that scientists are not 100 percent certain about how its energy will be "partitioned."

Global warming is no different.

Another one of my professors was Richard Feynman. In his famous "Feynman Lectures" he had a chapter called "Conservation of Energy" in which he says:

"There is a fact, or if you wish, a law, governing all natural phenomena that are known to date. There is no exception to this law - it is exact so far as we know. The law is called conservation of energy."

He imagined a child with toy blocks that are indestructible and can't be divided. His mother counts the blocks every day and discovers a phenomenal law - no matter what he does with the blocks, there is always the same number at the end of the day.

One day there is a missing block, but she investigates and finds one under the rug. Another day the number comes up two short, but she discovers an open window and two blocks are outside.

Then a surplus occurs, but it turns out a friend came over and left some blocks.

After that, mom locks the window and bans visits, but eventually the count comes up short again. There's a toy box in the room but it's locked and only her son has the key. So she weighs it. The changes in weight correlate exactly to the missing blocks from day to day.

Then the weight stops changing, but the water level in the dirty bathtub starts going up and down in a way that is exactly proportional to the difference in missing blocks.

Feynman even provides the equations that mom uses, and he beats the analogy into our heads. The blocks are like energy, which is neither created nor destroyed.

His punchline is this: Energy has different forms, and there is a formula for each one. "If we total up the formulas for each of these contributions, it will not change except for energy going in and out."

Human-caused global warming is the inevitable consequence of this law of physics, because greenhouse gas pollution is causing more energy to come in than go out.

If the average surface temperature - which is only one way to measure global warming - doesn't go up every year, it's because the "blocks" are being hidden somewhere else, for now.

But energy changes forms, and sloshes back and forth between sub-systems. Ice will continue to melt and sea level will continue to rise as the water warms. A slowdown in one rate is compensated by a speedup in another until the cycle of natural variability reverses.

Scientists know that more energy is coming in than going out. We can measure it and there is no dispute. [we have measured it and energy in = energy out]

Because of carbon pollution, the Earth is gaining energy at the rate of 400,000 Hiroshima atomic bombs every day of every year. And that rate is going up. [nope]

Not knowing exactly how energy is "partitioned" into its various forms at any given time is like not knowing how much melting an asteroid will cause, how small the pieces will be when a boiler explodes, how the victims of a drunk driver will die, or how many minutes it will take for the Titanic to sink.

Uncertainty in exactly how something happens does not translate into uncertainty that it is happening. There is no rational basis for denial of the reality, or the risks, of global warming.

And there is no excuse for ignoring it.

This essay is reprinted from the Albuquerque Journal.