Showing posts sorted by relevance for query homogenization. Sort by date Show all posts

Monday, July 16, 2012

New paper finds global warming over past century was only about half of IPCC claims

A recent paper presented at the European Geosciences Union meeting finds global warming over the past century was only about one-half [0.42°C] of that claimed by the IPCC [0.7-0.8°C]. The paper finds that in 2/3 (67%) of the weather stations examined, questionable adjustments were made to raw data that resulted in "increased positive trends, decreased negative trends, or changed negative trends to positive," whereas "the expected proportions would be 1/2 (50%)." According to the authors,
"homogenation practices [adjustments to raw data] used until today are mainly statistical, not well justified by experiments, and are rarely supported by metadata. It can be argued that they often lead to false results: natural features of hydroclimatic times series are regarded as errors and are adjusted." 

"While homogenation is expected to increase or decrease the existing multiyear trends in equal proportions, the fact is that in 2/3 of the cases the trends increased after homogenation" 

"The above results cast some doubts in the use of homogenation procedures and tend to indicate that the global temperature increase during the last century is smaller than 0.7-0.8°C"
selected slides below, full presentation available here 


Investigation of methods for hydroclimatic data homogenization


Steirou, E., and D. Koutsoyiannis, Investigation of methods for hydroclimatic data homogenizationEuropean Geosciences Union General Assembly 2012, Geophysical Research Abstracts, Vol. 14, Vienna, 956-1, European Geosciences Union, 2012.

We investigate the methods used for the adjustment of inhomogeneities of temperature time series covering the last 100 years. Based on a systematic study of scientific literature, we classify and evaluate the observed inhomogeneities in historical and modern time series, as well as their adjustment methods. It turns out that these methods are mainly statistical, not well justified by experiments and are rarely supported by metadata. In many of the cases studied the proposed corrections are not even statistically significant.
From the global database GHCN-Monthly Version 2, we examine all stations containing both raw and adjusted data that satisfy certain criteria of continuity and distribution over the globe. In the United States of America, because of the large number of available stations, stations were chosen after a suitable sampling. In total we analyzed 181 stations globally. For these stations we calculated the differences between the adjusted and non-adjusted linear 100-year trends. It was found that in the two thirds of the cases, the homogenization procedure increased the positive or decreased the negative temperature trends.
One of the most common homogenization methods, ‘SNHT for single shifts’, was applied to synthetic time series with selected statistical characteristics, occasionally with offsets. The method was satisfactory when applied to independent data normally distributed, but not in data with long-term persistence.
The above results cast some doubts in the use of homogenization procedures and tend to indicate that the global temperature increase during the last century is between 0.4°C and 0.7°C, where these two values are the estimates derived from raw and adjusted data, respectively.
PDF Full text:

See comment below from wattsupwiththat regardimg source

Monday, January 27, 2014

New paper finds adjusted temperature data in China has significantly exaggerated warming

A paper published today in Theoretical and Applied Climatology finds that the data homogenization techniques commonly used to adjust temperature records for moving stations and the urban heat island effect [UHI] can result in a "significant" exaggeration of warming trends in the homogenized record. 

According to the authors, "Our analysis shows that "data homogenization for [temperature] stations moved from downtowns to suburbs can lead to a significant overestimate of rising trends of surface air temperature."

The paper corroborates the prior work of Anthony Watts, Joseph D'Aleo, et al, finding leading meteorological institutions in the USA and around the world have so systematically tampered with instrumental temperature data that it cannot be safely said that there has been any significant net “global warming” in the 20th century.

Theoretical and Applied Climatology February 2014, Volume 115, Issue 3-4, pp 365-373,
Open Access


Effect of data homogenization on estimate of temperature trend: a case of Huairou station in Beijing Municipality

Lei Zhang,
Guo-Yu Ren,
Yu-Yu Ren,
Ai-Ying Zhang,
Zi-Ying Chu,
Ya-Qing Zhou

Download PDF (531 KB)


Abstract

Daily minimum temperature (Tmin) and maximum temperature (Tmax) data of Huairou station in Beijing from 1960 to 2008 are examined and adjusted for inhomogeneities by applying the data of two nearby reference stations. Urban effects on the linear trends of the original and adjusted temperature series are estimated and compared. Results show that relocations of station cause obvious discontinuities in the data series, and one of the discontinuities for Tmin are highly significant when the station was moved from downtown to suburb in 1996. The daily Tmin and Tmax data are adjusted for the inhomogeneities. The mean annual Tmin and Tmax at Huairou station drop by 1.377°C and 0.271°C respectively after homogenization. The adjustments for Tmin are larger than those for Tmax, especially in winter, and the seasonal differences of the adjustments are generally more obvious for Tmin than for Tmax. Urban effects on annual mean Tmin and Tmax trends are −0.004°C/10 year and −0.035°C/10 year respectively for the original data, but they increase to 0.388°C/10 year and 0.096°C/10 year respectively for the adjusted data. The increase is more significant for the annual mean Tmin series. Urban contributions to the overall trends of annual mean Tmin and Tmax reach 100% and 28.8% respectively for the adjusted data. Our analysis shows that data homogenization for the stations moved from downtowns to suburbs can lead to a significant overestimate of rising trends of surface air temperature, and this necessitates a careful evaluation and adjustment for urban biases before the data are applied in analyses of local and regional climate change

Related:

New paper asks: 'Would the 'real' temperature dataset please stand up?'; finds 'We have no ability to know' the true temperature data

It's Official: 2013 was the 4th7th10th107th... warmest year since the Little Ice Age

Would You Like Your Temperature Data Homogenized, or Pasteurized?


[Illustrations, footnotes and references available in PDF version]
Updated August 27, 2010 This paper is, as intended, a work in progress as a compilation of what’s current and important relative to the data sets used for formulating and implementing unprecedented policy decisions seeking a radical transformation of our society and institutions.
Authors veteran meteorologists Joe D’Aleo and Anthony Watts analyzed temperature records from all around the world for a major SPPI paper, Surface Temperature Records – Policy-driven Deception? The startling conclusion that we cannot tell whether there was any significant “global warming” at all in the 20th century is based on numerous astonishing examples of manipulation and exaggeration of the true level and rate of “global warming”.
That is to say, leading meteorological institutions in the USA and around the world have so systematically tampered with instrumental temperature data that it cannot be safely said that there has been any significant net “global warming” in the 20th century.

Wednesday, November 10, 2010

New Retreat from Global Warming Data by Australian Gov Bureau

Article by John O’Sullivan and Val Majkus (via email from John O'Sullivan)

Global warmers in full retreat as Aussie experts admit growing doubts about their own methods as new study shows one third of temperatures not reliable.

The Australian Bureau of Meteorology (BOM) admits it was wrong about urban heating effects as a professional statistical analysis by Andrew Barnham exposes a BOM claim that “since 1960 the mean temperature in Australia has increased by about 0.7 °C”; the BOM assertion has no empirical scientific basis.

Barnham, who spent 8 years working in emerging South Asian economies building high volume transaction processing systems, applied a high-tech statistical technique very different from an earlier well-publicized probe by fellow Aussie, Ken Stewart on his blog, Ken’s Kingdom.

Stewart grabbed headlines in what became known as the Australiagate controversy after his findings were featured on popular science blog, Watts Up With That. Stewart exposed dubious BOM adjustments to temperature data that bore little or no resemblance to actual or raw past temperatures.

Like Stewart, Barnham paid particular attention to BOM’s methodology in addressing what is known as the Urban Heat Island Effect (UHI), a proven phenomenon whereby thermometers measuring temperatures in towns and cities become unduly influenced by extra ‘background’ heating from buildings, road surfaces, machinery, etc. It’s in the UHI adjustments that the greatest discrepancies appear to lie.

Tuesday, December 11, 2012

Massive data manipulation at NASA GISS warms most weather stations

In a talk given at the recent EIKE Climate Conference in Germany, Professor Friedrich-Karl Ewert compared the 2010 and 2012 data from 119 randomly selected stations from the NASA GISS temperature records. Prof. Ewert found "All appeared to have been tampered with. His conclusions: changes were made in most stations, probably in all. Two thirds of the changes resulted in stronger warming. A third of the stations showed enhanced cooling to simulate a homogenization." According to Dr. Ewert, the data manipulation methods include: decreasing data of  beginning sections, decreasing data between 1920 and 1950, increasing data of final sections, and deleting data of disturbing sections.

Examples of data manipulation between 2010 and 2012 at NASA GISS


Stations in orange [64.71%] were warmed between 2010 and 2012, those in blue were cooled to "simulate a homogenization"
 

Wednesday, September 17, 2014

Debunking the essentially truthy climate claims of 'And then there's physics'

Our warmist friend "Anders," proprietor of the "And then there's 'physics'" blog [formerly "Wotts up with that" blog] is taking a semi-permanent hiatus* allegedly because "he is depressed by the futility of it all, trying to have a discussion with people, who are blathering from bad faith or ignorance."

*interesting choice of words since he doesn't believe there is a global warming 'hiatus' and over 50 publications acknowledge the 18-26 year 'hiatus' in global warming

In his excuses for his personal 'real hiatus' post, he proclaims, 

"So, I think there are certain things that we can regard – given the evidence we have today – as essentially true."
and then proceeds to list the certain things he thinks are essentially true. I've quoted each of these followed by just a few of the Hockey Schtick posts which debunk each one of Anders' essentially truthy claims:
  • "The rise in atmospheric CO2 since the mid-1800s is virtually all a consequence of anthropogenic emissions. If you want to know why, you can read this."
Temperature leads CO2 on all timescales: short, intermediate, and long. The cause does not follow the effect [mathematical proof]Mathematical & observational proof that CO2 has no significant effect on climate.


Single graph demonstrates man-made CO2 is not the driver of global warming

Climate textbook explains why man-made CO2 does not control atmospheric CO2


  • There have been numerous millenial [sic] temperature reconstructions using a variety of different proxies and a variety of different techniques. They almost all produce a hockey stick-like shape and indicate that temperatures today are probably higher than they’ve been for more than a thousand years and the rate at which it has risen is faster than for more than a thousand years. You can read more here."
Not true on 3 levels:

1) All of the dozen or so millennial temperature reconstructions that allegedly find a "hockey stick" shape have been debunked by Steve McIntyre et al, including PAGES, Kaufmann, Gergis, BriffaSteig, Marcott, et al, in many cases for using the same upside-down data and biased screening as Michael Mann did with his original hockey stick, in addition to other statistical trickery.

2) "They almost all produce a hockey stick shape" is blatantly false. There are well over 1000 published non-hockey sticks in the peer-reviewed literature worldwide vs. only a couple dozen [debunked] hockey sticks.

3) "They almost all"..."indicate that temperatures today are probably higher than they’ve been for more than a thousand years and the rate at which it has risen is faster than for more than a thousand years" is false since the Medieval Warm Period project tallies temperature reconstructions over the past millennium from over 1000 scientists and finds less than 10% indicate the current warm period as warmer than the Medieval Warm Period 1000 years ago. 


4) The rate of warming is not at all unusual or unprecedented during the 20th century, during the Holocene, and during prior, warmer interglacials.
  • The instrumental temperature record has been replicated/reproduced by numerous different groups. All the different records show that we’ve warmed by more than 0.8 degrees since 1880. Homogenization is a crucial part of generating these temperature records and is not an indicator of data tampering, or because scientists want to show that it’s warming faster than it actually is (e.g., here).
According to the HADCRUT3 dataset [from which the GISS and BEST data originates], the globe has warmed/recovered only 0.7C since the end of the Little Ice Age in 1850, not "more than 0.8 degrees." Homogenization is important, but unfortunately has been misapplied/misused to often result in an artificial warming trend not found in the raw data. 

Further, just because the globe recovered 0.7C since the Little Ice Age does not imply all or most of this recovery is due to man, the false attribution fallacy. 
  • Our understanding of climate change is not primarily based on global climate models (GCMs). They provide some evidence for how our climate may change if we continue to increase anthropogenic forcings. Also, claiming that climate models have failed because they didn’t specifically predict the so-called “pause” is like suggesting that you can’t be sure the river will flow downhill because you can’t predict the winner at pooh sticks(H/T Richard Betts).
Not true because:

1) Computer model output is not "evidence" of anything. Observations are evidence, never models. It's the scientific method, look it up. 
 
2) Climate models are not based upon physics, they consist almost entirely of parameterizations/fudge factors, which is one of many reasons why they do not properly simulate the most fundamental aspects of climate including convection, clouds, gravity waves, atmospheric circulation, ocean oscillations, indirect solar amplification mechanisms, etc. This is why recent papers have called for scrapping the current crop of failed numerical models and replacing them with a whole new approach of stochastic modeling. 


3) "claiming that climate models have failed because they didn’t specifically predict the so-called “pause” is like suggesting that you can’t be sure the river will flow downhill because you can’t predict the winner at pooh sticks" is a non-sequitur and ridiculous claim. Comparing water flowing downhill from gravity is in no way the same as pointing out the climate models have been falsified as overheated at 98%+ confidence levels. If a model said that water flows uphill, then that model would be falsified as well based upon observations.
  • We may not know, precisely, the equilibrium climate sensitivity and the transient climate response, but we do have evidence that provides a range for each of these quantities. Claiming that it will probably be on the low side of these ranges, is simply wrong. The probability distribution tells us the likelihood of each portion of these ranges, and deciding that a particular interval is more likely than this probability distribution suggests, is simply ignoring some (or most) of the evidence.
Not true and "we may not know, precisely" is the understatement of the year. The range of climate sensitivities suggested by various scientists is huge, ranging from < 0.5C to well over 6C. The climate sensitivities based upon observations [i.e. the scientific method], not falsified climate models, show very low climate sensitivities and show that IPCC model-based estimates are exaggerated by ~7 times. Further, several papers have demonstrated that climate models cannot be relied upon to determine climate sensitivity to CO2, despite what Anders truly believes.
There are probably more, but the point I’m getting at is that it really isn’t possible to have a good faith discussion with anyone who dispute the points above. 
Anders thinks all of the above rebuttals are "not in good faith," just like when @hockeyschtick1 pointed out to him on twitter that his claim of sea level rise in the past was off by a factor of only 60 times and he claimed correcting his error was in "bad faith."

Happy "hiatus" Anders

Thursday, April 24, 2014

Paper finds more smoking guns of temperature data tampering in Northern Australia

A recent paper published in Theoretical and Applied Climatology finds evidence of incorrect temperature data homogenization over the 20th century in the Northern Territory of Australia, falsely creating a warming trend from the cooling trend present in the raw data. According to the author, "With the data available [in Northern Australia], the only option to produce warming trends is to overweight the cold years in the middle of the 1970s and the subsequent return to warmer temperatures," but that with proper data homogenization, there is no warming trend. 

According to the paper, "The Northern Territory of Australia has a unique situation of an extension larger than France and a population of 200,000, with only three meteorology stations open for more than 40 years, Darwin (DW), Alice Springs (AS) and Tennant Creek, and only two of them, [Darwin] DW and AS, providing data over 100 years, and from 500 to more than 1,000 km separating these stations and the stations in the neighbouring states of Australia.

This "smoking gun" of temperature data tampering in Darwin, Australia was pointed out over 4 years ago by Willis Eschenbach at WUWT, illustrated by Fig. 7 below showing a cooling trend of 0.7C per century in the raw data was up-justed to show a warming trend of 1.2C per century in the official data:


Figure 7. GHCN homogeneity adjustments to Darwin Airport combined record. Source

As the author of the paper points out in the introduction below, "The science of climate change is characterized by selective filtering and sometimes manipulating the experimental evidence to compute rate of rise of temperatures or accelerations of sea levels much larger than what they actually are. While no particular local station records can necessarily be expected to conform to the global average pattern, the global average pattern is or should be built on the basis of the local results. If the IPCC global average temperature compilation incorporates some information from some of the local Australian records and this information is faulty in this regard, and the global average is suspect to the degree that it has been influenced by the use of the Australian records. While this paper is focused on the Northern Territory of Australia, similar arguments may certainly apply for other geographical areas worldwide further supporting the claim that the rate of rise of temperature and the acceleration of sea levels are presently overestimated."

Indeed, ample evidence exists that the global, US, Australian, New Zealand, Arctic and numerous other international temperature records have been tampered or "up-justed" to produce an artificial warming trend long after such records were collected. 

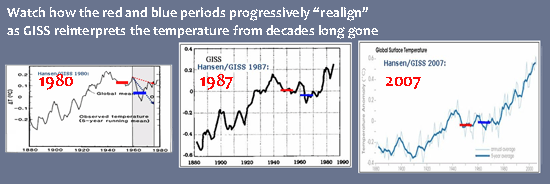
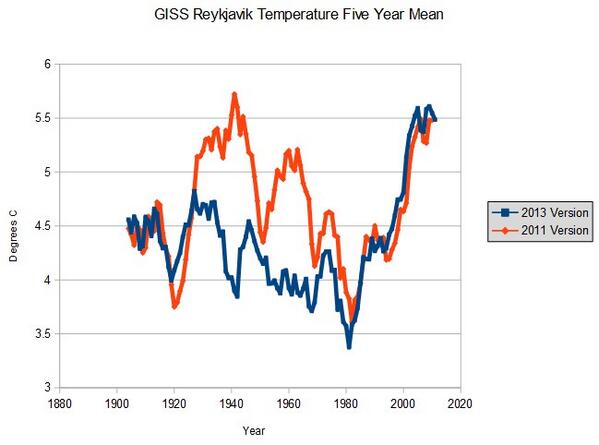
NASA/GISS/Hansen global temperature data tampering

Arctic data tampering
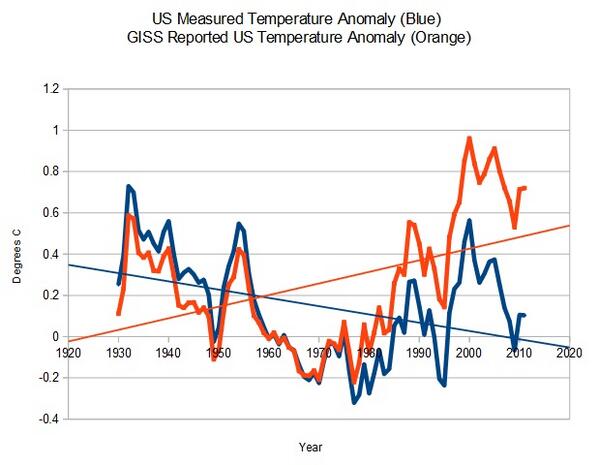
US data tampering

Theoretical and Applied Climatology

November 2013, Volume 114, Issue 3-4, pp 567-573

Alberto Boretti

The Northern Territory of Australia has a unique situation of an extension larger than France and a population of 200,000, with only three meteorology stations open for more than 40 years, Darwin (DW), Alice Springs (AS) and Tennant Creek, and only two of them, DW and AS, providing data over 100 years, and from 500 to more than 1,000 km separating these stations and the stations in the neighbouring states of Australia. Homogenizations of data in between different measuring sites for the same location as well as the way to derive the missed data to complete at least 100 years from the neighbouring locations are analysed in details and the effects on the temperature trends are straightforwardly investigated. Using properly homogenised data over 130 years and a linear fitting, the warming maximum and minimum temperatures are +0.009 and +0.057 °C/10 years for Alice Springs and −0.025 and 0.064 °C/10 years for Darwin. With the data available, the only option to produce warming trends is to overweight the cold years in the middle of the 1970s and the subsequent return to warmer temperatures. Starting from 1980, to compute trends, there is still a clear warming in Alice Springs, but also clear cooling in Tennant Creek, and a mixed behaviour with warming maximum temperatures and cooling minimum temperatures in Darwin.

Friday, November 21, 2014

The Climate Scam’s Meltdown: Corruption is now systemic in climate science

A superb essay by Australian marine biologist Walter Starck published at Quadrant Online exposes how
"The rent-seekers, opportunists, third-rate academics, carbon-market scam artists and peddlers of catastrophic prophecy can see the alarmist bubble deflating, so they're trying harder than ever to sustain the scare. Problem is, Mother Nature isn't cooperating"
The Climate Scam’s Meltdown

By Walter Starck


This doesn’t mean the climate change “debate” will stop, the news media will cease reporting weather as a dire threat, or that the true believers will no longer be obsessed by it. However, the ultimate arbiter, climate itself, has made clear its decision by ceasing to warm for over 18 years. Despite the ongoing use of fossil fuels, a proclaimed 95% certainty of 97% of scientists and the high-powered projections of the world’s most advanced climate models, the climate has refused to pay the slightest heed.

Contrary to all the confidence and predictions of alleged experts, storms are no more intense nor frequent, while droughts, floods and sea levels have declined to confirm alarmists’ barely concealed hopes of disasters. The simple fact is that the alleged experts and their high-powered models were wrong. The climate has ceased to warm and, with little or no greenhouse warming, the entire theory of Catastrophic Anthropogenic Global Warming (CAGW), aka Climate Change (CC), aka Global Warming, aka Extreme Weather, is left with no basis.

The debate over CC has been unique in the history of science in that its proponents have largely abandoned the primacy of evidence and openly declared methodology in favour of self-proclaimed authority backed by their own confidential methods and models. It is also unique in that the alarmists refuse to directly address their arguments, preferring to ignore, censor and personally denigrate them. In a few instances in the early part of the public debate, the proponents attempted direct debate with their critics but came away looking decidedly second-best and they soon refused any further direct discussion. With no convincing answers to the uncertainties and conflicting evidence raised by their opponents they simply chose to ignore them, declare the science “settled” and anoint themselves as the only experts. All who disagreed agree were deemed to be fools, knaves and/or in the pay and pocket of Big Energy.

With a naive and compliant news media steeped in the same politically correct, left wing academic indoctrination as the researchers, the latter enjoyed a near monopoly on favourable news coverage. Self-serving publicity releases were regurgitated undigested beneath the by-lines of environmental “reporters”, who eagerly reduced themselves to unquestioning stenographers.

Yet even as the alarmists’ received kid-glove treatment in the mainstream media, the Internet has been a very different story. Not only did the climate alarmists have no advantage online, the thinking public was increasingly looking to the Web as their primary source for news. This digital realm was outside any particular control or influence, open to the airing of opposing argument and evidence. It was also a forum for the exposure of malpractice, regularly producing exposes which would shatter the façade of scientific expertise and propriety the alarmists had erected around themselves. Think here of how Wattsupwiththat demolished the charlatan Michael Mann and his infamous hockey stick, and the Climategate emails revealed the lengths professional warmists are prepared to go in order to silence sceptics, not least by debasing the conventions of the peer-review process.

In retreat, climate alarmists are now trying to deny the lack of warming while fiddling the temperature record in an effort to “prove” it is continuing. Their ever-more imaginative explanations — the heat is hiding at the bottom of the ocean; trade winds are skewing sea-temperature readings — increasingly smack of desperation. Making matters worse for the alarmists, there is increasing evidence that the global climate has not only ceased to warm but may actually be starting to cool. Severe, often record-breaking winter weather demands more and more undeclared “adjustments” to the temperature record are being exposed. Overwhelmingly these serve to reduce past temperatures and increase more recent ones without which the lack of warming would be more obvious.

When such changes to the record have been discovered and questioned the response has been to waffle about “homogenization” and “world’s best practice” or to suggest such corrections are needed because, say, the Japanese bombed Darwin, a weather was moved and, therefore, the coastal city’s temperature record must be reconstructed by drawing on numbers from Daly waters, far inland. These explanations, however, are inevitably long on hypothetical context and galling deficient in specific explanations for their justification.

More broadly a similar pattern of response has also been made in various other instances wherein malpractice in climate science has been exposed. At first the problem is denied, then it is dismissed as being of no importance and, finally, the attempt is made to justify it as excusable error. In the more egregious instances, when the scandal is no longer in the news, the miscreant may then be given some prestigious award, thus certifying the unimportance of any misdeeds. To any thinking observer, all this, when combined with a noticeable lack of any disavowal by colleagues, can only confirm the corruption now systemic in climate science.

Currently the recent US/China agreement is being touted as an important breakthrough in the battle against climate change. In reality it amounts to a non-binding agreement to do nothing different before 2030. Until then China is free to continue increasing emissions while the US agrees to continue to reducing its own in line with the reductions already achieved and further anticipated through the ongoing switch from coal and oil to natural gas. For China this agreement affords cost-free relief from diplomatic pressure over their increasing emissions. On the US side it provides President Obama the excuse of diplomatic obligations to invoke his executive authority to implement various measures unlikely to receive approval from a Republican-controlled Congress. As ratification by the Congress would be required for any binding climate agreement and such approval is likely to be lengthy or never, the blank cheque for the exercise of executive authority may remain useful for some time.

The reality is that the threat of catastrophic climate change has almost certainly been vastly exaggerated. At pre-industrial levels of CO2 the back-radiated IR energy in the absorption bands of this gas was virtually all absorbed within a few tens of metres of the surface. More CO2 only concentrates the initial absorption a bit closer to the surface but the mixing at that level still quickly distributes the heat energy through a much larger volume of the lower troposphere while, at the same time, also increasing transport of heat away from the surface by enhancing evaporation, which in turn can be expected to increase cloud cover. How much actual warming may result is highly problematic. Empirical evidence is now indicating that any such warming is probably much less than has been estimated by the alarmists — probably so little as to be over-ridden by other natural variables. The only significant effect attributable with any confidence to increased CO2 thus far has been a marked greening of arid regions and an increase in agricultural yields.

With or without any agreement or government initiatives, economics, technological developments and demographic changes will in due course inevitably reduce the demand for fossil fuels and replace them with other and cleaner sources of energy. Thorium- and fusion-reactor developments are showing increasing promise of providing effectively unlimited cheap and clean energy within a few decades. For domestic use, solar voltaic technology is beginning to become competitive with mains electricity, with further gains in cost effectiveness near certain in the near future. Major advances in storage technology are also well underway and expected to become commercially available within a few years. Better cheaper solar technology to power homes and vehicles is likely to drive the beginning of mass uptake within a decade. This will be impelled by cost effectiveness, with subsidies unnecessary. Indeed, such support risks doing more harm than good if it diverts development and uptake from the best and most efficient technologies emerging from a complex, rapidly changing and impossible-to-predict scientific frontier.

An argument is often made that the climate-change threat must be real because a conspiracy involving an overwhelming majority of the world’s scientists is simply not credible. This is disingenuous in that the climate threat, as exemplified by the IPCC’s scare machine, is far from representing a scientific consensus, even a majority. Global scientific opinion on this matter is highly mixed with the alarmist position concentrated in Europe and the Anglosphere. Even here thousands of dissenters exist, including many highly qualified and respected researchers with very relevant expertise.

The core alarmist proponents only comprise a few dozen, mostly third-rate, academics whose scientific reputations are minimal outside of climate alarmism. They co-opted the niche, little known interdisciplinary field of climatology, proclaimed themselves to be the world authorities, declared a global crisis, received lavish funding to research it and gained global attention. They have been aided and abetted by sundry fellow travellers who see advantage for various other agendas. A conspiracy does not require secret planning. It can be implemented just as easily with a wink and a nod when the aims and methods are apparent to all the participants. It is time to recognise the climate scam for what it is: a conspiracy to defraud on a monumental scale.

Although climate itself is presenting its irrefutable opposing argument, failed prophets never willingly concede defeat until their mouths are stopped with the dust of reality. In this instance gob-stopping reality seems likely to take the form of severe winter weather leading to a widespread collapse of electrical power in an overloaded grid suffering from the underinvestment, malinvestment, restraints and neglect. All these stem from years of misguided climate policies. Until the crunch comes, the rent-seekers and their useful idiots in the press will rant and rage without pause, their livelihoods and careers hanging on their ability to perpetuate the hoax they foisted on the rest of us.

As so often, Shakespeare said it best: “A tale, told by an idiot, full of sound and fury, signifying nothing.”

A marine biologist, Walter Starck has spent much of his career studying coral reef and marine fishery ecosystems

Monday, February 24, 2014

Three new papers find most of the alleged global warming since 1850 is artificial

A family of scientists have submitted for open peer review 3 new papers which demonstrate that almost all of the alleged global warming of 0.7C since 1850 is artificial due to poor-siting of thermometers in urban areas. The authors also examined one of the computer programs designed to remove the "urban heat island" [UHI] bias in global temperature datasets and found errors in the program which actually increased the artificial urban heat bias. 

The papers corroborate prior work by Joe D'Aleo and Anthony Watts, as well as other peer-reviewed publications finding most to all of the alleged global warming over the 20th century may be entirely artificial and inadequately removed by homogenization procedures. 

The same authors have also submitted for open peer review 3 other papers challenging the conventional view of the physics of the atmosphere and the "greenhouse effect."

Summary: “Urbanization bias” – Papers 1-3

December 5, 2013  Our papers,   Temperature records

Many areas around the world have become highly urbanized over the last century or so. Records of weather stations which are located in urbanized areas may show artifical warming trends due to urbanization bias. In this essay, we summarise the main points of our three “Urbanization bias” papers, which we have submitted for peer review at the Open Peer Review Journal.
It has been known since at least the 19th century that urban areas are warmer than rural areas. This is known as the “urban heat island” effect.

This is a serious problem for estimating global temperature trends because many weather stations are now showing warming from an urban heat island, which wouldn’t have been there 100 years ago. That is, gradual urbanization has introduced an artificial warming bias into their weather records. This bias is called “urbanization bias”.

Since the 19th century, and particularly in the last few decades, the world has become increasingly urbanized. Urban areas still only comprise about 1%. So, this doesn’t really have much impact on actual global temperature trends. But, about half of the weather stations used for analysing global temperatures are in urban areas. As a result, the estimated global temperature trends are seriously affected by this bias.

These estimated global temperature trends are the main basis for the claims that there has been “unusual global warming” since the Industrial Revolution. This means that much of the “global warming” that people are worried about is probably just urbanization bias!

Despite that, several studies have claimed that urbanization bias isn’t a problem. So, in Paper 1, we carefully analysed these studies to see if their claims were justified. In all cases, we found that they weren’t! It turns out that the authors of those studies had each made basic errors and/or hadn’t looked at their data carefully enough.

One of the groups using weather records to calculate global temperature trends has developed a computer program which they believe has removed the urbanization biases from their data. However, in Paper 2, we analysed this program in detail and found that it didn’t work. It actually introduced as many biases as it removed!

In Paper 3, we studied the main weather station archives used for calculating global temperature trends, i.e., the Historical Climatology Network datasets.

The U.S. component of the datasets was the most reliable component and most of the U.S. stations were fairly rural. However, we found that urbanization bias had introduced an artificial warming trend of about 0.7°C/century into the urban stations. To put this in context, the “unusual global warming” that has allegedly occurred since the Industrial Revolution is supposedly about 0.8°C/century.

For the rest of the world, the Historical Climatology Network datasets didn’t actually have enough rural stations with sufficiently long records to estimate global temperature trends. Only EIGHT of the rural stations had data for at least 95 of the last 100 years!

This means that the claims that there has been “unusual global warming since the Industrial Revolution” are mostly based on data from urban stations, and much of it is probably an artefact of urbanization bias.


1. Introduction
2. What is the urban heat island problem?
3. Isn’t there other evidence for global warming?
4. Paper 1. Is urbanization bias a negligible problem?
5. Paper 2. An assessment of the NASA GISS urbanization adjustment method
6. Paper 3. How heavily urbanized are the stations used in the global temperature estimates?
7. Conclusions

1. Introduction

The main basis for the claim that there has been “unusual” global warming since the Industrial Revolution arises from the various global temperature estimates constructed from weather station records. Currently there are 5 groups publishing such estimates:


NASA Goddard Institute for Space Studies (New York City, USA)
Climate Research Unit, University of East Anglia (East Anglia, UK).
NOAA National Climatic Data Center (North Carolina, USA)
Tokyo Climate Center, Japan Meteorological Agency (Tokyo, Japan)
Berkeley Earth (California, USA)

A sixth group (originally based in Russia, but now based in USA) also updated their analysis in 2006 – see Lugina et al., 2006, Carbon Dioxide Information Analysis Center (Tennessee, USA).


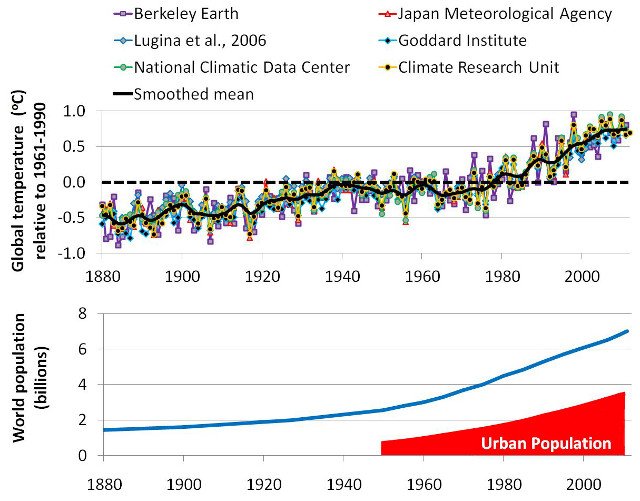
Figure 1. Comparison between the various weather station-based global temperature estimates, relative to 1961-1990. The solid black line represents the smoothed mean of all estimates.

All estimates imply that there has been an almost continuous 'global warming' since 1880. Many people have blamed this on the increase in CO2 concentrations since the Industrial Revolution. However, this period has also seen a dramatic increase in urban population (bottom panel). So, much of theapparent 'global warming' might just be urbanization bias. Click on image to enlarge.As can be seen from Figure 1, all of these global temperature estimates give pretty much the same result. Since the start of each estimate (usually 1880), they all suggest that global temperatures have been fairly steadily increasing by about 0.8°C/century.

Atmospheric carbon dioxide (CO2) concentrations have also been steadily rising since the late 19th century, and man-made global warming theory predicts that increasing carbon dioxide should cause “man-made global warming”. For this reason, many supporters of the theory assume that this apparent “global warming” is the “man-made global warming” their theory had predicted.

This has convinced many people that:
The man-made global warming theory must be correct
The weather station-based global warming estimates must be accurate

However, as we will discuss in this essay, many of the weather station records used for these estimates of global warming contain artificial warming biases, which are not representative of actual global temperatures.

The problem is that most weather station records are not kept for monitoring long term temperature trends. Instead, they are usually used for making more accurate weather forecasts, making farming decisions, helping air traffic control, and other similar short-term decisions.

A consequence of this is that the long-term records contain a lot of “non-climatic biases”. These are temperature changes which are not climatic, but are due to local changes in the station and its environment over the decades and centuries.

For example, if a station is re-located, a new type of thermometer is introduced, or new buildings are built to accommodate the staff, this could alter the temperature of the air in the immediate vicinity of the thermometer. If these local changes are not taken into account when the long-term temperature record is being analysed, this would mistakenly leave the impression that the climate itself had changed. In reality, it is only a change in themeasured temperature, not a change in the actual climatic temperature.

This means that the temperature trends in any weather station record are a combination of:
Actual climatic trends for the region
Non-climatic biases

One of the biggest problems in accurately calculating “global temperature” trends from weather records is in separating the two, and only including the actual climatic trends.

This is not easy. In fact, it is very challenging, e.g., see Mitchell, 1953 (Open access).

Our analysis shows that the 6 groups we mentioned above that have being calculating the “global warming” trends didn’t do a good enough job in accounting for these biases. They seem to have severely underestimated just how tricky a job it actually is.

Chief amongst these non-climatic biases is urbanization bias, and this is the focus of this essay.
On this website, we usually use the U.K. spelling for most words instead of the U.S. spelling, but most of the literature on urban heat islands uses the U.S. spelling, e.g., “urbanization” instead of “urbanisation”. So, in our papers and in this essay, we use the U.S. spelling for urbanization.

In general, urban areas tend to be warmer than rural areas. If you are a car owner and have a thermometer in your car, you may have noticed this, i.e., the temperature generally rises when you drive into an urban area and decreases when you leave an urban area.

As a result of this extra urban warmth, if a weather station becomes urbanized, this introduces an artificial warming bias into the station’s record, i.e., urbanization bias.

If a substantial fraction of all the weather stations from around the world have been affected by urbanization bias, then this could have introduced an artificial warming trend into the “global temperature trend” estimates. That would mean that some (or even all!) of the alleged “unusual global warming” since the Industrial Revolution is just an artefact of urbanization bias!

With this in mind, we decided it was to important to carefully investigate the urbanization bias problem, and check if it had been adequately dealt with. We have written a series of three companion papers describing the results of our investigation, and have submitted them for peer review on the Open Peer Review Journal forum we founded:

Urbanization bias I. Is it a negligible problem for global temperature estimates? – Ronan Connolly & Michael Connolly, 2014a
Urbanization bias II. An assessment of the NASA GISS urbanization adjustment method– Ronan Connolly & Michael Connolly, 2014b
Urbanization bias III. Estimating the extent of bias in the Historical Climatology Network datasets – Ronan Connolly & Michael Connolly, 2014c

Interested readers are welcome to read our three papers for a detailed assessment of the urbanization bias problem. However, each of the papers is quite long and technical, and so we have written this essay to provide a general overview of our main findings and conclusions.

In a nutshell, we found that urbanization bias has seriously affected the various global temperature trend estimates. It seems that most of the “unusual global warming” that we have heard so much about had absolutely nothing to do with our carbon footprint, but was just a consequence of urbanization bias!

The various attempts that have so far been made to deal with the urbanization bias problem have been woefully inadequate. In many cases, they actually seem to have made the problem even worse. The popular belief that the problem has been “dealt with” (e.g.,here, here, here, here, here, or here) just seems to be down to wishful thinking…

However, before we can discuss our findings, let us first consider in a bit more detail exactly what the urbanization bias problem is…

Thursday, November 29, 2012

New paper shows a large increase of solar radiation in Spain since 1985, dwarfs alleged effect of CO2

A paper published today in Global and Planetary Change finds solar radiation at the Earth surface in Spain "shows a significant increase over the 1985-2010 period" of "+3.9 Wm-2 per decade." By way of comparison, the alleged forcing from increased CO2 during the same period was only 0.11 Wm-2 at the Earth surface per decade. The authors attribute the large increase in solar radiation to a "decrease in clouds and/or aerosols." Several other papers have shown a decrease in cloudiness since the 1980's could alone account for all global warming observed since the ice age scare of the 1970's.

The math:

IPCC formula for alleged CO2 forcing at the top of the atmosphere based on CO2 levels from 1985 to 2010: 

5.35ln[389.78/346.04] = 0.64 Wm-2

Alleged CO2 forcing per decade = 10*.64/15 = 0.41 Wm-2

Alleged CO2 forcing at the Earth surface per decade = 0.41/3.7 = .11 Wm-2


Global and diffuse solar radiation in Spain: Building a homogeneous dataset and assessing their trends


A. Sanchez-Lorenzo, J. Calbó, M. Wild

There is a growing interest in the study of decadal variations in surface solar radiation during the last decades, although the analyses of long-term time series in some areas with major gaps in observations, such as in Spain, is still pending. This work describes for the first time the development of a new dataset of surface solar radiation in Spain based on the longest series with records of global solar radiation (G), most of them starting in the early 1980s. Additional records of diffuse solar radiation (D), which is a component of G much less studied due to the general scarcity of long-term series, are available for some of these series. Particular emphasis is placed upon the homogenization of this data set in order to ensure the reliability of the trends, which can be affected by non-natural factors such as relocations or changes of instruments. The mean annual G series over Spain shows a tendency to increase during the 1985-2010 period, with a significant linear trend of +3.9 Wm-2 per decade. Similar significant increases are observed in the mean seasonal series, with the highest rate of change during summer (+6.5 Wm-2 per decade) and secondly in autumn (+4.1 W m-2 per decade) and spring (+3.2 Wm-2 per decade). These results are in line with the widespread increase of G, also known as brightening period, reported at many worldwide observation sites. Furthermore, the annual mean D series starts without relevant variations during the second half of the 1980s, but it is disturbed by a strong increase in 1991 and 1992, which might reflect the signal of the Pinatubo volcanic eruption. Afterwards, the mean series shows a tendency to decrease up to the mid-2000s, with a significant linear trend of -2.1 Wm-2 per decade during the 1985-2010 period. All these results point towards a diminution of clouds and/or aerosols over the area. 

Highlights


► We develop a new dataset of surface solar radiation records in Spain. ► The global and diffuse solar radiation series have been homogenized. ► The global solar radiation shows a significant increase over the 1985-2010 period. ► The diffuse component shows a significant decrease during the same period. ► These results point towards a recent decrease of clouds and/or aerosols.