Showing posts sorted by relevance for query sea ice amo. Sort by date Show all posts

Sunday, August 10, 2014

Arctic sea ice could continue to recover for next 30+ years of negative AMO

The natural ~60-90 year Atlantic Multidecadal Oscillation [AMO] has been in its positive warming phase since 1976 and after ~30+ years of warming is "pausing" and transitioning to its ~30-45 year negative phase [cooling]:


Coincidentally, satellite observations of Arctic sea ice began in 1979 at the start of the positive warming phase of the AMO. The AMO transfers heat from the tropics to the Arctic and melts Arctic sea ice, thus the AMO and Arctic Sea Ice Index are inversely related:


Five year moving average of the Arctic Sea Ice Index [red line] is inversely correlated to the Atlantic Multidecadal Oscillation [AMO] five year moving average shown in green. 
The AMO index "paused" right around the same time global temperatures "paused," perhaps related to solar control of climate and ocean oscillations. 


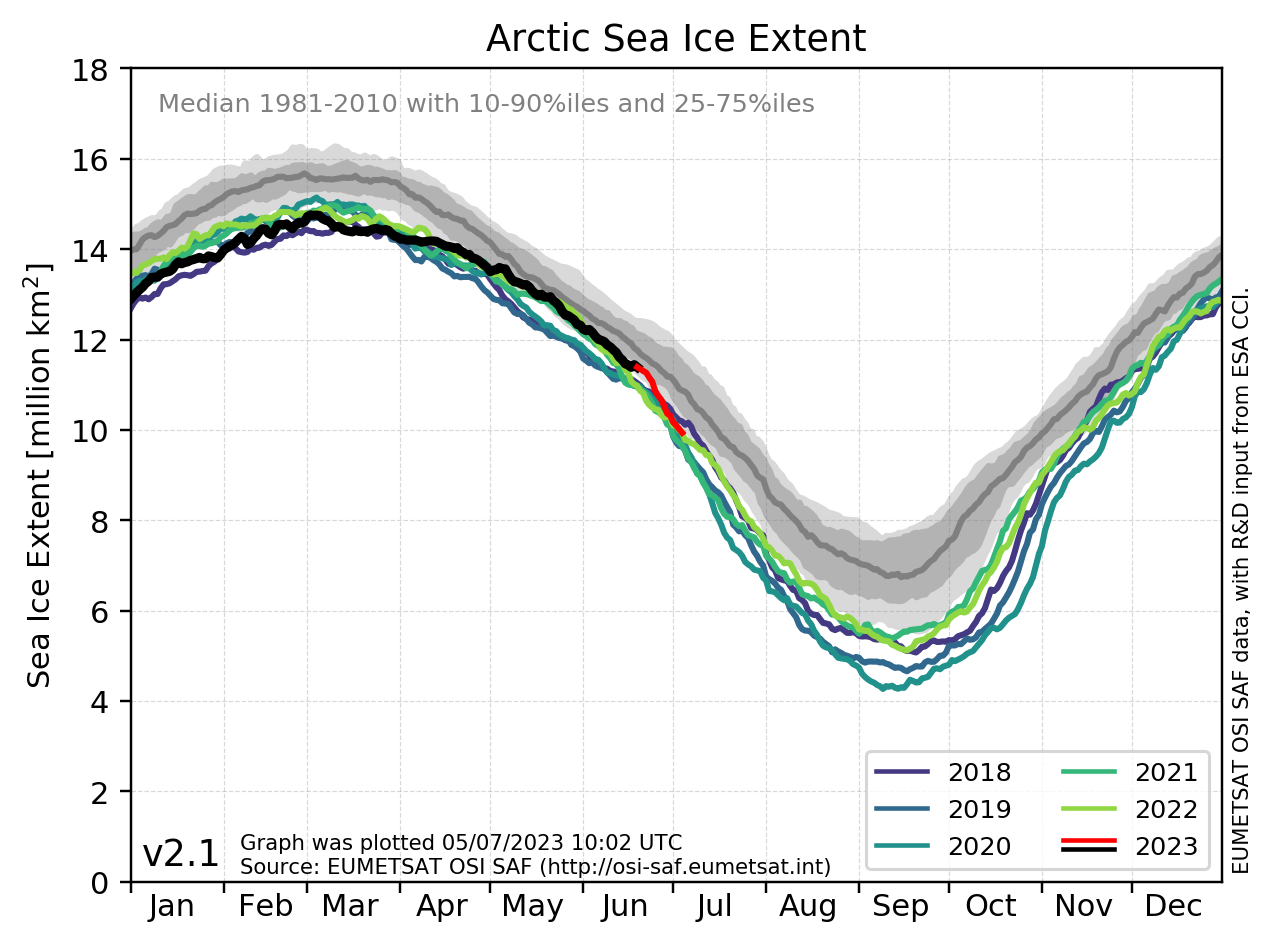
Perhaps this is why Arctic sea ice is having a dramatic recovery this year and is within one standard deviation of the mean:
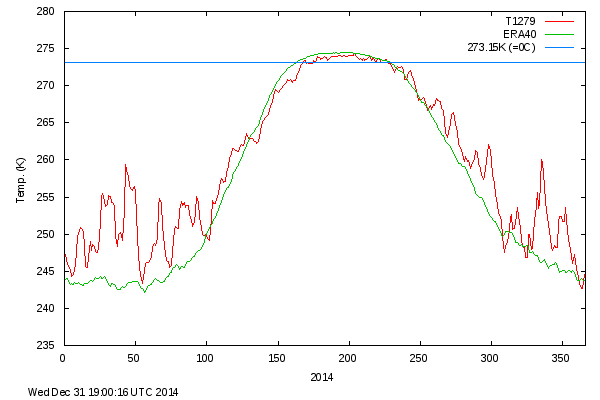
Might this explain why Arctic temperatures have been below the mean every single day during this summer's melt season?:


Thanks to the Arctic sea ice recovery and record high levels of Antarctic sea ice, global sea ice is now back to levels seen 35 years ago


The AMO may now be entering a new ~30-45 year negative phase. If this nutty denier theory is correct, Arctic sea ice could continue to recover for the next 30+ years of the negative phase of the AMO, even if you hang on to your dirty carbon-pollution-spewing SUV. 

Climate experts claim Arctic sea ice and just about everything else in climate is governed by a man-made CO2 "control knob" and most definitely not related to natural ocean oscillations such as the AMO (which in turn are controlled by solar activity), ocean warming from accumulated solar energy, and storm activity. 

Repost:

New paper finds Arctic sea ice is controlled by natural cycles
A paper published today in Geophysical Research Letters finds Arctic sea ice extent is determined primarily by the natural ~60-90 year cycle of the Atlantic Multidecadal Oscillation [AMO], not greenhouse gases.

According to the authors, "Arctic sea ice is intrinsically linked to Atlantic multidecadal [natural] variability" finding a ~60-90 year cycle of "Covariability between sea ice and Atlantic multidecadal variability as represented by the Atlantic Multidecadal Oscillation (AMO) index is evident during the instrumental record."

The paper adds to many other peer-reviewed publications finding changes in Arctic sea ice are primarily related to natural variability of ocean and atmospheric oscillations, storm and wind activity, and not changes in greenhouse gases.

A Signal of Persistent Atlantic Multidecadal Variability in Arctic Sea Ice

Martin W. Miles et al


Satellite data suggest an Arctic sea ice–climate system in rapid transformation, yet its long-term natural modes of variability are poorly known. Here, we integrate and synthesize a set of multi-century historical records of Atlantic Arctic sea ice, supplemented with high-resolution paleo proxy records, each reflecting primarily winter/spring sea ice conditions. We establish a signal of pervasive and persistent multidecadal (~60–90 year) fluctuations that is most pronounced in the Greenland Sea, and weakens further away. Covariability between sea ice and Atlantic multidecadal variability as represented by the Atlantic Multidecadal Oscillation (AMO) index is evident during the instrumental record, including an abrupt change at the onset of the early 20th century warming (ETCW). Similar covariability through previous centuries is evident from comparison of the longest historical sea ice records and paleo proxy reconstructions of sea ice and the AMO. This observational evidence supports recent modelling studies that have suggested that Arctic sea ice is intrinsically linked to Atlantic multidecadal [natural] variability. This may have implications for understanding the recent negative trend in Arctic winter sea ice extent, although because the losses have been greater in summer, other processes and feedbacks are also important.


The AMO, PDO, and NAO have all been linked to solar activity as the driver [possible lunar tidal influence as well].

Monday, December 16, 2013

New paper finds Arctic sea ice is controlled by natural cycles

A paper published today in Geophysical Research Letters finds Arctic sea ice extent is determined primarily by the natural ~60-90 year cycle of the Atlantic Multidecadal Oscillation [AMO], not greenhouse gases.

According to the authors, "Arctic sea ice is intrinsically linked to Atlantic multidecadal [natural] variability" finding a ~60-90 year cycle of "Covariability between sea ice and Atlantic multidecadal variability as represented by the Atlantic Multidecadal Oscillation (AMO) index is evident during the instrumental record."

The paper adds to many other peer-reviewed publications finding changes in Arctic sea ice are primarily related to natural variability of ocean and atmospheric oscillations, storm and wind activity, and not changes in greenhouse gases.

A Signal of Persistent Atlantic Multidecadal Variability in Arctic Sea Ice

Martin W. Miles et al
Satellite data suggest an Arctic sea ice–climate system in rapid transformation, yet its long-term natural modes of variability are poorly known. Here, we integrate and synthesize a set of multi-century historical records of Atlantic Arctic sea ice, supplemented with high-resolution paleo proxy records, each reflecting primarily winter/spring sea ice conditions. We establish a signal of pervasive and persistent multidecadal (~60–90 year) fluctuations that is most pronounced in the Greenland Sea, and weakens further away. Covariability between sea ice and Atlantic multidecadal variability as represented by the Atlantic Multidecadal Oscillation (AMO) index is evident during the instrumental record, including an abrupt change at the onset of the early 20th century warming (ETCW). Similar covariability through previous centuries is evident from comparison of the longest historical sea ice records and paleo proxy reconstructions of sea ice and the AMO. This observational evidence supports recent modelling studies that have suggested that Arctic sea ice is intrinsically linked to Atlantic multidecadal [natural] variability. This may have implications for understanding the recent negative trend in Arctic winter sea ice extent, although because the losses have been greater in summer, other processes and feedbacks are also important.

Thursday, September 18, 2014

Arctic & Antarctic sea ice extent demonstrates the bipolar seesaw theory of climate

Sunshine Hours has posted today a "mirror graph" of Arctic and Antarctic sea ice which illustrates the bipolar seesaw theory of abrupt climate change in action. It is well known that glaciation and deglaciation of the North and South poles are not synchronous and frequently out of phase or in opposite phases, similar to the "mirror graph" below of Arctic and Antarctic sea ice trends since 1979. This is entirely consistent with Milankovitch theory, the 1000-1500 year Atlantic Meridional Overturning Circulation [AMOC] and other shorter-term ocean oscillations [e.g. the AMO], and the 1st law of thermodynamics which allows for relatively constant solar energy input to be shifted in location while conserving energy. 

Further, the seesaw theory of abrupt climate change is far more plausible than the ludicrous, stretched-thin theory that global warming is causing record-high levels of Antarctic sea ice and more record-high levels of snow and cold. In fact, climate models robustly predicted the opposite of what has caused the recent record-cold US weather.
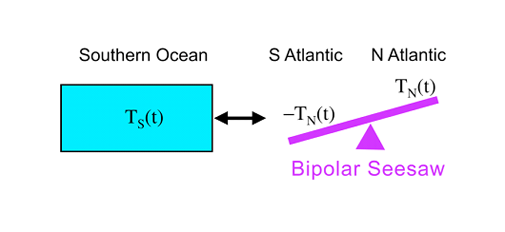
Schematic of the bipolar seesaw. North Atlantic temperature changes are mirrored by equal amplitude South Atlantic changes of opposite sign. Southern Ocean temperatures are relaxed toward this South Atlantic temperature. Source: Modeling the Bipolar Seesaw.
The seesaw theory of climate is also entirely consistent with conservation of energy, unlike Trenberth's theory of "missing heat" from man-made CO2 "hidden" somewhere within in the climate system. 

Seesaw theory in action:

Arctic/Antarctic Mirror Graph Day 260


For those who say Antarctic Sea Ice Extent increases are small and have nothing in common with Arctic losses:
Mirror Sea Ice Extent for Day 260 From 1978
Repost:

Sunday, March 30, 2014

New paper supports the bipolar seesaw theory of abrupt climate change
A paper published today in Nature finds "clear" evidence of a "hydrologic seesaw in which latitudinal migrations of the Intertropical Convergence Zone (ITCZ) produce simultaneous wetting (increased precipitation) in one hemisphere and drying in the other." According to the authors, these shifts can have "serious effects on temperate climate systems. Furthermore, our result implies that insolation-driven ITCZ dynamics may provoke water vapour and vegetation feedbacks in northern mid-latitude regions and could have regulated global climate conditions throughout the late Quaternary ice age cycles."

The paper provides additional, "clear" evidence supporting the "bipolar seesaw theory of abrupt climate change." "Theoretical models and observational data have long suggested that the Northern and Southern Hemisphere climates behave in a seesaw-like fashion: when the northern ocean warms, the southern ocean cools and vice versa." 


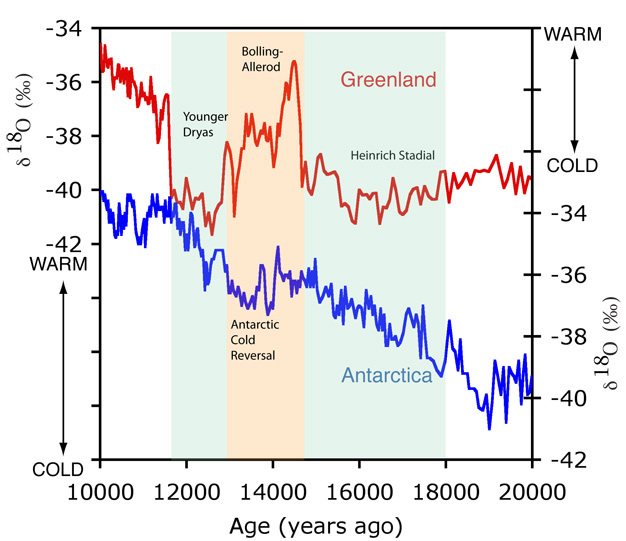
Glacials and interglacials on the northern and southern hemisphere somehow do not seem to correspond. This has led to a ‘thermal bipolar seesaw theory,’ whereby an off-mode in the thermohaline circulation leads to an ice age in Europe, but excess heat storage down south.
Given that ice cores show a lag between Arctic and Antarctic climate changes of 300-1500 years, it begs the question given that Antarctic sea ice is at record highs and Arctic sea ice has declined during the satellite era, whether this may represent part of a natural seesaw pattern, shifting heat via the thermohaline circulation from the Southern Hemisphere to the Northern Hemisphere and explaining why less warming has been observed in the Southern Hemisphere since 1850.


Mid-latitude interhemispheric hydrologic seesaw over the past 550,000 years


Nature advance online publication 30 March 2014. doi:10.1038/nature13076

Authors: Kyoung-nam Jo, Kyung Sik Woo, Sangheon Yi, Dong Yoon Yang, Hyoun Soo Lim, Yongjin Wang, Hai Cheng & R. Lawrence Edwards

An interhemispheric hydrologic seesaw—in which latitudinal migrations of the Intertropical Convergence Zone (ITCZ) produce simultaneous wetting (increased precipitation) in one hemisphere and drying in the other—has been discovered in some tropical and subtropical regions. For instance, Chinese and Brazilian subtropical speleothem (cave formations such as stalactites and stalagmites) records show opposite trends in time series of oxygen isotopes (a proxy for precipitation variability) at millennial to orbital timescales, suggesting that hydrologic cycles were antiphased in the northerly versus southerly subtropics. This tropical to subtropical hydrologic phenomenon is likely to be an initial and important climatic response to orbital forcing. The impacts of such an interhemispheric hydrologic seesaw on higher-latitude regions and the global climate system, however, are unknown. Here we show that the antiphasing seen in the tropical records is also present in both hemispheres of the mid-latitude western Pacific Ocean. Our results are based on a new 550,000-year record of the growth frequency of speleothems from the Korean peninsula, which we compare to Southern Hemisphere equivalents. The Korean data are discontinuous and derived from 24 separate speleothems, but still allow the identification of periods of peak speleothem growth and, thus, precipitation. The clear hemispheric antiphasing indicates that the sphere of influence of the interhemispheric hydrologic seesaw over the past 550,000 years extended at least to the mid-latitudes, such as northeast Asia, and that orbital-timescale ITCZ shifts can haveserious effects on temperate climate systems. Furthermore, our result implies that insolation-driven ITCZ dynamics may provoke water vapour and vegetation feedbacks in northern mid-latitude regions and could have regulated global climate conditions throughout the late Quaternary ice age cycles.

Related:

The north–south climate seesaw [Nature 2009]

Theoretical models and observational data have long suggested that the Northern and Southern Hemisphere climates behave in a seesaw-like fashion: when the northern ocean warms, the southern ocean cools and vice versa. So far, however, the data have indicated a much muted response in Antarctic climate compared to the Arctic. An analysis of new records from an ocean core from the South Atlantic — including planktonic foraminifera assemblages, Mg/Ca ratios, temperature and ocean productivity data — shows that the South Atlantic cooled essentially instantaneously with the warming in the North Atlantic during the last deglaciation. This first concrete evidence of an immediate seesaw connection also provides a link between the rapid warming in the North Atlantic and the more gradual Antarctic response, and suggests a mechanism potentially driving rapid Northern Hemisphere deglaciation.

NEWS AND VIEWSClimate change: Southern see-saw seen

The bipolar see-saw hypothesis provides an explanation for why temperature shifts in the two hemispheres were out of phase at certain times. The hypothesis has now passed a test of one of its predictions.
Jeffrey P. Severinghaus
doi:10.1038/4571093a

ARTICLEInterhemispheric Atlantic seesaw response during the last deglaciation

Stephen Barker, Paula Diz, Maryline J. Vautravers, Jennifer Pike, Gregor Knorr, Ian R. Hall & Wallace S. Broecker
doi:10.1038/nature07770

Monday, February 10, 2014

Climate models robustly predicted the opposite of what has caused the record cold US weather

An article published today "Winter weirdness: Is Arctic warming to blame?" notes "this winter has brought unseasonable warmth to Alaska, frigid temperatures to much of the Eastern US, and more drought to California. The jury is still out on whether a warmer Arctic is behind the extreme weather." "When persistent weather patterns have brought drought or heat waves or repeated invasions of cold air to usually mild locations in winter, these links to the Arctic have become a go-to explanation among many commentators and policymakers."

But is there any credibility to such claims?

The author interviews several climate scientists active in this debate including Dr. Elizabeth Barnes, who has previously debunked claims that 'Arctic amplification' causes extreme weather, as well as dueling hyper-alarmist Jennifer Francis, and others, demonstrating there is trace to no credible scientific evidence supporting such claims.

Of particular note, the article points out that climate models actually predicted the opposite pattern to occur with the jet stream drawn north, with fewer jet stream dips, and no change in jet stream blocking:
"These [modeling] studies suggest that a warming Arctic will draw the jet stream's average track north. Blocking patterns will decrease. Moreover, the models indicate no "robust" decrease in the jet stream's speed, notes Elizabeth Barnes, a climate scientist at Colorado State University in Fort Collins who focuses on the jet stream's behavior and the factors affecting it. To be sure, the models could be wrong, she acknowledges. But when different teams with different models converge on the same answer, that inspires more confidence in the result."
Interesting how climate fraudsters like Michael Mann claim the opposite of what the observational evidence shows & climate models predict. It's all for the cause

Furthermore, the article notes "Long-term swings in Atlantic sea-surface temperatures, known as the [natural] Atlantic multidecadal oscillation, appear to have the same effect on the jet stream's meanders and blocking patterns that Arctic warming and sea ice are purported to have.

When the AMO enters its warm phase – its condition since the 1990s – the jet stream tends to weaken and buckle. Blocking patterns increase, and colder temperatures prevail at mid-latitudes.

"This also supports the colder winters of recent years," Magnusdottir says, adding that the results seem robust, since they show up in real-world data as well as in computer simulations."

Winter weirdness: Is Arctic warming to blame?

This winter has brought unseasonable warmth to Alaska, frigid temperatures to much of the Eastern US, and more drought to California. The jury is still out on whether a warmer Arctic is behind the extreme weather.

By Pete Spotts, Staff writer / February 9, 2014  CSMonitor.com
Ice from her breath forms around the face of a woman in Minneapolis. Temperatures plunged in early January as the polar vortex enveloped much of the Eastern US.

For Alaskans who have basked in record warmth, Atlantans who abandoned cars during a January snowstorm, or Californians enduring drought, this winter's extremes have been nothing if not memorable.

Drought or unusual warmth is in sync with the effects that climate scientists expect from global warming. But what about wintertime invasions of Arctic air into the US Deep South or into China, where, a new study indicates, record cold events became more frequent over the past 10 to 20 years?

For some climate scientists, January's extremes and the atmospheric patterns that nurtured and sustained them are fresh bits of information to apply to these intriguing questions: Has global warming's effect on the Arctic set the stage for persistent weather patterns that lead to extremes? If so, is the decline in Arctic sea ice the stage manager for the wintry events?

Nearly two years ago, two researchers identified atmospheric features that appear to tie a warming Arctic to mid-latitude weather extremes. Since then, when persistent weather patterns have brought drought or heat waves or repeated invasions of cold air to usually mild locations in winter, these links to the Arctic have become a go-to explanation among many commentators and policymakers.

Researchers working on the issue, however, caution that while they are uncovering intriguing hints of this tie-in,Ice from her breath forms around the face of a woman in Minneapolis. Temperatures plunged in early January as the polar vortex enveloped much of the Eastern US.

Nor is it merely an arcane debating point. If the proposition holds up, in principle it could help improve seasonal forecasts for temperature and precipitation.

"That would have huge economic implications," says Cecilia Bitz, a climate scientist at the University of Washington in Seattle who specializes in the role that Arctic sea ice plays in the climate system.

The state of this science today is comparable to that of tropical cyclones and global warming following hurricane Katrina in 2005, suggests Jennifer Francis, an atmospheric scientist at Rutgers University in New Brunswick, N.J. For those phenomena, dueling studies appeared, and evidence for an existing fingerprint of global warming on patterns of tropical cyclone activity was equivocal.[actually not, cyclone activity is at record low levels and climate models predict decreased cyclone activity from global warming]

"We are in the same situation," says Dr. Francis, who, along with colleague Stephen Vavrus at the University of Wisconsin-Madison, published the hypothesis about Arctic links to weather extremes in the journal Geophysical Research Letters in March 2012.

The duo starts by noting that warming in the Arctic has occurred at two to three times the pace of warming for the rest of the Northern Hemisphere, reducing the temperature difference between the Arctic and mid-latitudes. As the contrast shrinks, the jet stream slows.

The jet stream is a river of high-altitude winds that steers and spawns storms and in effect serves as an atmospheric boundary for cold Arctic air. A slower jet stream produces longer meanders, the pair says. This would bring cold air farther south and warm air farther north than otherwise would be the case.

At the same time, the two say, circulation patterns that block the migration of these meanders appear more frequently and persist. This would cause specific weather patterns to either creep along or dally for days to weeks.

Other researchers have connected a warming Arctic to weather extremes in specific regions. At a two-day workshop on the topic at the University of Maryland in College Park last September, climate scientist James Screen of the University of Exeter in England pointed to studies that link shrinking sea ice to cold winters in North America and Eurasia, wet summers in Europe, extreme rainfall in the Mediterranean, and the behavior of the East Asian monsoon.

But Dr. Screen also cautioned against claiming too much for the connections – at least at this point. An apparent link doesn't say much about cause and effect, he and others noted.

The case for the link between the shrinking extent of Arctic sea ice and cold winters in Eurasia was the strongest, he offered. Even here, however, the influence is barely detectable and often not statistically significant.


The caution that he and others express centers in no small part on the radically different effects that Francis and Dr. Vavrus see compared with a decade's worth of modeling studies.

These studies suggest that a warming Arctic will draw the jet stream's average track north. Blocking patterns will decrease. Moreover, the models indicate no "robust" decrease in the jet stream's speed, notes Elizabeth Barnes, a climate scientist at Colorado State University in Fort Collins who focuses on the jet stream's behavior and the factors affecting it.


To be sure, the models could be wrong, she acknowledges. But when different teams with different models converge on the same answer, that inspires more confidence in the result.
The scientists' caution also hinges on the relatively short time that the Arctic has undergone rapid warming, Francis adds, noting that it has occurred only in the past 10 or 15 years. Model projections can help, but "it's going to take maybe another decade" before any signs of an Arctic influence can be confidently detected, she says.

Francis and colleagues also have looked specifically at sea ice loss and winter weather extremes, finding a link.

In effect, the ever-shrinking amount of sea ice in the fall makes more moisture available for snow. Increased snowfall over the North American or Eurasian Arctic earlier in the fall-winter season cools the air more quickly than a later snowfall would.

This more southerly mass of cold air affects pressure patterns in ways that boost the likelihood of blocking patterns and cold snaps.

This idea appears to draw some support from modeling work that was published last August and conducted by Yannick Peings and Gudrun Magnusdottir of the University of California, Irvine.

When they plugged the average Arctic sea ice decline between 2007 and 2012 into the model, it yielded cold conditions at mid-latitudes, mainly over Asia. The model also produced some increase in the depth of the jet stream's meanders, although the statistical significance was small. All this tended to take place in February.

But by 2090, according to their model projection, the Arctic warmed so much that wintertime cold extremes at mid-latitudes remained only as frequent as they were in 2010.

Further work by Dr. Magnusdottir and colleagues has added another wrinkle. Long-term swings in Atlantic sea-surface temperatures, known as the [natural] Atlantic multidecadal oscillation, appear to have the same effect on the jet stream's meanders and blocking patterns that Arctic warming and sea ice are purported to have.

When the AMO enters its warm phase – its condition since the 1990s – the jet stream tends to weaken and buckle. Blocking patterns increase, and colder temperatures prevail at mid-latitudes.

"This also supports the colder winters of recent years," Magnusdottir says, adding that the results seem robust, since they show up in real-world data as well as in computer simulations.

Others looking for predicted circulation patterns have a hard time finding anything. In a study published last month in Geophysical Research Letters, Dr. Barnes of Colorado State and colleagues used three independent approaches to identifying blocking patterns in climate data. They reported finding trends in isolated regions and at specific periods, but no trend was significant and common to all three approaches.

"Blocking is so variable from year to year that there's no evidence that anything out of the ordinary is occurring," Barnes says. Nor has she found trends in changes to the jet stream's meanders or travel time around the hemisphere.


Does this mean that Francis and Vavrus are wrong? "Not at all," Barnes says. [For more on Francis & Barnes see Dr. Curry's post here]

The evidence may be masked for now by the "noise" of natural variability. And other factors affect the jet stream. Perhaps "you have a tug of war going on" between the influence of sea ice and something else, Barnes says.

For her part, Francis acknowledges that for now, several of the links tying Arctic warming to patterns that foster bouts of extreme weather are still weak. On the other hand, no one is finding that the meanders in the jet stream are getting any smaller, she adds.

"Everybody's seeing a hint that this is happening," she says, "but we can't say it's definitely happening yet."

Related:

New consensus rediscovers 'polar vortex' jet stream dips are due to global cooling

Does Global Warming Theory Predict Record Cold?
January 6th, 2014 by Roy W. Spencer, Ph. D.
 
NO.

Is global warming causing the polar vortex?

by Judith Curry In a word, no.
JC message to Jennifer Francis:  I’ve found that your credibility is reduced and your own motivations are questioned when you attack the motives of another scientist [Barnes], particularly a young scientist without any apparent agenda beyond doing good science and advancing her academic career.  The high ground is a much better place to be, and not just in a hurricane.

Wednesday, June 19, 2013

Warmists now complain that cold summers could last another 10 years

The warmists are now complaining about "awful" summers in Britain with "below-average temperatures and sunshine, and above-average rainfall" that could last "until 2023." This follows their prior complaints about potentially deadly summer heatwaves, and that alleged warming would cause above-average rainfall. 

Related: A data review to supplement the UK Met Office ‘Disappointing Weather Meeting’


Britain's spell of awful summers is set to continue

The Guardian, 


Forecast that UK could be in middle of 10-20 year 'cycle' of wet summers delivered following gathering at Met Office

end up being unnecessarily lengthy and costly
Jo Swinson's proposals aim to combat appeals which 'end up being unnecessarily lengthy and costly.' Photograph: Rex Features
Don't worry, summer is on its way – but you might have to wait until 2023.
As the prospect of another gloomy Glastonbury and wet Wimbledon looms, leading climate scientists have warned that the UK could be set for a further five to 10 years of washout summers.
The grim conclusion was delivered after an unprecedented gathering of scientists and meteorologists at the Met Office in Exeter to debate the range of possible causes for Europe's "unusual seasonal weather" over recent years, a sequence that has lasted since 2007.
Many will have hoped for news of sunnier times ahead. But after experts brainstormed through the day they delivered the shock finding that the UK could be in the middle of a 10-20 year "cycle" of wet summers. The last six out of seven summers in the UK have seen below-average temperatures and sunshine, and above-average rainfall.
Stephen Belcher, head of the Met Office Hadley Centre and professor of meteorology at the University of Reading, stressed that the finding was not an official long-term forecast and does not automatically mean the UK will now have a further decade of wet summers. But, he said, the scientists' conclusion was that the chances of this occurring are now higher than they first thought.
"Predicting when this cycle will end is hard," said Belcher, who led the meeting of 25 scientists. "We have seen similar patterns before – in the 1950s and the 1880s – and we have hints that we are coming towards the end of this current cycle. However, it might continue for the next five to 10 years. There is a higher probability of wet summers continuing. But it's very early days in trying to understand why this is happening."
The scientists must now address what "dynamical drivers" are causing this cycle, Belcher said. The meeting debated a range of possible interconnected reasons for the unusual weather of recent years, including this year's cold spring and the freezing winter of 2010/11. The most likely cause for the wet summers, he said, was the Atlantic multi-decadal oscillation, or AMO, a natural pattern of long-term changes to ocean currents.
Other candidate causes that could be "loading the dice", as Belcher described it, include a shift in the jet stream, solar variability and fast-retreating Arctic sea ice. Aggravating all of these factors could be the influence of anthropogenic greenhouse gases entering the atmosphere.
Dr James Screen, who studies how melting sea ice impacts on the jet stream at the University of Exeter, said: "There has been a lot of talk about declining Arctic sea ice playing a role in our weather patterns, but really that's just one aspect of changes in the Arctic climate – which has seen rapid warming compared to other parts of the world. Those changes mean there is less of a difference in temperature between the Arctic and tropics, which could impact the position of the jet stream."
The scientists also debated how melting sea ice should be better incorporated into climate models, as well as how observational data – for example, deep-ocean temperatures – could be improved to help their understanding of the potential relationship between climate change and the recent run of inclement weather and record-breaking extremes.
Len Shaffrey, a climate modeller based at the University of Reading who is also currently investigating possible links between Arctic sea ice retreat and European weather, said: "There are some fascinating science questions emerging about the influences on our weather, for example, from natural variations in ocean temperature. There is also some evidence that the record low amounts of Arctic sea ice have influenced patterns of European and British weather, but this evidence is not yet conclusive either way."
The scientific debate about the role of the jet stream – the fast "river" of meandering, 10km-high air which greatly determines UK weather - is intensifying. This week researchers from the University of Sheffield published a study in the International Journal of Climatology showing how "unusual changes" to the jet stream caused the "exceptional" melting of the Greenland ice sheet during the summer of 2012. Scientists say they must now determine what is causing these "displacements", as they are known, in the jet stream.
Tourist bosses were trying to find silver linings. David Leslie, a spokesman for the tourism agency Visit Britain, said people did not come to the UK for the weather alone. "The weather here is as unpredictable as anywhere else," he added.
"The days of the UK being seen as a foggy, wet destination have passed. Hot, cold or mildly pleasant, the weather is not a deterrent for overseas visitors coming here to enjoy Britain's tourism offering, which remains the best in the world."

Saturday, September 6, 2014

Multiple papers ignored by IPCC document the effect of natural ocean oscillations on climate

Google translation from german (apologies) plus light editing, from Die Kalte Sonne:
IPCC co-founder Bert Bolin had already known the climatic role of the ocean cycles very well
Die Kalte Sonne
A common argument of the IPCC proponents against ocean cycles and their relevance as an important climate factor is that the modern temperature measurements date back only two to three 60-year cycles. Thus, one can not prove the quasi-cyclic nature. This is a nice attempt, but not if considered in light of the supporting literature. Several research teams have reconstructed the various ocean cycles which can now be traced back far into the past. The quasi-cyclic nature is therefore well documented and the attempt to defend the climate alarm goes nowhere. Below we take a look at the latest work on the subject. Additional literature is also mentioned in our book "The cold sun".
Reconstruction of ocean cycles in the past
Deng et al. 2013 : Reconstruction of the PDO since 1853 using corals in the South China Sea
Olafsdottir et al. 2013 : Reconstruction of the AMO and NAO in Iceland for the past 3000 years
Svendsen et al. 2014: reconstruction of the AMO for the last 200 years
Chylek et al. 2012: reconstruction of the AMO for the last 660 years based on ice cores 
excerpt from the Executive Summary: A longer time scale AMO component of 45-65 years, Which HAS BEEN CLEARLY seen in the 20th century SST data, is detected only in central Greenland ice cores . We find a significant difference in between the AMO cycles falling on the Little Ice Age (LIA) and the Medieval Warm Period (MWP). The LIA what dominated by a ~ 20 year AMO cycle with no other decadal or multidecadal scale variability above the noise level. HOWEVER, falling on the MWP preceding- the 20 year cycle what Replaced by a longer scale cycle centered near a period of 43 years with a 11.5 year periodicity Further.
Chiessi et al. 2013: AMO in Brazil during the last 5000 years
Olsen et al. 2012 : NAO the last 5200 years 
excerpt from the Executive Summary: The North Atlantic Oscillation Influences climate in the Arctic region and northern Europe.Reconstructions of circulation patterns associated with the North Atlantic Oscillation from a 5,200-year-long lake sediment record did suggest the atmospheric circulation Responded to significant transitions in Northern Hemisphere climate. See also report in The Hockeyschtick .


Ocean cycles fired heating 1977-1998
A Swedish scientist told us that the IPCC must certainly have known the importance of the ocean cycles in the early phase of his ministry. One of the IPCC's co-founder, who died in 2007, Bert Bolin said to have spoken at a meeting in the establishment phase of the IPCC in the 1980s openly about the 60-year cycle of the ocean cycles. At that time predicted warming Bolin 30 years since the previous 30 years were rather characterized by cooling. The following is the text of the email:
I have heard from a participant at this meeting, with politicians and party Officials, Bolin Explained: The last 30 years we have had a slight cooling. Before 1910-1940 did we had a warming period. Before it did what cooling. It Seems did the temperature is going up and down with a period of 60 years, so it is reasonable to expect the next 30 years did want to be warm. Bolin obviously had some idea of ​​PDO influence on climate already at this time.
30 years heating it then but it was not entirely, but the forecast of the IPCC Bolin was initially planning reliability and credibility among the population. The IPCC would have had a harder many times when he would have been founded around the turn of the millennium, the beginning of the still ongoing temperature plateaus.
Even the art is now becoming increasingly clear that during the heating phase 1977-1998, all is not received with the right things and the alleged power of the CO 2 is to a large extent rather to the account "supporting means", so the warming effect of the ocean cycles. Thus wrote Large & Yeager, 2012 in the Journal of Climate that the warming 1984-2006 of "natural variability" (herewith are probably meant the ocean cycles) was dominated and the long-term climate change played only a minor role.
In March 2014, published research group led by Petr Chylek in the Geophysical Research Letters an important work titled "The Atlantic Multidecadal Oscillation as a dominant factor of oceanic influence on climate". In it, the authors expect to one-third of global warming 1977-1998 the warming positive phase of the AMO-ocean cycle. The work was extensively discussed on WUWT ( here , here , here ). Excerpt from the abstract:
The anthropogenic effects account for about two Thirds of the post-1975 global warming with one third being due to the positive phase of the AMO.
End of May 2014 put a team around Jacques Servain in the journal Climate Dynamics and interpreted according to the warming from 1977 to 1998 in the Atlantic also associated with the warm phase of the AMO.

Ocean cycles prevent further warming since 1998
Gradually it dawns experts also that probably the current warming pause the cooling phase of the ocean cycles is owed. We had already reported several times at this point:

Even the PIK Potsdam Institute mitlerweile recognizes the cooling role of the AMO in connection with the current Erwärmungshiatus (seeSchleussner et al. 2,014 ).
Case studies for climate-influencing effect of ocean cycles are not lacking. In the book of Salomon Kroonenberg ("The thousand-year cycle") is a chapter on the development of water level of the Caspian Sea, which is influenced mainly by the 60-year-old PDO / AMO cycle. The same is also in the Great Salt Lake in Utah is the case, as Wang et al. 2010 documented. And also the climate of Myanmar was under the PDO control, asD'Arrigo and Ummenhofer (2014) were able to show. In February 2014 wrote Mendoza et al. in the journal Atmospheric Research, the climate in Mexico is also controlled by the PDO, with probably the changing Cloud cover plays an important role. In Germany could Lohmann et al. (2013)demonstrate ocean cycles in cave stalactites. The 60-year-old AMO and NAO-cyclicality also appeared in Italy in a snow statistics for the past 300 years, as in Enzi et al. 2014 is read. And the deep-water temperatures in the Arctic Svalbard behaved cyclically, conducted by the NAO ( Ferré et al. 2,012 ).

Possible solar influence on ocean cycles
There is much evidence that the 60-year rhythm of the ocean cycles pulsates freely independently in the climate system. However, there seems to be such studies indicate some interactions with the solar activity and perhaps the planetary orbits. How could Harry van Loon and Gerald Meehl 2014 show in the Geophysical Research Letters, that it does play a role in climate, whether the PDO and NAO occurs in phase with the 11-year solar cycle or in phase opposition.
In February 2014, published group to Mads Knudsen Faurschou in Nature Communications, a work that describes a clear influence of the AMO by solar activity. Here is the short version:
Evidence for external forcing of the Atlantic Multidecadal Oscillation since termination of the Little Ice Age
The Atlantic Multidecadal Oscillation (AMO) Represents a significant driver of Northern Hemisphere climate, but the forcing mechanisms pacing the AMO REMAIN poorly be understood. Here we use the available proxy records to investigate the influence of solar and volcanic forcing on the AMO over the load ~ 450 years. The evidence did Suggests external forcing played a dominant role in pacing the AMO after termination of the Little Ice Age (LIA; ca. 1400-1800), with at instantaneous impact on mid-latitude sea-surface Temperatures did spread across the North Atlantic over the ensuing ~ 5 years. In contrast, the role of external forcing what more ambiguous falling on the LIA. Our study Further Suggests did the Atlantic Meridional Overturning Circulation is Important for linking external forcing with North Atlantic sea-surface Temperatures, a conjecture did reconciles two opposing theories Concerning the origin of the AMO.
And Lin et al. 2014 report in a publication in Climate of the Past of a solar influence of the AMO. Previously had Muthers et al. , such interaction interpreted. A solar context, the NAO with the solar activity was of Boberg & Lundstedt 2002 reports.

Prediction
While it used to always meant the ocean cycles were unpredictable and arbitrary, but it has now recognized that there is a system and forecast possibilities. For the AMO this last set Hazeleger et al. 2013 in the Journal of Geophysical Research tight.
Li et al. 2,013 go in the Geophysical Research Letters even go a step further and developed a temperature forecast for the next 15-20 years based on the NAO and AMO-development. Here is the summary of your work:
NAO implicated as a predictor of Northern Hemisphere mean temperature Multidecadal variability
The twentieth century Northern Hemisphere mean surface temperature (NHT) is Characterized by a multidecadal warming-cooling-warming pattern Followed by a flat trend since about 2000 (recent warming hiatus). Here we demonstrate the North Atlantic Oscillation did (NAO) is implicated as a useful predictor of NHT multidecadal variability. Observational analysis shows did the NAO leads Detrended Both the NHT and oceanic Atlantic Multidecadal Oscillation (AMO) by 15-20 years. Theoretical analysis illuminates did the NAO precedes NHT multidecadal variability through its delayed effect on the AMO due to the large thermal inertia associated with slow oceanic Processes. An NAO-based linear model is established to predict the NHT THEREFORE, Which gives an excellent hindcast for NHT in 1971-2011 with the recent flat trend well predicted. NHT in 2012-2027 is predicted to fall slightly over the next Decades, due to the recent NAO decadal weakening did temporarily offsets the anthropogenically induced warming.
Did you catch the last sentence of the abstract? The temperature of the northern hemisphere is slightly cool to 2027, as the NAO will weaken.Nothing else stood in 2012 in our book "The cold sun" ...