Showing posts sorted by relevance for query warming storm activity. Sort by date Show all posts

Saturday, July 30, 2011

New paper shows global warming decreases storm activity

A paper presented this week at the INQUA Bern conference reconstructs storm activity over the past 7000 years along the French Mediterranean coast and finds that global warming during the Medieval Warming Period was "characterized by low storm activity" in comparison to cold periods such as the Little Ice Age. The paper concludes that cold periods increase storm activity because of the increase in thermal gradient between the tropics and poles.
Third graph from left shows storm activity with shaded areas representing high storm activity. Sea surface temperatures are shown in last graph at right side. Second graph from left is a proxy for solar activity. Vertical axis is number of years before the present.
Increased storm activity during Holocene cold events in the NW Mediterranean Sea 
Pierre Sabatier et al
Abstract: A high-resolution record of paleostorm events along the French Mediterranean coast over the past 7,000 years was established from a sediment core from a lagoonal environment in the Gulf of Lions. Using a multi-proxy approach that integrated grain size, faunal analysis, clay mineralogy and geochemistry data with a chronology derived from radiocarbon dating, we recorded seven periods of increased in storm activity at 6,200; 5,400; 4,600-4,200; 3,600-3,100; 2,600; 1,900-1,500 yr cal B.P. and over the Little Ice Age. In contrast, our results show that the Medieval Climate Anomaly was characterised by low storm activity. 
These evidences for high storm activity in the NW Mediterranean Sea are in agreement with the changes in coastal hydrodynamics observed over the North Atlantic and correspond to Holocene cooling periods in the North Atlantic. Periods of low SSTs observed in this area may have led to a stronger meridional temperature gradient and a southward migration of the westerlies during these periods. We hypothesise that the increase in storm activity during Holocene cold events over the North Atlantic and Mediterranean regions was probably due to an increase in the thermal gradient that led to an enhanced lower tropospheric baroclinicity over a large Central Atlantic-European domain.
There are several other papers demonstrating that global warming causes a decrease in storm/hurricane activity, including this paper just reviewed by the NIPCC:

Reference: Clarke, M.L. and Rendell, H.M. 2009. The impact of North Atlantic storminess on western European coasts: a review. Quaternary International 195: 31-41. 
According to Clarke and Rendell (2009), "an understanding of the patterns of past storminess is particularly important in the context of future anthropogenically driven climate change," especially in light of "predictions of increased storm frequency ... by the end of the current century." Hence, they say that "a long-term proxy-based record of storminess, extending back into the Holocene, would provide ... a firmer foundation for future predictions." And in the present study they attempt to construct such a record.
Specifically, Clarke and Rendell reviewed evidence for storm activity across the North Atlantic region derived from instrumental records and archival evidence of storm impacts, comparing the information thereby obtained with sedimentological and chronological evidences of sand movement and dune building along western European coasts. In doing so, the two UK researchers determined that "the most notable Aeolian sand drift activity was concentrated in the historic period 0.5-0.1 ka (AD 1500-1900) which spans the Little Ice Age." And they say that "within this period, low solar activity, during the Maunder (AD 1645-1715) and Dalton (AD 1790-1830) Minima, has been related to changes in Atlantic storm tracks (van der Schrier and Barkmeijer, 2005), anomalously cold winter and summer temperatures in Scandinavia (Bjerknes, 1965), and the repositioning of the polar front and changing sea ice cover (Ogilive and Jonsson, 2001)." In addition, they state that "the Holocene record of sand drift in western Europe includes episodes of movement corresponding to periods of Northern Hemisphere cooling (Bond et al., 1997) ... and provides the additional evidence that these periods, like the Little Ice Age, were also stormy." 
On the basis of these several real-world reconstructions of North Atlantic storminess that impacted western Europe, it would appear that global warming would result in less rather than more storminess in that part of the planet, in contradiction of most climate-alarmist claims of more frequent and stronger storms there -- and elsewhere -- if the world were to warm any further.

Additional References:

Bjerknes, J. 1965. Atmospheric-ocean interaction during the 'Little Ice Age.' In: WMO-IUGG Symposium on Research and Development Aspects of Long-Range Forecasting, WMO-No. 162, TP 79, Technical Note 66, pp. 77-88.

Bond, G., Showers, W., Cheseby, M., Lotti, R., Almasi, P., deMenocal, P., Priore, P., Cullen, H., Hajdas, I. and Bonani, G. 1997. A pervasive millennial-scale cycle in North Atlantic Holocene and Glacial climate. Science 278: 1257-1266.

Ogilvie, A.E.J. and Jonsson, T. 2001. "Little Ice Age" research: a perspective from Iceland. Climatic Change 48: 9-52.

van der Schrier, G. and Barkmeijer, J. 2005. Bjerknes' hypothesis on the coldness during AD 1790-1820 revisited. Climate Dynamics 24: 355-371.

Monday, September 23, 2013

New paper predicts an increase of US thunderstorms; Reality check: US thunderstorms peaked in the mid-20th century when CO2 was 'safe'

A new paper claims CMIP5 climate models, which have been falsified by 3 peer-reviewed papers, project that thunderstorm activity will increase in the future. However, prior work has shown US thunderstorm activity peaked in the mid-20th century when CO2 was 'safe,' the opposite of what would be expected from the modelling results. 

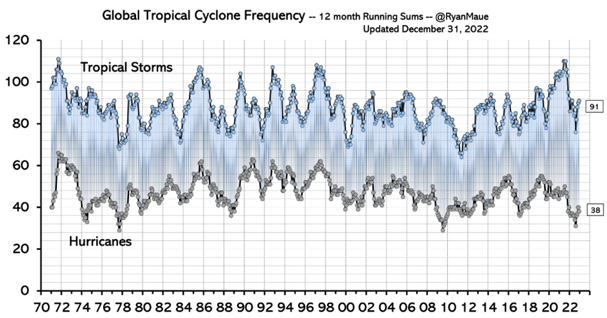
In addition, the authors state that the models predict a decrease in vertical wind shear, which decreases the potential for thunderstorms and tornadoes. The authors claim the models predict an opposing increase in convective available potential energy (CAPE), although if this was true, current global accumulated cyclone energy would not be near the lowest values of the past 40 years.


Global Warming Is Likely to Increase Severe Thunderstorm Conditions in U.S., Research Finds

Sep. 23, 2013 — Severe thunderstorms, often exhibiting destructive rainfall, hail and tornadoes, are one of the primary causes of catastrophic losses in the United States. New climate models suggest a robust increase in these types of storms across the country.


In 2012, 11 weather disasters in the United States crossed the billion-dollar threshold in economic losses. Seven of those events were related to severe thunderstorms.

New climate analyses led by Stanford [aka "global warming central"] scientists indicate that global warming is likely to cause a robust increase in the conditions that produce these types of storms across much of the country over the next century.

Severe thunderstorms are one of the primary causes of catastrophic losses in the United States and often exhibit the conditions that generate heavy rainfall, damaging winds, hail and tornadoes.

Sparse historical data describing the atmospheric conditions that cause severe thunderstorms has limited scientists' ability to project the long-term effects of global warming on storm frequency. But, using a complex ensemble of physics-based climate models, researchers led by Noah Diffenbaugh, an associate professor of environmental Earth system science at Stanford, have produced the most comprehensive projections of severe storm conditions for the next century.

Scientists have identified two main ingredients involved in generating a severe thunderstorm. The first is that the atmosphere must contain a significant amount of what scientists call convective available potential energy (CAPE), created as the air in the low atmosphere warms. The warm air rises, carrying with it moisture to higher altitudes. [Note if CAPE was actually increasing, global accumulated cyclone energy would not be declining for the past decade]

To transform into a severe thunderstorm, CAPE must also interact with strong vertical wind shear -- essentially a moving wind current that organizes the atmospheric energy and moisture such that it can sustain a storm.

Climate researchers have previously hypothesized that global warming will increase CAPE and cause an overall decrease in wind shear, which created uncertainty about the net effect.

The new climate model experiment that Diffenbaugh and his co-authors analyzed, called the Coupled Model Intercomparison Project (CMIP5)[CMIP5 models are the ones previously falsified], confirms these competing effects, but in a different way than previously believed.

Although the climate model experiment does indicate an overall decrease in the average amount of wind shear, the researchers found that the bulk of that decrease occurs on days that produce levels of CAPE that are much lower than is normally seen during severe storms.

The net effect is that the increases in CAPE on other days drive increases in the occurrence of severe thunderstorm environments.

"We're seeing that global warming produces more days with high CAPE and sufficient shear to form severe thunderstorms," said Diffenbaugh, who is also a senior fellow at the Stanford Woods Institute for the Environment.

Stormy springs ahead

The analysis carved the United States into boxes that were roughly 60 miles on a side and assessed the climate conditions that could emerge over the next century. The analysis showed the biggest changes occurring in the spring season, with each box in the central United States experiencing about two-and-a-half additional storm days per spring by the late 21st century.

The researchers also reported that sustained global warming is likely to cause robust increases in storm days over large areas of the eastern United States not only in spring but also in winter and autumn. While the summer season also showed increases over the region as a whole, those increases were the least robust within the region and across the different climate models.

An additional few days of severe storm conditions might not seem like a large change, but Diffenbaugh emphasized that the projected increases are in fact substantial compared to the frequency of occurrence in the current climate.

"We are looking at the conditions that produce severe events, which are relatively rare at present," Diffenbaugh said. "For example, the changes during spring represent an increase of about 40 percent over the eastern U.S. by the late 21st century."

Diffenbaugh also emphasized even a single severe storm can cause very high levels of damage.

"The severe thunderstorms we experience now can result in very high economic losses," Diffenbaugh said. "Sadly, we have many examples of cases where a single storm has had disastrous impact. So a 25 or 30 percent increase in the annual occurrence represents a substantial increase in the overall risk."

Potential for more tornadoes

Such storms also create conditions that can lead to tornado formation, although the researchers stress caution in drawing conclusions specifically about the effect of global warming on tornadoes.

"We have tried to analyze the atmospheric conditions that are associated with tornadoes," Diffenbaugh said. "Although we do see that those conditions increase in occurrence in response to global warming, it is important to bear in mind that we are not resolving tornadoes in these experiments." [wrong again - tornadoes are primarily related to wind shear increases, so if there is a decrease in wind shear, there will be fewer tornadoes]

Diffenbaugh hopes to build on this research to improve the understanding of the atmospheric dynamics that lead to the development of severe thunderstorms, and to better incorporate those processes into climate models.

"These are rare but significant events," Diffenbaugh said. "This new set of global climate model experiments has provided some important new insights. What we need to do next is [get tons of government grant money to] develop ways to better represent the processes that produce individual storms in the real atmosphere."

The study is published in the current issue of Proceedings of the National Academy of Sciences.

Journal Reference:
Noah S. Diffenbaugh, Martin Scherer, and Robert J. Trapp. Robust increases in severe thunderstorm environments in response to greenhouse forcing. PNAS, September 23, 2013 DOI: 10.1073/pnas.1307758110


Authors: Changnon, S.A.1; Changnon, D.2
Source: Climatic Change, Volume 50, Number 4, September 2001 , pp. 489-503(15)

Thunder-day occurrences during a 100-year period based on data from carefully screened records of 86 first-order stations distributed across the United States were assessed for temporal fluctuations and trends during 1896–1995. Short-term ( < 10-year) fluctuations of adjacent stations were often dissimilar reflecting localized differences in storm activity in a few years, making spatial interpretations difficult. But, temporal fluctuations based on 20-year and longer periods exhibited regional coherence reflecting the control of large, synoptic-scale weather systems on the distribution of thunderstorms over broad areas. Classification of station fluctuations based on 20-year periods revealed six types of distributions existed and they formed 12 discrete areas across the nation. One type present in the lower Midwest and the South had a peak in storm activity in 1916–1935 followed by a general decline to 1976–1995. A second type maximizing at the same time had its minimum earlier, in 1956–1975. Another distribution found at stations in the upper Midwest and Northeast had a mid-century peak (1936–1955) with a recent minimum in 1976–1995. A fourth distribution also peaked in 1936–1955 but had an early minimum in 1896–1915, and it mainly occurred in the northern plains and Rocky Mountains. A fifth distribution peaked during 1956–1975 and was found at stations in four areas including the central High Plains, Southwest, northern Great Lakes, and Southeast. The sixth temporal distribution showed a steady increase in storm activity during the 100-year period, peaking in 1976–1995, and covered a large area extending from the Pacific Northwest across the central Rockies and into the southern High Plains. The national average distribution based on all station values peaked in mid century. The national distribution differs markedly from several regional distributions illustrating the importance of using regional analysis to assess temporal fluctuations in severe weather conditions in the nation. The 100-year linear trends of the 86 stations defined six regions across the U.S. Significant upward trends existed over most of the western two-thirds of the nation, unchanging trends existed in the northern plains and Midwest, and downward trends were found in most of the nation's east. The up trends in storm-day frequencies in the southern plains occurred where storm damage is greatest and where demographic changes have added to storm losses over time. The national patterns of trends and storm distributions were similar to those found for hail. The temporal distributions of storm activity helped explain recent increases in major storms and their losses, conditions which have increased in the west and south.

Related:  Why warming reduces the occurrence and intensity of tornadoes

Wednesday, January 29, 2014

New paper finds Australian tropical cyclones are currently at 'unprecedented' lowest levels in 550-1,500 years

A paper published today in Nature finds "Australian tropical cyclone activity [is currently] lower than at any time over the past 550–1,500 years" and "we show, on the basis of a new tropical cyclone activity index (CAI), that the present low levels of storm activity on the mid west and northeast coasts of Australia are unprecedented over the past 550 to 1,500 years."

"Other studies project a decrease in the frequency of tropical cyclones towards the end of the twenty-first century in the southwest Pacific, southern Indian and Australian regions. Our results, although based on a limited record, suggest that this may be occurring much earlier than expected."


The paper adds to many other peer-reviewed publications finding global warming decreases storm activity, and that climate models predict decreased storm activity in the future, opposite to the claims of climate alarmists. 


Nature 505, 7485 (2014). doi:10.1038/nature12882

Authors: Jordahna Haig, Jonathan Nott & Gert-Jan Reichart

The assessment of changes in tropical cyclone activity within the context of anthropogenically influenced climate change has been limited by the short temporal resolution of the instrumental tropical cyclone record (less than 50 years). Furthermore, controversy exists regarding the robustness of the observational record, especially before 1990. Here we show, on the basis of a new tropical cyclone activity index (CAI), that the present low levels of storm activity on the mid west and northeast coasts of Australia are unprecedented over the past 550 to 1,500 years. The CAI allows for a direct comparison between the modern instrumental record and long-term palaeotempest (prehistoric tropical cyclone) records derived from the 18O/16O ratio of seasonally accreting carbonate layers of actively growing stalagmites. Our results reveal a repeated multicentennial cycle of tropical cyclone activity, the most recent of which commenced around ad 1700. The present cycle includes a sharp decrease in activity after 1960 in Western Australia. This is in contrast to the increasing frequency and destructiveness of Northern Hemisphere tropical cyclones since 1970 in the Atlantic Ocean and the western North Pacific Ocean. Other studies project a decrease in the frequency of tropical cyclones towards the end of the twenty-first century in the southwest Pacific, southern Indian and Australian regions. Our results, although based on a limited record, suggest that this may be occurring much earlier than expected.

Saturday, May 25, 2013

Paper finds warming causes fewer storms

A recent paper published in Nature Geoscience examines storm activity in the English Channel over the past 6,500 years and finds that warm periods are associated with fewer storms and cold periods with more storms, just the opposite of what the world's climate alarmists would have everyone believe.
The authors conclude that "in light of concerns about the impact of anthropogenic greenhouse gases on extreme storm events in the coming years/decades, our results indicate that modern coupled ocean-atmosphere dynamics at North Atlantic mid-latitudes should tend towards the low phase of the 1,500-year internal oceanic cycle, in contrast to Little Ice Age climate conditions."

From the latest edition of the NIPCC Report:

Storms of the Northern Hemisphere

Reference: Sorrel, P., Debret, M., Billeaud, I., Jaccard, S.L., McManus, J.F. and Tessier, B. 2012. Persistent non-solar forcing of Holocene storm dynamics in coastal sedimentary archives. Nature Geoscience 5: 892-896.

According to Sorrel et al. (2012), "the macrotidal Seine Estuary and Mont-Saint-Michel Bay are two coastal sedimentary systems both located along the southern coast of the English Channel in northwestern France," an area that they say is "well suited to investigate long-term storminess variability because it is exposed to the rapidly changing North Atlantic climate system, which has a substantial influence on the Northern Hemisphere in general."

In light of the great significance of the facts described above, Sorrel et al. go on to present "a reappraisal of high-energy estuarine and coastal sedimentary records from the southern coast of the English Channel," and in doing so, they report finding "evidence for five distinct periods during the Holocene when storminess was enhanced during the past 6,500 years."

Specifically, the six scientists say they found that "high storm activity occurred periodically with a frequency of about 1,500 years, closely related to cold and windy periods diagnosed earlier (Bond et al., 2001; Wanner et al., 2008; Wanner et al., 2011)." And they go on to show that "millennial-scale storm extremes in northern Europe are phase-locked with the period of internal ocean variability in the North Atlantic of about 1,500 years (Debret et al., 2009)," with the last extreme stormy period "coinciding with the early to mid-Little Ice Age," while "in contrast, the warm Medieval Climate Optimum was characterized by low storm activity (Sorrel et al., 2009; Sabatier et al., 2012)."

Sorrel et al. conclude that "in light of concerns about the impact of anthropogenic greenhouse gases on extreme storm events in the coming years/decades, our results indicate that modern coupled ocean-atmosphere dynamics at North Atlantic mid-latitudes should tend towards the low phase of the 1,500-year internal oceanic cycle, in contrast to Little Ice Age climate conditions [italics added]," which state of affairs suggests that warming should lead to relatively less storminess, or just the opposite of what the world's climate alarmists would have everyone believe.

Additional References:

Bond, G., Kromer, B., Beer, J., Muscheler, R., Evans, M.N., Showers, W., Hoffmann, S., Lotti-Bond, R., Hajdas, I. and Bonani, G. 2001. Persistent solar influence on North Atlantic climate during the Holocene. Science 294: 2130-2136.

Debret, M., Sebag, D., Costra, X., Massei, N., Petit, J.R., Chapron, E. and Bout-Roumazeilles, V. 2009. Evidence from wavelet analysis for a mid-Holocene transition in global climate forcing. Quaternary Science Reviews 28: 2675-2688.

Sabatier, P., Dezileau, L., Colin, C., Briqueu, L., Bouchette, F., Martinex, P., Siani, G., Raynal, O. and von Grafenstein, U. 2012. 7000 years of paleostorm activity in the NW Mediterranean Sea in response to Holocene climate events. Quaternary Research 77: 1-11.

Sorrel, P., Tessier, B., Demory, F., Delsinne, N. and Mouaze, D. 2009. Evidence for millennial-scale climatic events in the sedimentary infilling of a macrotidal estuarine system, the Seine estuary (NW France). Quaternary Science Reviews 28: 499-516.

Wanner, H., Beer, J., Butikofer, J., Crowley, T.J., Cubasch, U., Fluckiger, J., Goose, H., Grosjean, M., Fortunat, J., Kaplan, J.O., Kuttel, M., Muller, S.A., Prentice, I.C., Solomina, O., Stocker, T.F., Tarasov, P., Wagner, M. and Widmann, M. 2008. Mid- to Late Holocene climate change: an overview. Quaternary Science Reviews 27: 1791-1828.

Wanner, H., Solomina, O., Grosjean, M., Ritz, S. and Jetel, M. 2011. Structure and origin of Holocene cold events. Quaternary Science Reviews 30: 3109-3123.

Prior posts on storm activity

Tuesday, November 13, 2012

New paper finds the highest storm activity is associated with cold periods

A new paper published in Nature Geoscience examines climate change over the past 11,500 years and finds, contrary to the claims of climate alarmists, that the highest storm activity is associated with cold periods. According to the authors, "We find that high storm activity occurred periodically with a frequency of about 1,500 years, closely related to cold and windy periods." The paper adds to several others showing that global warming decreases storm activity and extreme weather


Persistent non-solar forcing of Holocene storm dynamics in coastal sedimentary archives


Nature Geoscience
 
(2012)
 
doi:10.1038/ngeo1619
Received
 
Accepted
 
Published online
 
Considerable climatic variability on decadal to millennial timescales has been documented for the past 11,500 years of interglacial climate123. This variability has been particularly pronounced at a frequency of about 1,500 years, with repeated cold intervals in the North Atlantic13. However, there is growing evidence that these oscillations originate from a cluster of different spectral signatures4, ranging from a 2,500-year cycle throughout the period to a 1,000-year cycle during the earliest millennia. Here we present a reappraisal of high-energy estuarine and coastal sedimentary records from the southern coast of the English Channel, and report evidence for five distinct periods during the Holocene when storminess was enhanced during the past 6,500 years. We find that high storm activity occurred periodically with a frequency of about 1,500 years, closely related to cold and windy periods diagnosed earlier123. We show that millennial-scale storm extremes in northern Europe are phase-locked with the period of internal ocean variability in the North Atlantic of about 1,500 years4. However, no consistent correlation emerges between spectral maxima in records of storminess and solar irradiation. We conclude that solar activity changes are unlikely to be a primary forcing mechanism of millennial-scale variability in storminess.

Wednesday, August 3, 2011

New paper finds Arctic sea ice strongly linked to varying storm activity

Warmists often claim changes in Arctic sea ice are a consequence of allegedly-anthropogenic global warming. However, a paper published today in the Journal of Geophysical Research finds that "dramatic interannual changes" in Arctic sea ice extent are due to varying storm activity in the months of May-July, which impacts "cloud cover and ice motion, and consequently sea ice melt." The authors find fewer cyclones in the Arctic Ocean "appear to favor a low sea ice area at the end of the melt season." Thus, the alleged connection between AGW and Arctic sea ice extent becomes all the more elusive.
JOURNAL OF GEOPHYSICAL RESEARCH, VOL. 116, D15105, 10 PP., 2011

Dramatic interannual changes of perennial Arctic sea ice linked to abnormal summer storm activity 

Key Points:

Interannual changes of Arctic sea ice are related to varying storm activity
Fewer summer storms favor low sea ice at the end of the melt season
Storms impact the cloud cover and ice motion, and consequently sea ice melt

James A. Screen et al

The perennial (September) Arctic sea ice cover exhibits large interannual variability, with changes of over a million square kilometers from one year to the next. Here we explore the role of changes in Arctic cyclone activity, and related factors, in driving these pronounced year-to-year changes in perennial sea ice cover. Strong relationships are revealed between the September sea ice changes and the number of cyclones in the preceding late spring and early summer. In particular, fewer cyclones over the central Arctic Ocean during the months of May, June, and July appear to favor a low sea ice area at the end of the melt season. Years with large losses of sea ice are characterized by abnormal cyclone distributions and tracks: they lack the normal maximum in cyclone activity over the central Arctic Ocean, and cyclones that track from Eurasia into the central Arctic are largely absent. Fewer storms are associated with above-average mean sea level pressure, strengthened anticyclonic winds, an intensification of the transpolar drift stream, and reduced cloud cover, all of which favor ice melt. It is also shown that a strengthening of the central Arctic cyclone maximum helps preserve the ice cover, although the association is weaker than that between low cyclone activity and reduced sea ice. The results suggest that changes in cyclone occurrence during late spring and early summer have preconditioning effects on the sea ice cover and exert a strong influence on the amount of sea ice that survives the melt season.

Thursday, January 17, 2013

Two new papers predict fewer Northern Hemisphere cyclones in future


Simple uncertainty frameworks for selecting weighting schemes and interpreting multi-model ensemble climate change experiments

Philip G. Sansom*
University of Exeter, Exeter, United Kingdom
David B. Stephenson
University of Exeter, Exeter, United Kingdom
Christopher A. T. Ferro
University of Exeter, Exeter, United Kingdom
Giuseppe Zappa
National Centre for Atmospheric Sciences, University of Reading, Reading, United Kingdom
Len Shaffrey
National Centre for Atmospheric Sciences, University of Reading, Reading, United Kingdom

Abstract
Future climate change projections are often derived from ensembles of simulations from multiple global circulation models using heuristic weighting schemes. This study provides a more rigorous justification for this by introducing a nested family of three simple analysis of variance frameworks. Statistical frameworks are essential in order to quantify the uncertainty associated with the estimate of the mean climate change response.

The most general framework yields the “one model, one vote” weighting scheme often used in climate projection. However, a simpler additive framework is found to be preferable when the climate change response is not strongly model-dependent. In such situations, the weighted multi-model mean may be interpreted as an estimate of the actual climate response, even in the presence of shared model biases.
Statistical significance tests are derived to choose the most appropriate framework for specific multi-model ensemble data. The framework assumptions are explicit and can be checked using simple tests and graphical techniques. The frameworks can be used to test for evidence of non-zero climate response and to construct confidence intervals for the size of the response.

The methodology is illustrated by application to North Atlantic storm track data from the CMIP5 multi-model ensemble. Despite large variations in the historical storm tracks, the cyclone frequency climate change response is not found to be model-dependent over most of the region. This gives high confidence in the response estimates. Statistically significant decreases in cyclone frequency are found on the flanks of the North Atlantic storm track and in the Mediterranean basin.


CIMP5 multimodel ensemble projection of storm track change under global warming

Edmund K. M. Chang, Yanjuan Guo, Xiaoming Xia
[1] CMIP5 multimodel ensemble projection of midlatitude storm track changes has been examined. Storm track activity is quantified by temporal variance of meridional wind and sea level pressure (psl), as well as cyclone track statistics. For the Southern Hemisphere (SH), CMIP5 models project clear poleward migration, upward expansion, and intensification of the storm track. For the Northern Hemisphere (NH), the models also project some poleward shift and upward expansion of the storm track in the upper troposphere/lower stratosphere, but mainly weakening of the storm track toward its equatorward flank in the troposphere. Consistent with these, CMIP5 models project significant increase in the frequency of extreme cyclones during the SH cool season, but significant decrease in such events in the NH. Comparisons with CMIP3 projections indicate high degrees of consistency for SH projections, but significant differences are found in the NH. Overall, CMIP5 models project larger decrease in storm track activity in the NH troposphere, especially over North America in winter, where psl variance as well as cyclone frequency and amplitude are all projected to decrease significantly. In terms of climatology, similar to CMIP3, most CMIP5 models simulate storm tracks that are too weak and display equatorward biases in their latitude. These biases have also been related to future projections. In the NH, the strength of a model's climatological storm track is negatively correlated with its projected amplitude change under global warming, while in the SH, models with large equatorward biases in storm track latitude tend to project larger poleward shifts.

Tuesday, January 21, 2014

New paper shows global warming decreases storm activity and extreme weather

A paper published today in Quaternary Science Reviews reconstructs storm activity in Iceland over the past 1,200 years and finds storminess and extreme weather variability was far more common during the Little Ice Age in comparison to the Medieval Warm Period and the 20th century. The paper adds to many other peer-reviewed publications finding global warming decreases storm activity, the opposite of claims by climate alarmists. 


Storm activity shown in 2nd graph from top was much greater and more variable during the Little Ice Age in comparison to the Medieval Warm Period and the 20th century.  Top graph shows one of Mann's bogus hockey sticks in red, and another non-hockey-stick reconstruction in grey [Moberg et al 2005]. 
Fig. 8. Multiple proxies of environmental change in Iceland AD 700–2000. (a) Two multi-proxy temperature reconstructions, North Atlantic sea surface temperatures (SST, Mann et al., 2009) and Moberg et al. (2005). (b) Shows GISP2 Na+ deviations from the mean, a proxy for storminess (Meeker and Mayewski, 2002). Cumulative deviations from the mean show a shift to stormier and windier conditions around AD 1425 (Dugmore et al., 2007). (c) Changes in total organic carbon at Lake Haukadalsvatn, west Iceland used as a proxy for aeolian erosion (Geirsdóttir et al., 2009). Bold horizontal bars show means over periods matching key tephra horizons in study (see Table 1). (d) Woodland cover is represented by Betulapollen percentages from a lake core near Lake Mývatn, north Iceland (Lawson et al., 2007) and charcoal pits present in south Iceland (Church et al., 2007) (e) Mean aggregate SeAR from Skaftártunga for period separated by dated tephra layers, with 1 standard deviation show by grey shading. Mean calculated where n = >10. (f) Mean aggregate SeAR at the scale of the landholding, from two small landholdings (Hrífunes and Flaga, see Fig. 1d). (g) Change in SeAR at the landscape scale, 2 stratigraphic sections which record the onset of increased erosion at AD 1597, but profile 38 shows stability through the entire settlement period prior to AD 1918. (h) Population trends in Iceland. Prior to the first census in AD 1703 estimates are based on medieval populations being similar to or even higher than the population in AD 1703 (90 and 43). Plague reductions of ∼40% in AD 1402–1404 and ∼30% in AD 1496 are shown (Karlsson, 1996).

Late-Holocene land surface change in a coupled social–ecological system, southern Iceland: a cross-scale tephrochronology approach

  • a Department of Geography and Sustainable Development, School of Geography and Geology, Irvine Building, St Andrews KY16 9AL, UK
  • b Institute of Geography, School of GeoSciences, Drummond Street, Edinburgh EH8 9XP, UK
Tephrochronology can be used to produce cross scale-analysis of land surface change.
Grímsvötn tephras are dated to AD 1432 ± 5 and AD 1457 ± 5.
High resolution 1200-year record of land surface change from Skaftártunga, south Iceland.
Increasing spatial heterogeneity in sediment accumulation rates after AD ∼870.
Relationship between climate, vegetation cover and land surface change contingent on past conditions.

Abstract

The chronological challenge of cross-scale analysis within coupled socio-ecological systems can be met with tephrochronology based on numerous well-dated tephra layers. We illustrate this with an enhanced chronology from Skaftártunga, south Iceland that is based on 200 stratigraphic profiles and 2635 individual tephra deposits from 23 different eruptions within the last 1140 years. We present new sediment-accumulation rate based dating of tephra layers from Grímsvötn in AD 1432 ± 5 and AD 1457 ± 5. These and other tephras underpin an analysis of land surface stability across multiple scales. The aggregate regional sediment accumulation records suggest a relatively slow rate of land surface change which can be explained by climate and land use change over the period of human occupation of the island (after AD ∼870), but the spatial patterning of change shows that it is more complex, with landscape scale hysteresis and path dependency making the relationship between climate and land surface instability contingent. An alternative steady state of much higher rates of sediment accumulation is seen in areas below 300 m asl after AD ∼870 despite large variations in climate, with two phases of increased erosion, one related to vegetation change (AD 870–1206) and another related to climate (AD 1597–1918). In areas above 300 m asl there is a short lived increase in erosion and related deposition after settlement (AD ∼870–935) and then relatively little additional change to present. Spatial correlation between rates of sediment accumulation at different profiles decreases rapidly after AD ∼935 from ∼4 km to less than 250 m as the landscape becomes more heterogeneous. These new insights are only possible using high-resolution tephrochronology applied spatially across a landscape, an approach that can be applied to the large areas of the Earth's surface affected by the repeated fallout of cm-scale tephra layers.

Tuesday, April 15, 2014

New paper finds storm activity in Alaska is at relatively low levels compared to the past 9,600 years

A paper published today in Quaternary Research reconstructs storm activity in Alaska over the past 9,600 years and finds storm activity at the end of the record [2000 AD] was at relatively low levels in comparison to the rest of the Holocene [past ~10,000 years]. The authors also find storm activity was more variable from 1500 AD - 1850 AD during the Little Ice Age, which contradicts alarmist claims that warming causes increased extreme weather.  

Top graph of BSI % is a proxy for storminess, with lower levels indicating more storminess, as shown at bottom of graph. Horizontal axis is thousands of years before the present. 

The abundance of sedimentary organic material from two lakes was used to infer past Holocene storminess on Adak Island where frequent storms generate abundant rainfall and extensive cloud cover. Andrew and Heart Lakes are located 10 km apart; their contrasting physical characteristics cause the sedimentary organic matter to respond differently to storms. Their records were synchronized using correlated tephra beds. Sedimentation rates increased between 4.0 and 3.5 ka in both lakes. Over the instrumental period, Andrew Lake biogenic-silica content (BSi) is most strongly correlated with winter sunlight availability, which influences photosynthetic production, and river input, which influences the dilution of BSi by mineral matter. Heart Lake BSi is likely affected by wind-driven remobilization of sediment, as suggested by correlations among BSi, the North Pacific Index, and winter storminess. The results indicate relatively stormy conditions from 9.6 to 4.0 ka [thousands of years ago], followed by drying between 4.0 and 2.7 ka, with the driest conditions from 2.7 to 1.5 ka. The stormiest period was between AD 500 and 1200, then drying from 1150 to 1500 and more variable until 1850. This record of Holocene storminess fills a major gap at the center of action for North Pacific wintertime climate.

Sunday, August 10, 2014

Arctic sea ice could continue to recover for next 30+ years of negative AMO

The natural ~60-90 year Atlantic Multidecadal Oscillation [AMO] has been in its positive warming phase since 1976 and after ~30+ years of warming is "pausing" and transitioning to its ~30-45 year negative phase [cooling]:


Coincidentally, satellite observations of Arctic sea ice began in 1979 at the start of the positive warming phase of the AMO. The AMO transfers heat from the tropics to the Arctic and melts Arctic sea ice, thus the AMO and Arctic Sea Ice Index are inversely related:


Five year moving average of the Arctic Sea Ice Index [red line] is inversely correlated to the Atlantic Multidecadal Oscillation [AMO] five year moving average shown in green. 
The AMO index "paused" right around the same time global temperatures "paused," perhaps related to solar control of climate and ocean oscillations


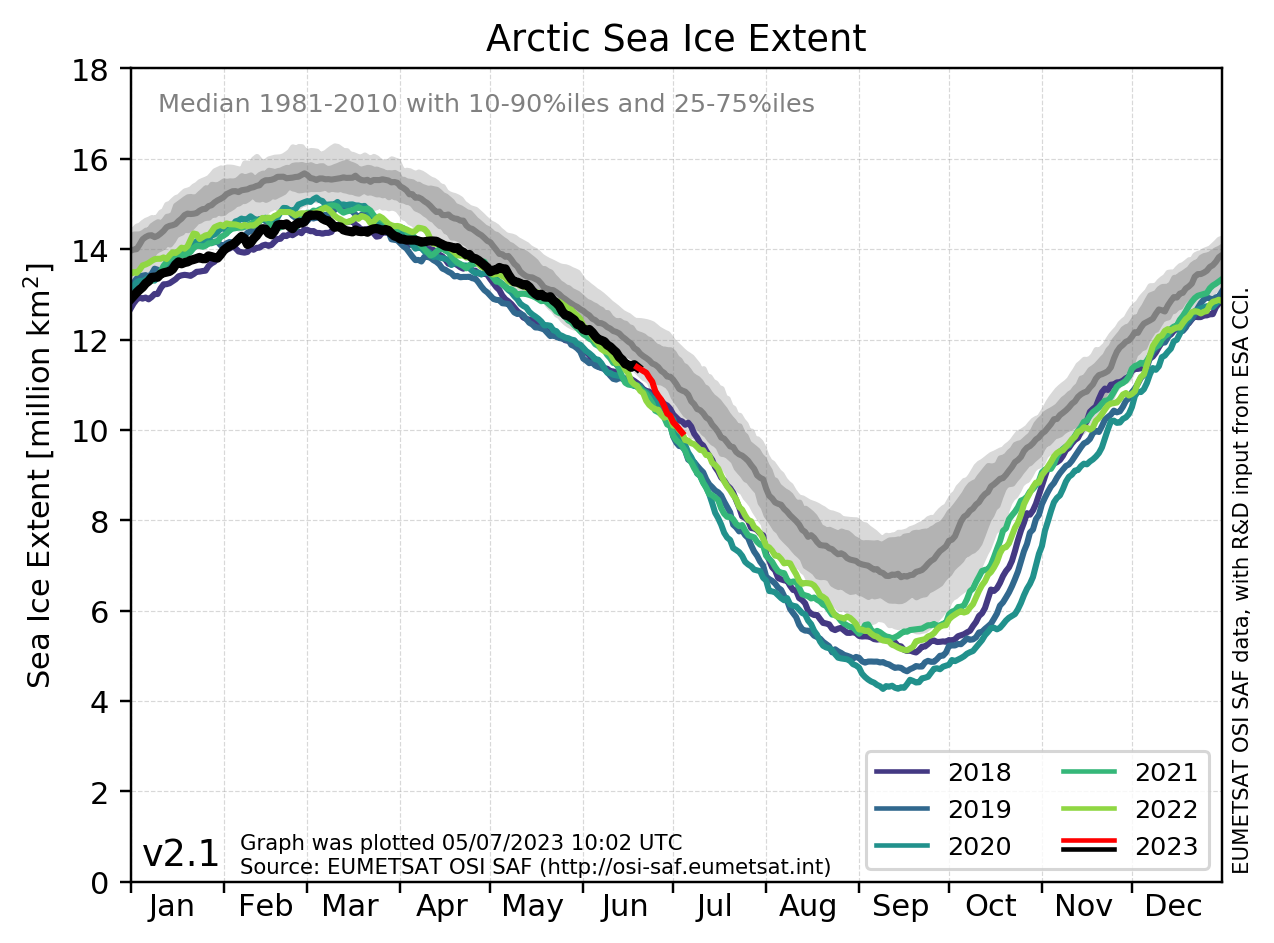
Perhaps this is why Arctic sea ice is having a dramatic recovery this year and is within one standard deviation of the mean:


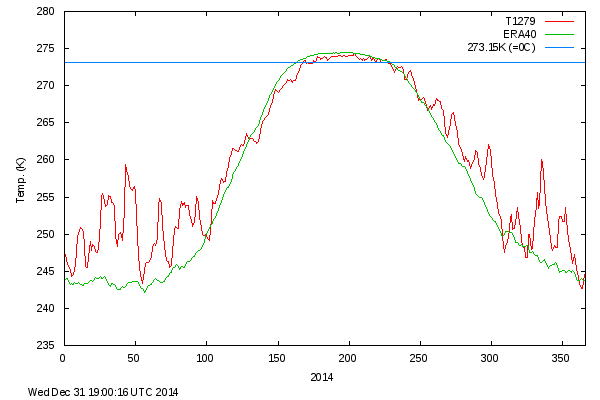
Might this explain why Arctic temperatures have been below the mean every single day during this summer's melt season?:


Thanks to the Arctic sea ice recovery and record high levels of Antarctic sea ice, global sea ice is now back to levels seen 35 years ago


The AMO may now be entering a new ~30-45 year negative phase. If this nutty denier theory is correct, Arctic sea ice could continue to recover for the next 30+ years of the negative phase of the AMO, even if you hang on to your dirty carbon-pollution-spewing SUV. 

Climate experts claim Arctic sea ice and just about everything else in climate is governed by a man-made CO2 "control knob" and most definitely not related to natural ocean oscillations such as the AMO (which in turn are controlled by solar activity), ocean warming from accumulated solar energy, and storm activity

Repost:

New paper finds Arctic sea ice is controlled by natural cycles
A paper published today in Geophysical Research Letters finds Arctic sea ice extent is determined primarily by the natural ~60-90 year cycle of the Atlantic Multidecadal Oscillation [AMO], not greenhouse gases.

According to the authors, "Arctic sea ice is intrinsically linked to Atlantic multidecadal [natural] variability" finding a ~60-90 year cycle of "Covariability between sea ice and Atlantic multidecadal variability as represented by the Atlantic Multidecadal Oscillation (AMO) index is evident during the instrumental record."

The paper adds to many other peer-reviewed publications finding changes in Arctic sea ice are primarily related to natural variability of ocean and atmospheric oscillations, storm and wind activity, and not changes in greenhouse gases.

A Signal of Persistent Atlantic Multidecadal Variability in Arctic Sea Ice

Martin W. Miles et al


Satellite data suggest an Arctic sea ice–climate system in rapid transformation, yet its long-term natural modes of variability are poorly known. Here, we integrate and synthesize a set of multi-century historical records of Atlantic Arctic sea ice, supplemented with high-resolution paleo proxy records, each reflecting primarily winter/spring sea ice conditions. We establish a signal of pervasive and persistent multidecadal (~60–90 year) fluctuations that is most pronounced in the Greenland Sea, and weakens further away. Covariability between sea ice and Atlantic multidecadal variability as represented by the Atlantic Multidecadal Oscillation (AMO) index is evident during the instrumental record, including an abrupt change at the onset of the early 20th century warming (ETCW). Similar covariability through previous centuries is evident from comparison of the longest historical sea ice records and paleo proxy reconstructions of sea ice and the AMO. This observational evidence supports recent modelling studies that have suggested that Arctic sea ice is intrinsically linked to Atlantic multidecadal [natural] variability. This may have implications for understanding the recent negative trend in Arctic winter sea ice extent, although because the losses have been greater in summer, other processes and feedbacks are also important.


The AMO, PDO, and NAO have all been linked to solar activity as the driver [possible lunar tidal influence as well].