 |
| NOAA global outgoing longwave radiation [OLR] from annualized monthly means, via the KNMI Climate Explorer |
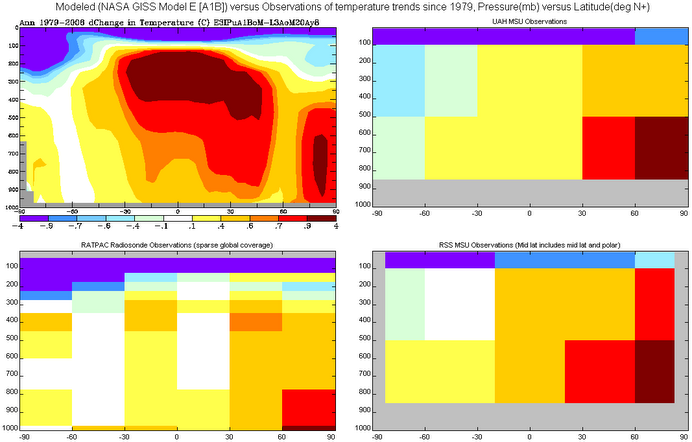
In addition, the theory predicts the "trapping" of OLR should cause a "hot spot" in the tropical mid- upper troposphere to warm faster than the Earth surface. However, satellite observations are again contrary to the theory and instead show that the "hot spot" does not exist, that the mid-troposphere has warmed at the same rate as the surface, while the upper troposphere has cooled since 1979.
From Climate4you.com:

Diagram showing observed linear decadal temperature change at surface, 300 hPa and 200 hPa, between 20oN and 20oS, since January 1979. Data source: HadAT and HadCRUT3. Click here to compare with modelled altitudinal temperature change pattern for doubling atmospheric CO2. Last month included in analysis: March 2012. Last diagram update: 14 June 2012.
The three diagrams above (using data from HadAT and HadCRUT3) show the linear trend of the temperature change since 1979 between 20oN and 20oS to be ca. 0.00087oC/month at the surface, 0.00089oC/month at 300 hPa, and -0.00016oC/month at 200 hPa, corresponding to 0.10455, 0.10650 and -0.0188oC/decade, respectively (see bar chart above).
Thus, these radiosonde and surface meteorological data from the Equatorial region do not at the moment display the signature of enhanced greenhouse warming. With the observed warming rate of about 0.10455oC/decade at the surface, a warming rate of about 0.21-0.31oC/decade would have been expected at the 200 and 300 hPa levels to comply with the prognosis on this derived from the CO2 hypothesis.
*IPCC claim of "trapped" OLR 1975-2012 calculated using the IPCC formula: 5.35*ln(393.81/331.08) = .93 Wm-2
# using minimal fraction of valid points 30.00
# olr [W/m^2] from Monthly means of OLR from interpolated OLR dataset
# cutting out region lon=   -1.250  358.750, lat=  -90.000   90.000
 1975   234.1676
 1976   233.3056
 1977   231.9952
 1978   227.6897
 1979   232.2657
 1980   230.0455
 1981   230.6246
 1982   230.7409
 1983   231.3250
 1984   230.8478
 1985   231.5050
 1986   231.6427
 1987   231.5573
 1988   232.2282
 1989   232.7308
 1990   231.7560
 1991   230.7416
 1992   229.6506
 1993   229.5302
 1994   229.9730
 1995   232.1093
 1996   231.7132
 1997   231.5179
 1998   231.5533
 1999   230.0013
 2000   229.3632
 2001   231.1178
 2002   231.5232
 2003   233.2428
 2004   232.9978
 2005   232.9438
 2006   233.0898
 2007   233.2389
 2008   232.9702
 2009   233.1986
 2010   233.0779
 2011   232.8238
 2012   232.2572
The theory claims that outgoing longwave should balance the incoming energy, to within the margin of error. The surface warming is because the outgoing longwave comes from *higher up* in the atmosphere, which means there's a greater separation between the surface and the level where temperature settles to radiate as much as is absorbed, which increases the lapse-rate driven difference between that temperature and the surface.
ReplyDelete(If that's confusing, see here: http://judithcurry.com/2010/11/30/physics-of-the-atmospheric-greenhouse-effect/#comment-16901 )
The hotspot isn't due to heat being "trapped", but because temperature rise is predicted to increase humidity, leading not only to positive feedback from water vapour's greenhouse warming, but also a negative feedback from the reduction in the lapse rate. It is the reducing lapse rate that causes the hotspot, and its absence is evidence that the feedback isn't behaving as the models predicted. It doesn't falsify the greenhouse effect itself.
Feedbacks are where the argument's at.
1. Where is the observational evidence of your version of the GHE?
Delete2. A typical explanation of one version of the GHE states that increased GHGs raise the effective radiating height, which since a higher ERL is at a lower temperature, & by SB law lower temps radiate less, OLR is reduced.
3. The IPCC formula predicts OLR should have decreased .9 Wm-2 since 1975, yet observations show an increase. Are you claiming the reason for this is that water vapor feedback is negative instead of positive?
I believe the hotspot is not a prediction of greenhouse warming, but of any kind of warming.
DeleteSo, water vapor is both a negative and a positive feedback. Sounds like a ZERO sum game to me.
ReplyDeleteGreenhouse Gas 'Theory' Dismissed by Mainstream Science Prior to 1950
So, why wasn't the “greenhouse gas theory” and CO2 not an issue for leading climate researchers in the 1970's? Well, there is plenty of evidence to show that scientists appreciated that CO2 is limited in effect to a single band of thermal radiation from the Earth centred on the 14.77µ wavelength resonant with the vibration along the length of the CO2 molecule. That provides the dipole moment necessary for interaction with electromagnetic radiation. At very low atmospheric concentrations of CO2 a large percentage of the available energy radiated by the Earth in this 14.77µ band is already affected leaving very little energy for increased CO2 concentrations to affect. This is basic physics and was why the American Meteorological Society (AMS) wrote in 1951 that this was the reason why the GHE hypothesis was not given any credence by mainstream science. [4]
Back then the AMS had stated that the idea that CO2 could alter the climate “was never widely accepted and was abandoned when it was found that all the long-wave radiation [that would be] absorbed by CO2 is [already] absorbed by water vapor.” The AMS has never since published anything that scientifically refutes that statement yet, like other august national science academies merely goes along with the Hansen narrative of the "settled science" of the GHE.
Reference for "the American Meteorological Society (AMS) wrote in 1951 that this was the reason why the GHE hypothesis was not given any credence by mainstream science. [4]" ?
DeleteWhat spectral range does the OLR reported in the first graph cover? If the earth is warming, the total radiation emitted should increase (over the range range of 3-50 microns). If CO2 is absorbing radiation emitted from below, then the outgoing radiation in the range of CO2 absorption (~10.5 - 11.0 microns) will be reduced.
ReplyDeleteMost of the LWIR under the blue curve. Note CO2 absorption bands are mostly overlapped by water vapor.
Deletehttp://upload.wikimedia.org/wikipedia/commons/7/7c/Atmospheric_Transmission.png
see also here for a blowup of the overlap and thus trivial effect of CO2:
http://hockeyschtick.blogspot.com/2010/09/co2-is-bit-player-in-global-warming.html
CO2 vs. OLR doesn't show a linear or logarithmic effect:
http://www.climate4you.com/images/OLR%20versus%20CO2%20Equator.gif
The direct dependence is a 4th order one, but even a simple linear regression gives an R^2 of 0.96. Every 1 °C change in temperature results in a 2.2 W/m^2 increase in NH OLR. There is simply no physical method by which CO2 is capable of overcoming this barrier. There never has been and there never will be. This is why global warming by means of CO2 level is impossible and always will be impossible.
http://hockeyschtick.blogspot.com/2012/06/graph-that-disproves-agw.html
http://theinconvenientskeptic.com/2012/05/the-science-of-why-the-theory-of-global-warming-is-incorrect/
https://tallbloke.wordpress.com/2012/09/21/a-simple-logical-argument-about-global-warming/
Modtran also calculates a similar decrease in OLR for the CO2 increase from 331.08 ppm to 393.81 from 288.44 Wm-2 to 287.624, a change of -.82 Wm/2 in OLR
Deletehttp://forecast.uchicago.edu/Projects/modtran.html
I did a similar calculation and got a very similar graph. I'm not sure how to reconcile this result.
DeleteThere are two points to note however. Firstly, it is the reduction in total emitted radiation that drives warming - if the warming itself causes some increase OLR - which it will - that has to be less than the reduction caused by GHGs. Otherwise the Earth is not warming.
A second point is that the OLR reduction should be looked at with respect to incoming changes of solar radiation. You could have increasing OLR, and the Earth warming at the same time, if the increased OLR matches some increase in incoming solar radiation.
So far, I've not managed to find any evidence that the incoming radiation has increased in a way that accounts for the changes in average OLR.
I also wonder if there is something about the data itself, given that it is a series taken from different combinations of satellite data over time.
For the record, I am not in the least bit skeptical about the realty of AGW. I am interested in how to explain this data though.
A satellite mission to directly measure Earth's radiative balance is being launched next year to measure it directly for the first time.
DeleteIf the data doesn't fit the theory, you should be skeptical, otherwise you are practicing religion, not science.
Another paper finding no hot spot:
ReplyDeletehttp://hockeyschtick.blogspot.com/2012/10/new-paper-falsifies-basis-of-theory-of.html
A paper from 2011 on OLR and climate sensitivity:
ReplyDeletehttp://www.friendsofscience.org/assets/documents/OLR&NGF_June2011.pdf
The OLR data shown in the first figure covers the entire spectral range. Can someone direct me to the data (or a reference) which shows outgoing emissions specifically in the CO2 spectral region (something like 14 – 16 microns)?
ReplyDeleteNasa: CO2 acts as a natural thermostat
ReplyDeletehttp://science.nasa.gov/science-news/science-at-nasa/2012/22mar_saber/