
from NATURE, VOL 392, APRIL 23, 1998
and the latest Mann hockey stick version:
The temperature anomalies on that chart are ridiculous to anyone who has studied history. The Medieval Warming period and the Little Ice Age are as factual as the Holocaust, and yet the hockey stick graph denies their existence. The temperature record shown in the Mann graph is completely contrary to the recorded and archaeological facts. The graph below is a better match to the historical record.
In 1995, the Intergovernmental Panel on Climate Change (IPCC) released its 5-yearly report on climate change, in a blaze of publicity, which contained the now infamous phrase that there was "a discernible human influence on global climate".
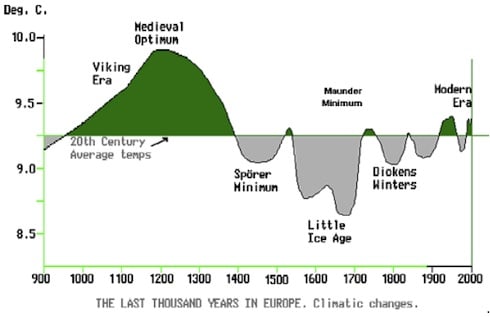
In their previous 1990 report, the IPCC illustrated their, then, understanding of how global climate had changed, not just during the previous 95 years, but also the past 1,000 years. In so doing they presented this graph (below) of temperature change since 900 AD.
Recent news coverage portrays the twentieth century as the meanest, baddest, hottest century of the last 1,000 years--all because of a human-induced rise in atmospheric carbon dioxide. But is it so? By 1965, the great British climatologist Hubert H. Lamb had synthesized indications of past warm and cold periods spread over the world:
. . . [M]ultifarious evidence of a meteorological nature from historical records, as well as archaeological, botanical, and glaciological evidence in various parts of the world from the Arctic to New Zealand . . . has been found to suggest a warmer epoch lasting several centuries between about A.D. 900 or 1000 and about 1200 or 1300. . . . Both the "Little Optimum" in the early Middle Ages and the cold epochs [i.e., "Little Ice Age" --Editors], now known to have reached its culminating stages between 1550 and 1700, can today be substantiated by enough data to repay meteorological investigation. . . .
In more than three decades of attentive research Lamb's optimism has blossomed into facts about the last 1,000 years' climate change. With better tools and techniques, researchers have gathered comprehensive information about past climate change from proxies such as tree rings, pollen, coral, glaciers, boreholes, and sea sediments sampled worldwide.
According to the reconstructed records, people in many parts of the world experienced a relative warmth early in the millennium, called the Little Optimum (LO), and a cool period a few centuries later, labeled the Little Ice Age (LIA).
Examples are geographically widespread and numerous. In central Argentina during the LO, glaciers retreated and the plains regions turned warm and humid. During the LIA, glaciers advanced and the plains became cooler and semi-arid.
Study of the cultivation of subtropical citrus trees and herbs shows Northeast China had a temperature about 1C higher than today between 1100 and 1200 A.D. That same region felt the chill of the LIA between 1550 and 1750 A.D., and that period was the coldest of the last 2000 years, according to oxygen isotope measurements in peat cellulose.
The temperature in the interior of South Africa was higher by 3C during the LO and lower by 1C during the LIA compared with today, based on measurements of carbon and oxygen isotopes in stalagmites. The surface temperature of the Sargasso Sea in the North Atlantic exhibited a 1C rise 1,000 years ago and 1C decrease about 400 years ago, as shown by the level of the oxygen isotope in seafloor sediments.
Borehole measurements into the Greenland ice sheet indicate a temperature 1C higher around 1000 A.D. and 1C cooler between 1500 and 1850 A.D. Other borehole measurements made worldwide confirm a warmth during the LO as high as 0.5 C above present temperatures and as low as 0.7C below current values during the LIA.
In western Europe, documentary evidence describes the moderation of harsh winters from 900 to 1300 A.D. relative to those from 1300 to 1900. During the LO, atypical subtropical plants such as olive trees grew in the Po valley of Northern Italy, and fig trees near Cologne, Germany.
More information gathered around the world confirms anomalous climate conditions during the Little Ice Age and Little Optimum. For example, in northwestern Minnesota, lake sediments reveal dustier, and therefore probably much windier, conditions during the LIA than today. Other studies examine such evidence as tree growth ranging from the near Arctic, Siberia, and Alaska to Chile, New Zealand, and Tasmania; documentary and glacier evidence worldwide; pollen and phenological indicators in China; and lake fossils in Africa and the U.S. Great Plains.
The concordance of those diverse climate indicators over the world says that the twentieth century was not unusually warm compared with earlier times. Cambridge University researchers write that the medieval warming "was a global event occurring between about 900 and 1250 A.D., possibly interrupted by a minor re-advance of ice between about 1050 and 1150 A.D."
Other researchers state, "Extreme [climate] events in the [South African] record show distinct teleconnections with similar events in other parts of the world, in both the northern and southern hemispheres."
A scientist from Stockholm University concludes, "The pattern of frequent and rapid changes in climate throughout the Holocene indicates that the warming of the last 100 years is not a unique event and is thus not an indication of human impact on the climate, as is frequently claimed."
The facts are simple. The Little Optimum and Little Ice Age were real. They were also widespread over the globe. The twentieth century is not the least bit climatically unusual. So why the recent media hysteria that the twentieth century is the warmest of the last 1,000 years?
Sallie Baliunas, Ph.D., and Willie Soon, Ph.D., are colleagues at the Harvard-Smithsonian Center for Astrophysics. Made available through Heartland Institute for Public Policy.
Appeared earlier in Objective Science.com.
References:
Coccale, M.A., 1999. Climatic fluctuation in the Central region of Argentina in the last 1000 years. Quaternary International, 62, 35-47.
Dahl-Jensen, D., et al., 1998. Past temperatures directly from the Greenland ice sheet. Science, 282, 268-271.
Dean, W.E., and A. Schwalb, 2000. Holocene environmental and climatic change in the Northern Great Plains as recorded in the geochemistry of sediments in Pickerel Lake, South Dakota. Quaternary International, 67, 5-20.
Grove, J.M., and R. Switsur, 1994. Glacial geological evidence for the medieval warm period. Climatic Change, 26, 143-169.
Hong, Y.T., et al., 2000. Response of climate to solar forcing recorded in a 6000-year time-series of Chinese peat cellulose. The Holocene, 10, 1-7.
Huang, S., H.N. Pollack, and P.Y. Shen, 1997. Late quaternary temperature changes seen in world-wide continental heat flow measurements. Geophysical Research Letters, 24, 1947-1950.
Karlén, W., 1998. Climate variations and the enhanced greenhouse effect. Ambio, 27, 270-274.
Keigwin, L.D., 1996. The Little Ice Age and Medieval Warm Period in the Sargasso Sea. Science, 274, 1504-1508.
Lamb, H.H., 1965. The early medieval warm epoch and its sequel. Palaeogeography, Palaeoclimatology, Palaeoecology, 1, 13-37.
Pfister, C. et al., 1998. Winter air temperature variations in western Europe during the Early and High Middle Ages (A.D. 7501300). The Holocene, 8, 535-552.
Tyson, P.D., et al., 2000. The Little Ice Age and medieval warming in South Africa. South African Journal of Science, 96, 121-126.
Figure 1. Changes in the relative level of oxygen isotope for the last 6,000 years from peat bogs in northeastern China (from Y.T. Hong, and colleagues).
borehole reconstruction data can be based on erroneous assumptions up to 50% in error:
ReplyDeletehttp://www.clim-past.net/10/1693/2014/cp-10-1693-2014.html